. 2019 Jun:24:101181.
doi: 10.1016/j.redox.2019.101181. Epub 2019 Apr 2.

Enhanced autophagic-lysosomal activity and increased BAG3-mediated selective macroautophagy as adaptive response of neuronal cells to chronic oxidative stress

Affiliations

Enhanced autophagic-lysosomal activity and increased BAG3-mediated selective macroautophagy as adaptive response of neuronal cells to chronic oxidative stress

Debapriya Chakraborty et al. Redox Biol. 2019 Jun.

Abstract

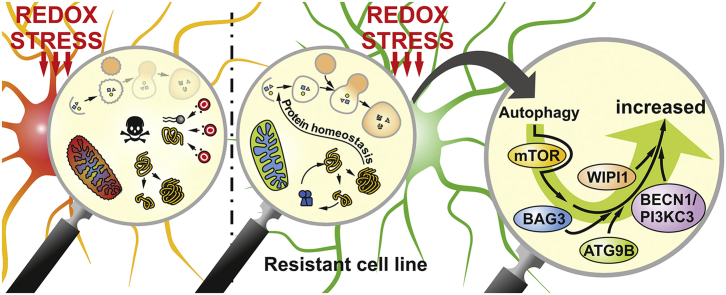
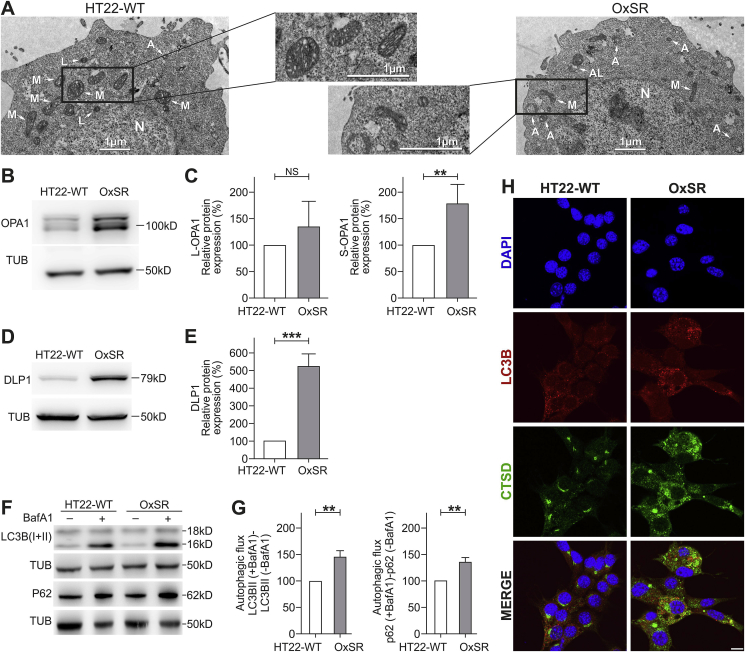
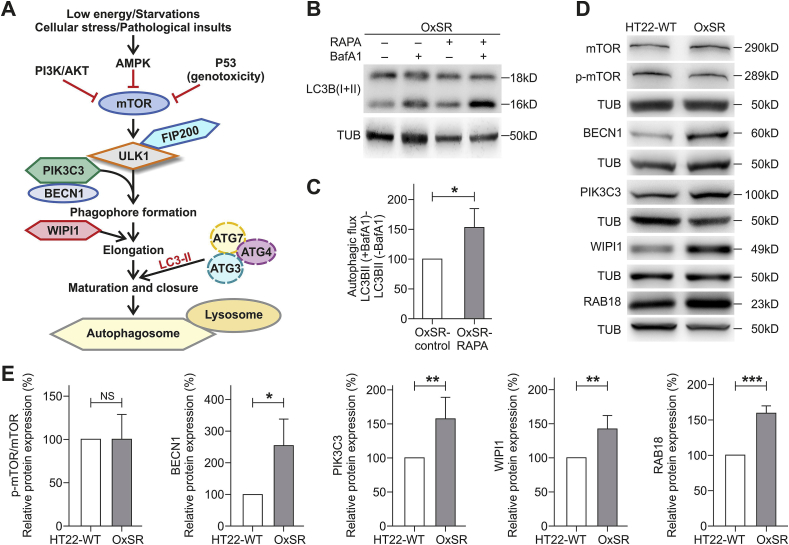
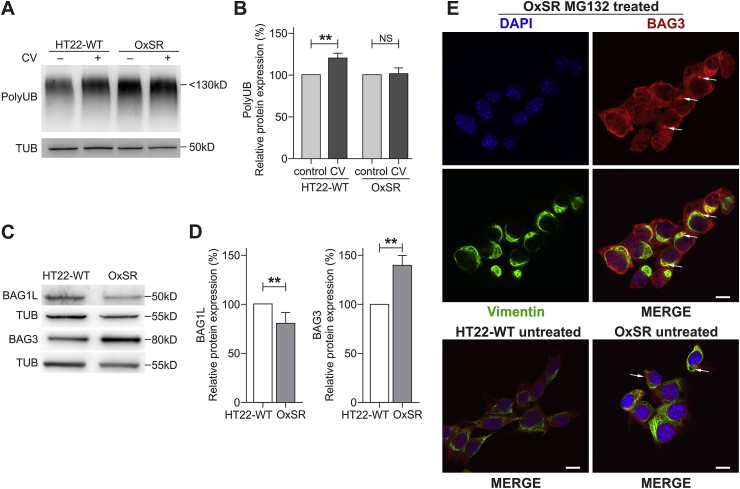
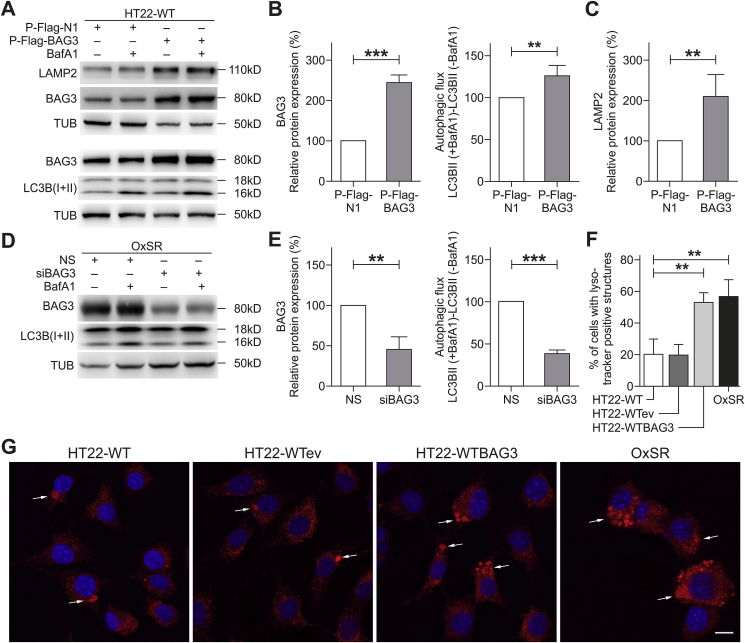
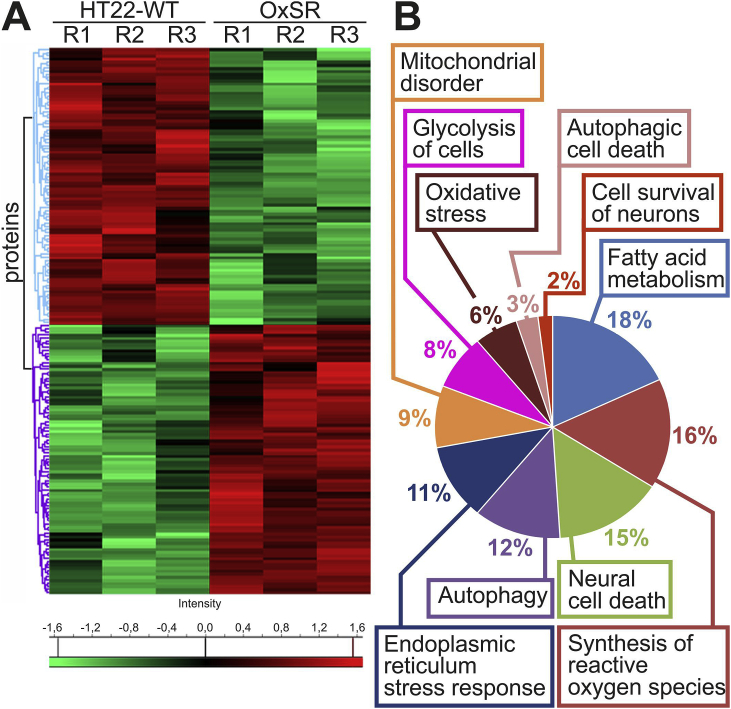
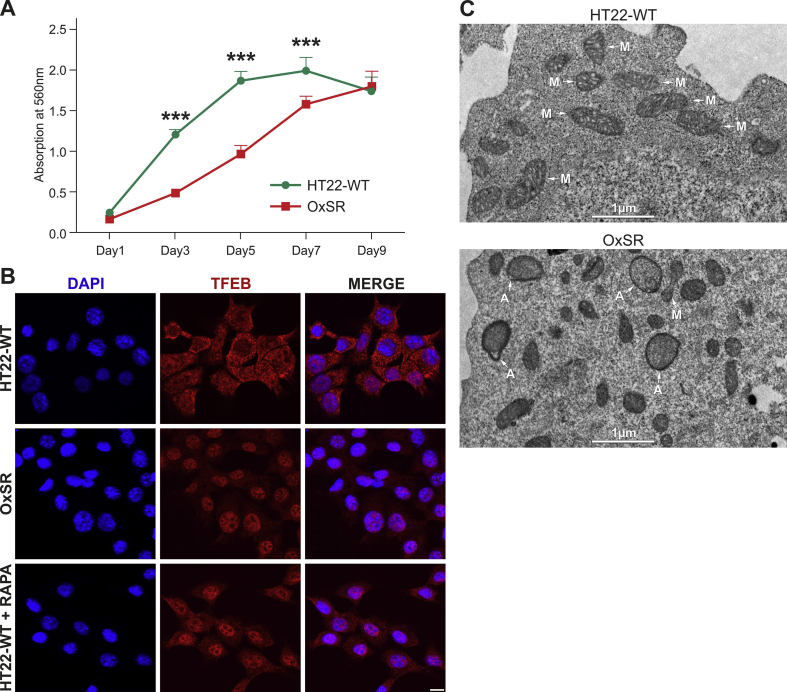
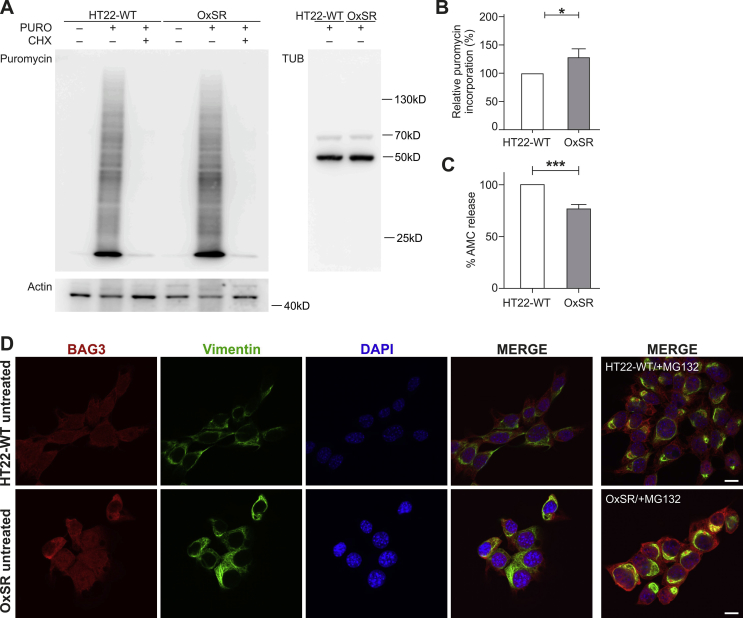
Oxidative stress and a disturbed cellular protein homeostasis (proteostasis) belong to the most important hallmarks of aging and of neurodegenerative disorders. The proteasomal and autophagic-lysosomal degradation pathways are key measures to maintain proteostasis. Here, we report that hippocampal cells selected for full adaptation and resistance to oxidative stress induced by hydrogen peroxide (oxidative stress-resistant cells, OxSR cells) showed a massive increase in the expression of components of the cellular autophagic-lysosomal network and a significantly higher overall autophagic activity. A comparative expression analysis revealed that distinct key regulators of autophagy are upregulated in OxSR cells. The observed adaptive autophagic response was found to be independent of the upstream autophagy regulator mTOR but is accompanied by a significant upregulation of further downstream components of the canonical autophagy network such as Beclin1, WIPI1 and the transmembrane ATG9 proteins. Interestingly, the expression of the HSP70 co-chaperone BAG3, mediator of BAG3-mediated selective macroautophagy and highly relevant for the clearance of aggregated proteins in cells, was found to be increased in OxSR cells that were consequently able to effectively overcome proteotoxic stress. Overexpression of BAG3 in oxidative stress-sensitive HT22 wildtype cells partly established the vesicular phenotype and the enhanced autophagic flux seen in OxSR cells suggesting that BAG3 takes over an important part in the adaptation process. A full proteome analysis demonstrated additional changes in the expression of mitochondrial proteins, metabolic enzymes and different pathway regulators in OxSR cells as consequence of the adaptation to oxidative stress in addition to autophagy-related proteins. Taken together, this analysis revealed a wide variety of pathways and players that act as adaptive response to chronic redox stress in neuronal cells.

Keywords: Adaptation; Autophagy; BAG3; Oxidative stress; Protein homeostasis.


Figures

Image 1
Graphical abstract
Fig. 1
Fig. 1
OxSR cells show higher autophagic activity. (A) Ultrastructure analysis of HT22-WT and OxSR cells by TEM. OxSR cells clearly showed increased number and size of highly electron dense vacuolar autophagic vesicles at different stages of maturity and changes in overall mitochondrial morphology (representative images are shown; see further images in Suppl. Fig. S1C). Autophagosomes are indicated by A, autolysosomes by AL, nucleus by N and mitochondria by M. (B–E) Protein extracts from untreated samples of HT22-WT and OxSR cells were analyzed by Western blotting for OPA1 (B) and DLP1 (D) expression. Tubulin (TUB) was used as loading control. Bar graphs show changes in L-OPA1 and S-OPA1 (C) as well as in DLP1 protein levels (E) obtained by densitometry analysis and normalization to tubulin. Values represent mean ± S.E.M.; OPA1: n = 5, **p < 0.01; DLP1: n = 3, ***p < 0.001 and NS for no significant statistical difference. Control HT22-WT cells were set to 100%. (F, G) Protein extracts from HT22-WT and OxSR cells have been taken after 6 h of BafA1 (8 μM) treatment and expression of the indicated proteins was detected by Western blotting. The autophagic flux was measured after densitometric analysis. Therefore, tubulin normalized LC3B-II and P62 levels in the absence of the lysosomal inhibitor were subtracted from corresponding levels obtained in the presence of BafA1. Tubulin (TUB) was used as loading control. Values represent mean ± S.E.M., n = 3, **p < 0.01 and control HT22-WT cells were set to 100%. (H) HT22-WT and OxSR cells were immunohistochemically stained against LC3B and Cathepsin D (CTSD). DAPI (blue) was used to stain DNA. Scale bar: 10 μm. Pictures were taken by confocal microscopy. (For interpretation of the references to colour in this figure legend, the reader is referred to the Web version of this article.)
Fig. 2
Fig. 2
Adaptation to oxidative stress enhances expression of Beclin1, WIPI1, PIK3C3 and RAB18. (A) Scheme displays major regulators of canonical autophagy. (B, C) OxSR cells were incubated simultaneously with 10 μM Rapamycin (RAPA) and 8 μM of BafA1 for 4 h and expression of the indicated proteins was detected by Western blotting. The autophagic flux was measured after densitometry analysis with LC3B-II levels normalized to tubulin. Values represent mean ± S.E.M., n = 4, *p < 0.05 and autophagic flux of untreated OxSR cells were set as control 100%. (D, E) Protein extracts from untreated HT22-WT and OxSR cells were used to perform Western blot analysis for detection of indicated proteins. The diagrams display the indicated protein levels after normalization to corresponding tubulin. Values represent mean ± S.E.M., n = 3 to 5, *p < 0.05, **p < 0.01, ***p < 0.001 and NS for no significant statistical difference. Control HT22-WT cells were set to 100%.
Fig. 3
Fig. 3
OxSR cells overcome proteotoxic stress more effectively than HT22-WT cells and show an altered BAG1/BAG3 expression. (A, B) Protein extracts from untreated and canavanine- (CV-) treated samples (at 4 mM) of HT22-WT and OxSR cells were analyzed by Western blot for indicated proteins. Bar graphs represent changes in polyubiquitinated protein levels between untreated control and treated samples obtained by densitometric analysis after normalized to tubulin. Values represent mean ± S.E.M., n = 3, **p < 0.01 and NS for no significant statistical difference. Polyubiquitinated proteins in untreated cells were set as control 100%. (C, D) Protein extracts from untreated HT22-WT and OxSR cells were subjected to Western blot analysis for BAG1 and BAG3 expression; tubulin was used as loading control. The expression of BAG1L and BAG3 was quantified by densitometry analysis and normalization to tubulin. Values represent mean ± S.E.M., n = 3 to 4, **p < 0.01 and control HT22 cells were set to 100%. (E) Untreated HT22-WT and OxSR as well as OxSR cells were treated with MG132 and immunocytochemically analyzed for BAG3-positive aggresomes surrounded with cage like vimentin structure by confocal microscope; arrows indicate aggresomes (see also Suppl. Fig. S2D). DAPI (blue) was used to stain DNA. Scale bars: 10 μm. (For interpretation of the references to colour in this figure legend, the reader is referred to the Web version of this article.)
Fig. 4
Fig. 4
BAG3 is required for autophagic activity in OxSR cells and BAG3 overexpression promotes autophagy in HT22-WT cells. (A–C) HT22-WT cells transfected for 48 h with empty vector (P-Flag-N1) or BAG3 overexpression vector (P-Flag-BAG3) and treated with vehicle or with 8 μM BafA1 for 6 h before the cell lysis. Protein extracts were analyzed via Western blotting for indicated proteins. Quantification of LAMP2, BAG3 expression and autophagic flux was prepared by densitometric analysis after normalization of protein levels to tubulin. Values represent mean ± S.E.M., n = 4, **p < 0.01 and ***p < 0.001. Expression in cells transfected with empty vector were set to 100%. (D, E) OxSR cells were transfected with nonsense siRNA (NS) and BAG3 siRNA (siBAG3, +/− BafA1) for 48 h. Protein extracts from vehicle or BafA1-treated cells were subjected to Western blot analysis. Quantification of BAG3 expression and autophagic flux was prepared after densitometric analysis and normalization to tubulin. Values represent mean ± S.E.M., n = 3, **p < 0.01 and ***p < 0.001. Expression in cells transfected with nonsense siRNA (NS) were set to 100%. (F) Quantitative bar graph shows number of cells with LysoTracker-positive vacuolar staining in untreated HT22-WT, HT22 transfected with empty vector (HT22-WTeV), HT22 overexpressing BAG3 (HT22-WTBAG3) and OxSR cells. Values represent mean ± S.E.M., n = 4 with 3–8 images of different microscopic fields was counted in each day for every experimental condition, **p < 0.01. (G) Representative confocal images of LysoTracker red staining (LT) in untreated HT22-WT, HT22-WTeV, HT22-WTBAG3 and OxSR cells are shown indicating the changes in lysosomal phenotype. Arrows indicate cells containing LysoTracker-stained structures. DAPI (blue) was used to stain DNA. Scale bars: 10 μm. (For interpretation of the references to colour in this figure legend, the reader is referred to the Web version of this article.)
Fig. 5
Fig. 5
Comparative proteomics analyses of the HT22-WT and OxSR cells. (A) Hierarchical clustering of the 176 differentially expressed proteins depicted as a heat map distinguishes two major clusters of proteins. The first cluster represents significantly down-regulated (green) and the second cluster up-regulated (red) proteins in OxSR cells compared to HT22-WT. R1 to R3 represent the biological replicates. (B) Pie chart displays cellular functions and abundance of proteins which are differentially expressed in OxSR cells compared to HT22-WT cells. The detailed list of proteins in each cellular functional group is provided with Suppl. File S4E. (For interpretation of the references to colour in this figure legend, the reader is referred to the Web version of this article.)
Supplemental Fig. S1
Results from cell proliferation assay, immunocytochemical analysis of TFEB and TEM ultrastructure analysis. (A) Proliferation/growth rate of HT22-WT and OxSR cells was measured by MTT assay over nine alternate days. Values represent mean ± S.E.M., n=3, *** p<0.001. (B) Immunocytochemical analysis reveals a distinct nuclear translocation of TFEB in OxSR cells compared to cytosolic distribution in HT22-WT under basal condition. HT22-WT cells were treated with 10 μM Rapamycin for 2 h to induce TFEB nuclear translocation as a positive control experiment (HT22-WT+RAPA). Scale bars: 10 μm. Images were acquired by confocal microscopy. (C) Ultrastructure analysis of HT22-WT and OxSR cells by TEM (representative images focusing on autophagosomes are shown; M indicates mirochondria, A autophagosomes).
Supplemental Fig. S2
Results from SUnSET assay, immunocytochemical analysis and determination of proteasomal activity. (A) HT22-WT and OxSR cells were treated with 5 μg/ml puromycin (PURO) or simultaneously with 60 μg/ml cycloheximide (CHX) for 30 min. Protein extracts were analyzed by Western blotting for puromycin incorporation. Actin and tubulin were used as loading controls. (B) Bar graph shows changes in puromycin incorporation obtained by densitometry analysis and normalization to tubulin. Values represent mean ± S.E.M., n = 3, *p < 0.05. Control HT22-WT cells were set to 100%. (C) Proteasomal activity of HT22-WT and OxSR cells was measured using fluorescence signal by release of AMC from proteasomal substrate Suc-LLVY-AMC by proteasomal enzyme activity. Values represent mean ± S.E.M., n = 5, ***p < 0.001. Control HT22-WT cells were set to 100%. (D) HT22-WT and OxSR cells were immunocytochemically analyzed for BAG3 and vimentin by confocal microscope; additional channels displayed referring to Fig. 3E. DAPI (blue) was used to stain DNA. Scale bars: 10 μm.
Supplemental Fig. S3
PPI Networks of the significantly differentially expressed proteins in OxSR cells. (A) The protein-protein interaction (PPI) network of the differentially expressed proteins analyzed by IPA analysis demonstrated the involvement of three major protein clusters in autophagy, mitochondrial disorders and oxidative stress-related processes. Red and green colors of the molecules indicate up- and down-regulation of the proteins, respectively, and different intensities correspond to the magnitude of expression change of the individual proteins. The proteins were further distinguished according to their cellular localization and molecular functional classes with different shapes representing enzymes, ion channels, peptidases, transmembrane receptors etc. (B) Additional overview table linking changed expression of proteins to autophagy, oxidative stress, and mitochondrial disorder. The detailed result is also provided in Suppl. File S4E.

References

    1. Liguori I., Russo G., Curcio F., Bulli G., Aran L., Della-Morte D., Gargiulo G., Testa G., Cacciatore F., Bonaduce D., Abete P. Oxidative stress, aging, and diseases. Clin. Interv. Aging. 2018;13:757–772. - PMC - PubMed
    1. Hensley K., Hall N., Subramaniam R., Cole P., Harris M., Aksenov M., Aksenova M., Gabbita S.P., Wu J.F., Carney J.M. Brain regional correspondence between Alzheimer's disease histopathology and biomarkers of protein oxidation. J. Neurochem. 1995;65:2146–2156. - PubMed
    1. Di Domenico F., Tramutola A., Butterfield D.A. Role of 4-hydroxy-2-nonenal (HNE) in the pathogenesis of alzheimer disease and other selected age-related neurodegenerative disorders. Free Radic. Biol. Med. 2017;111:253–261. - PubMed
    1. Go´ mez-Isla T., Hollister R., West H., Mui S., Growdon J.H., Petersen C.R., Parisi E.J., Hyman B.T. Neuronl loss correlates with but exceeds neurofibrillary tangles in Alzheimer's disease. Am. Neurol. Associat. 1996;41:17–24. - PubMed
    1. Go´ mez-Isla T., Price J.L., McKeel D.W., Morris J.C., Growdon J.H., Hyman B.T. Profound loss of layer II entorhinal cortex neurons occurs in very mild Alzheimer's disease. J. Neurosci. 1996;16:4491–4500. - PMC - PubMed

Publication types

Substances

LinkOut - more resources