. 2019 May;569(7756):361-367.
doi: 10.1038/s41586-019-1127-1. Epub 2019 Apr 8.

The emergent landscape of the mouse gut endoderm at single-cell resolution

Affiliations

The emergent landscape of the mouse gut endoderm at single-cell resolution

Sonja Nowotschin et al. Nature. 2019 May.

Abstract

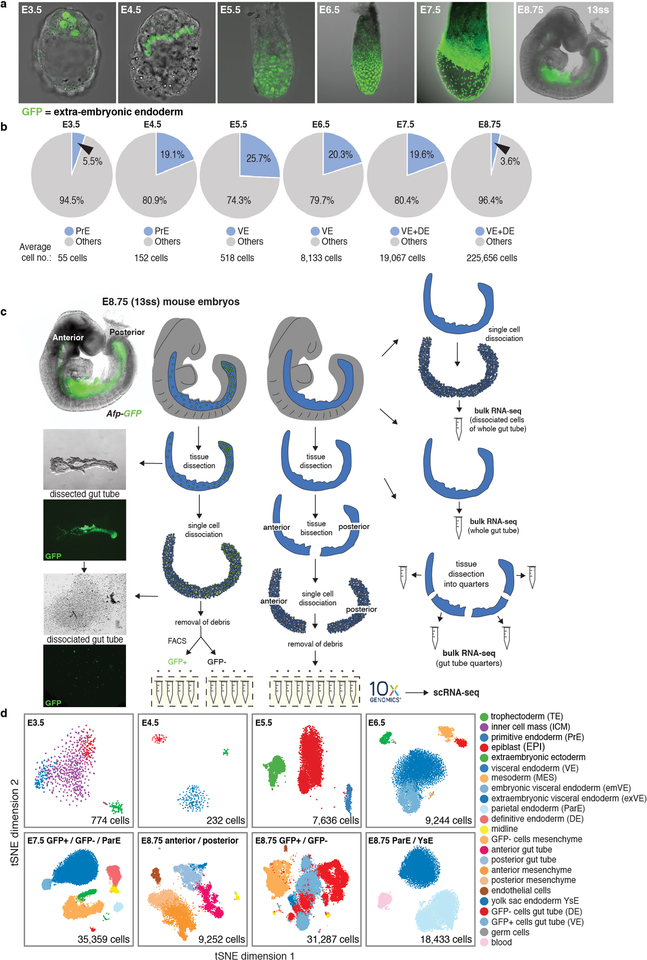
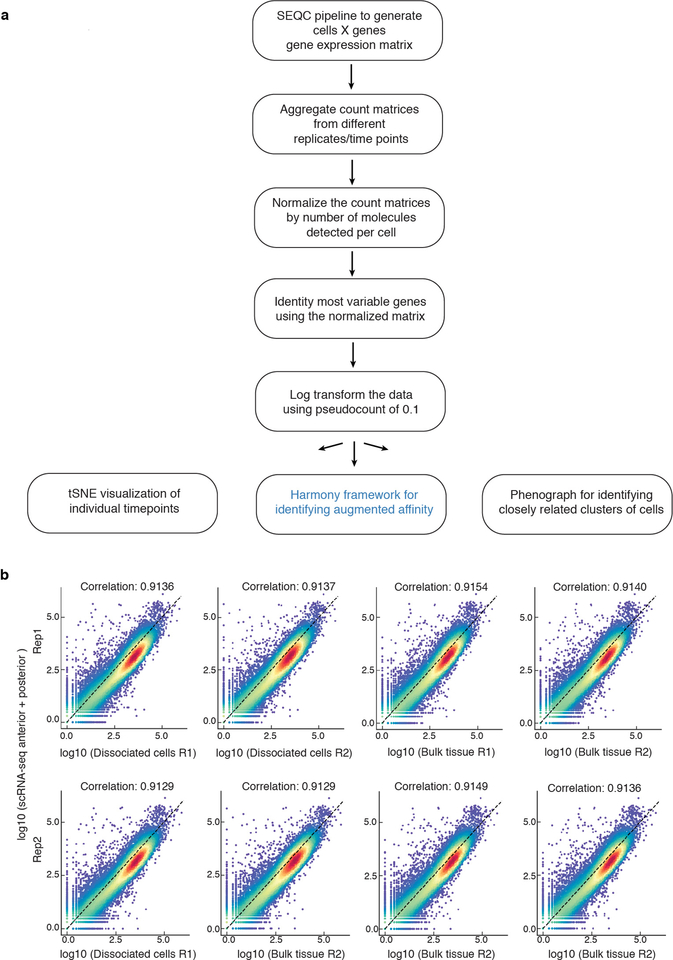
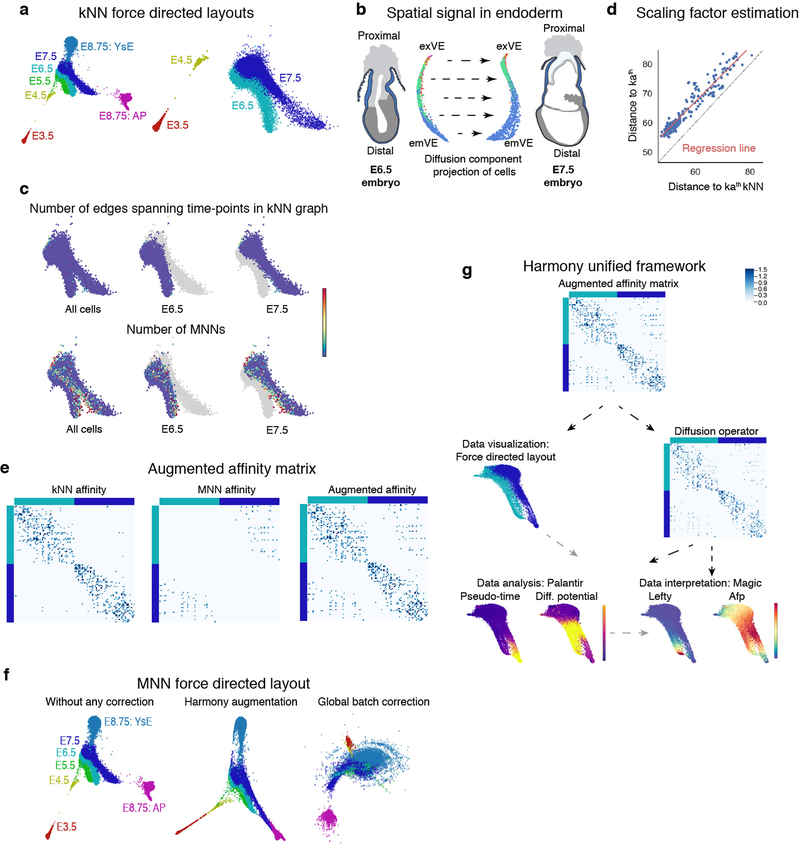
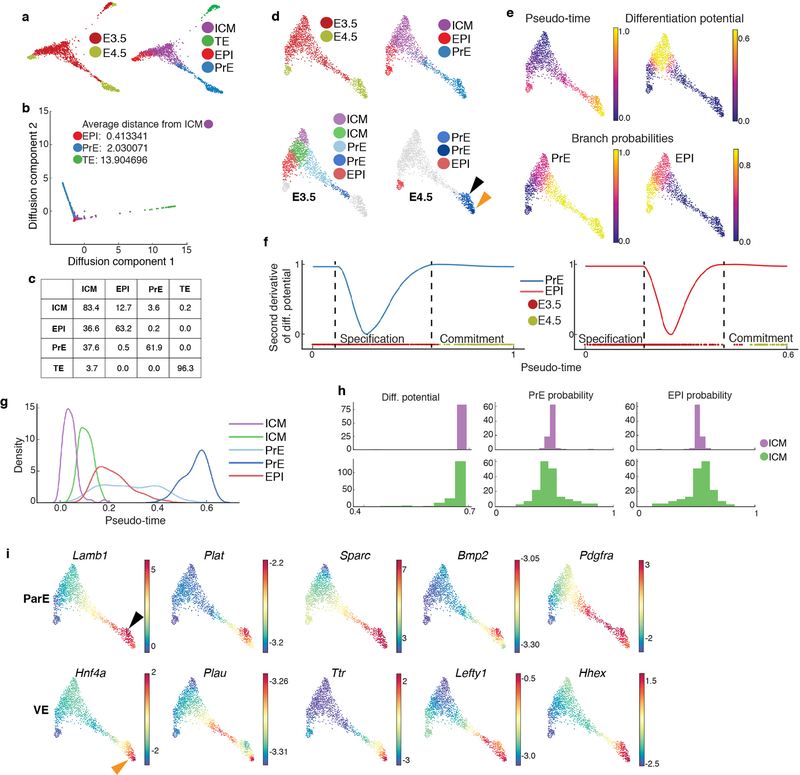
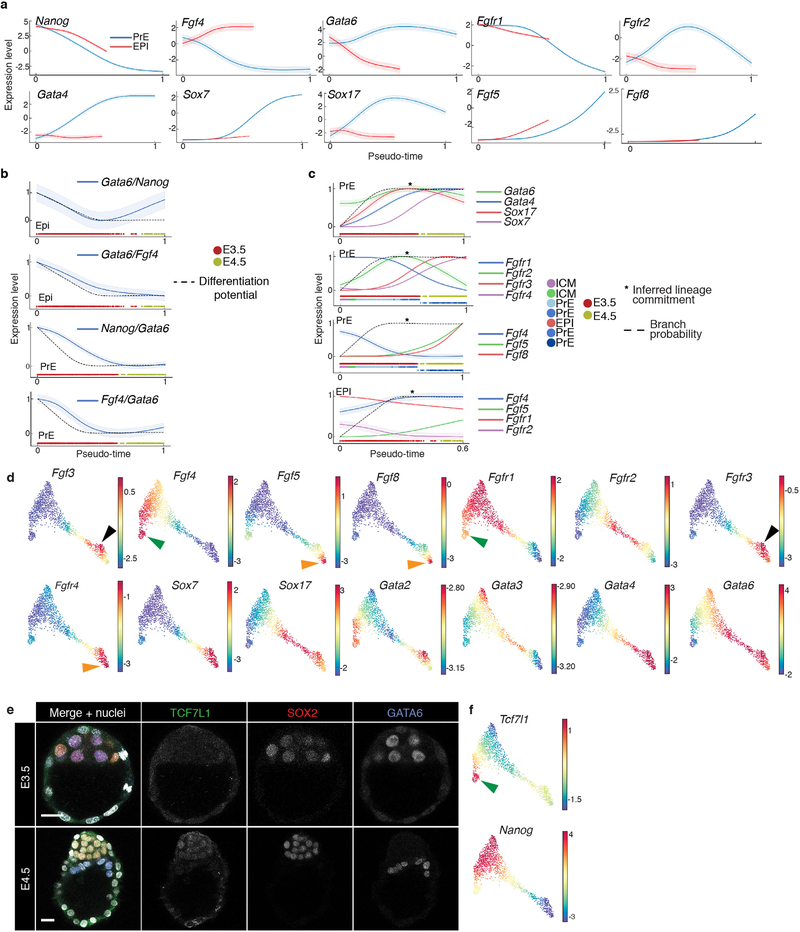
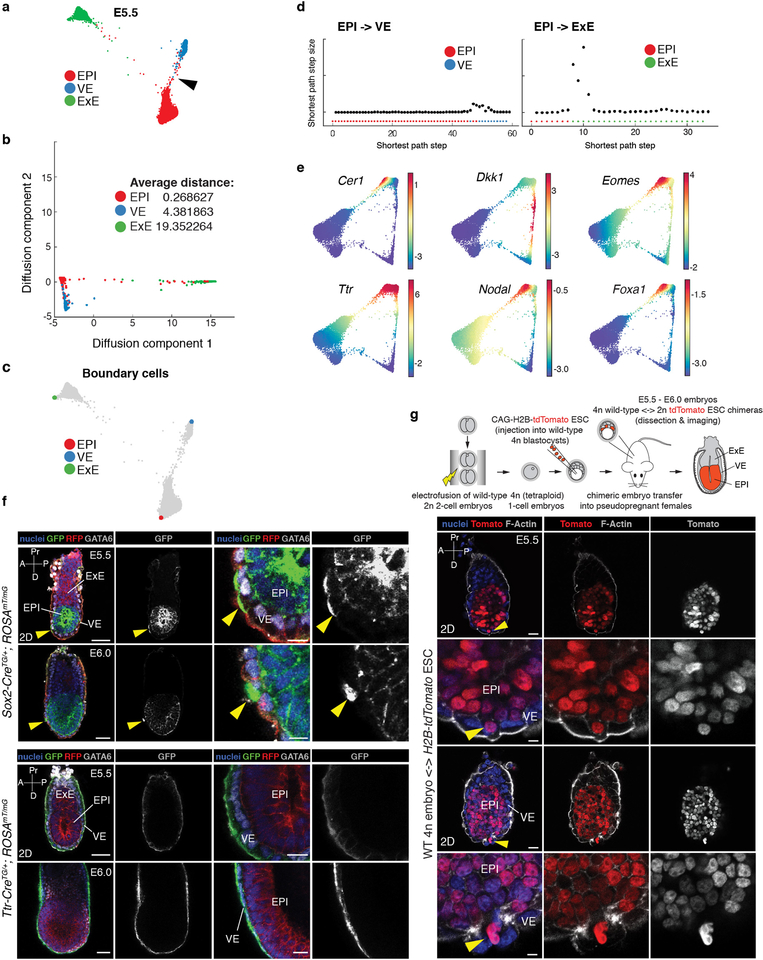
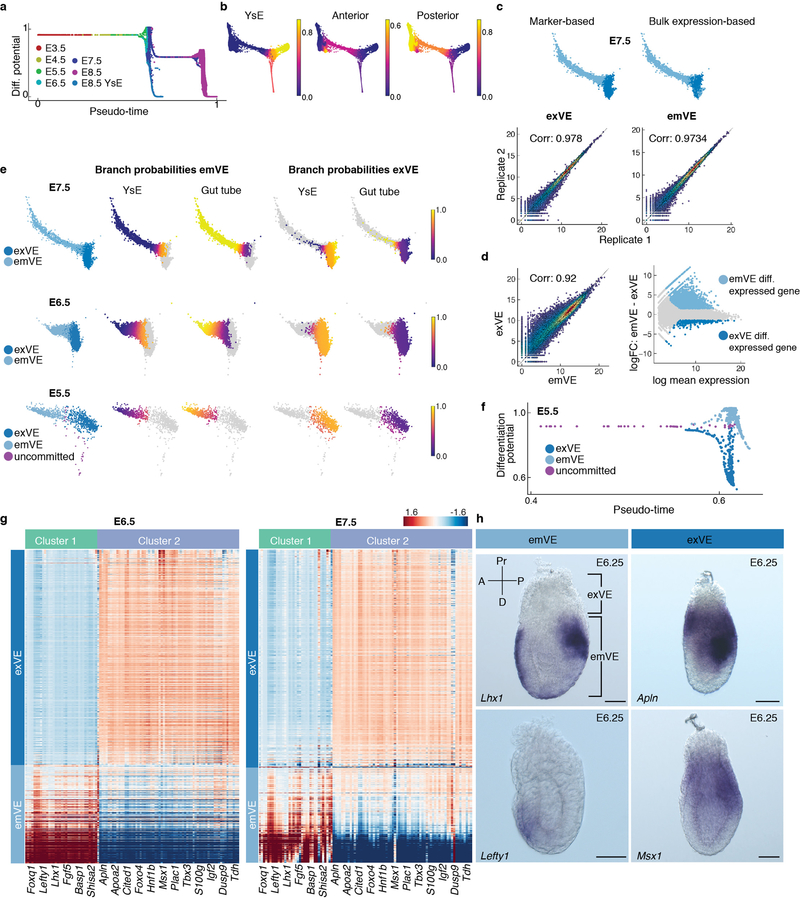
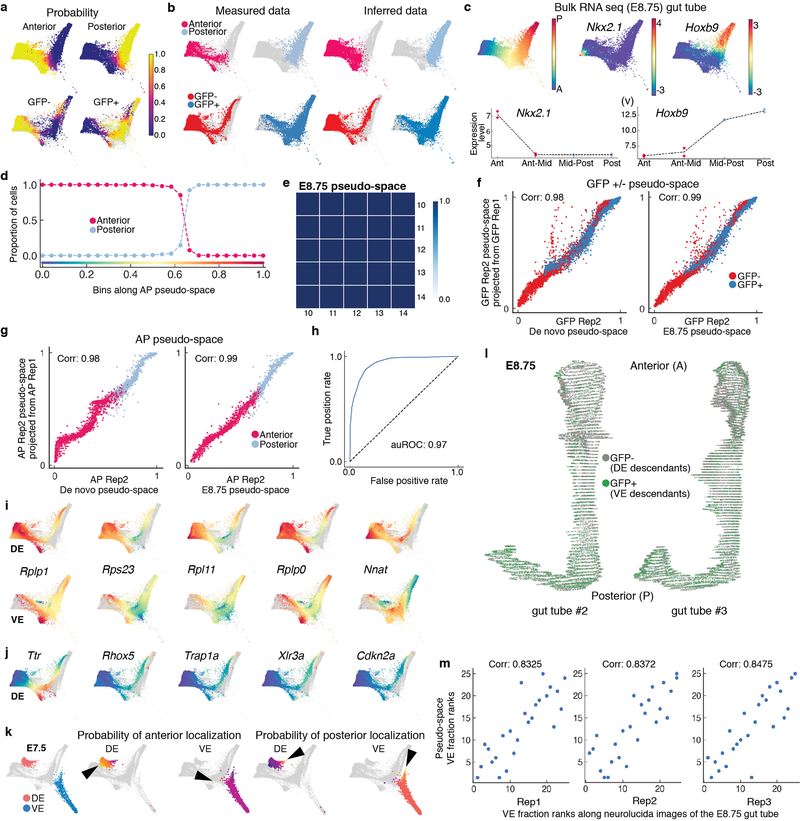
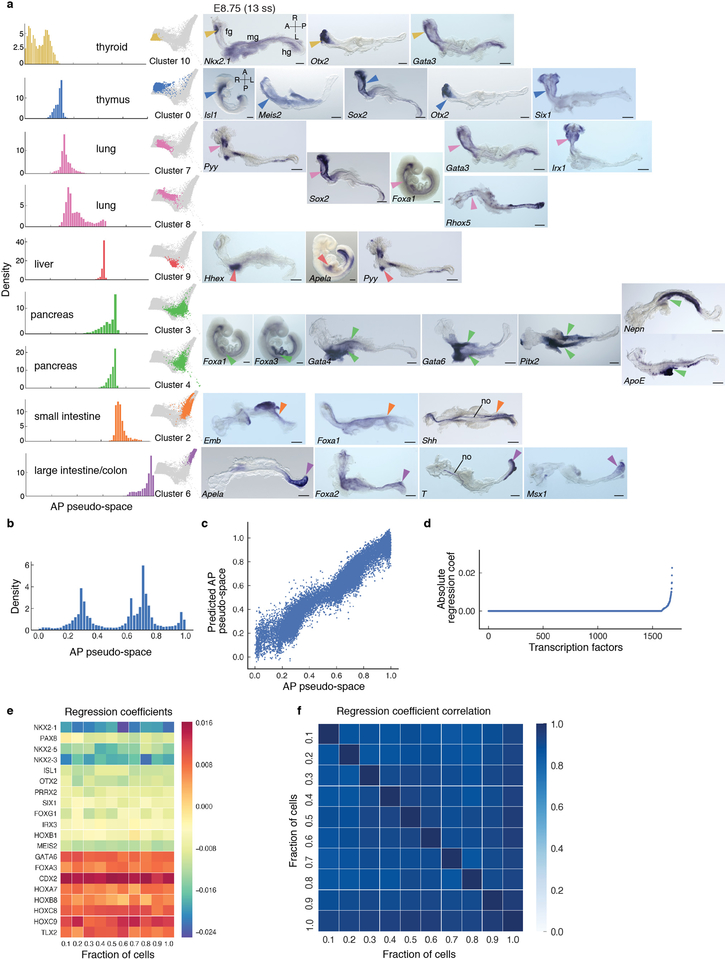
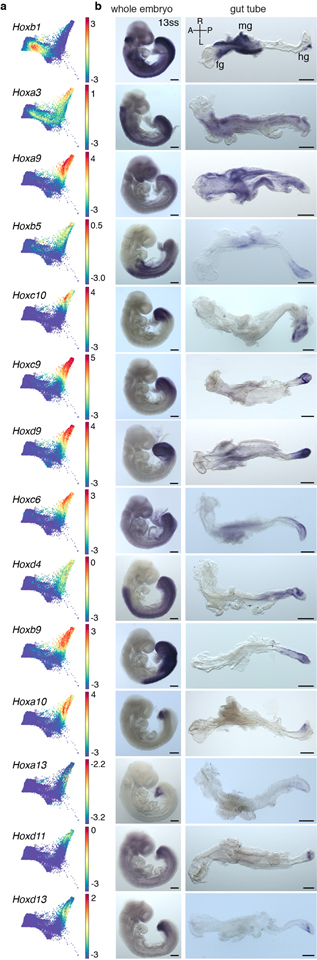
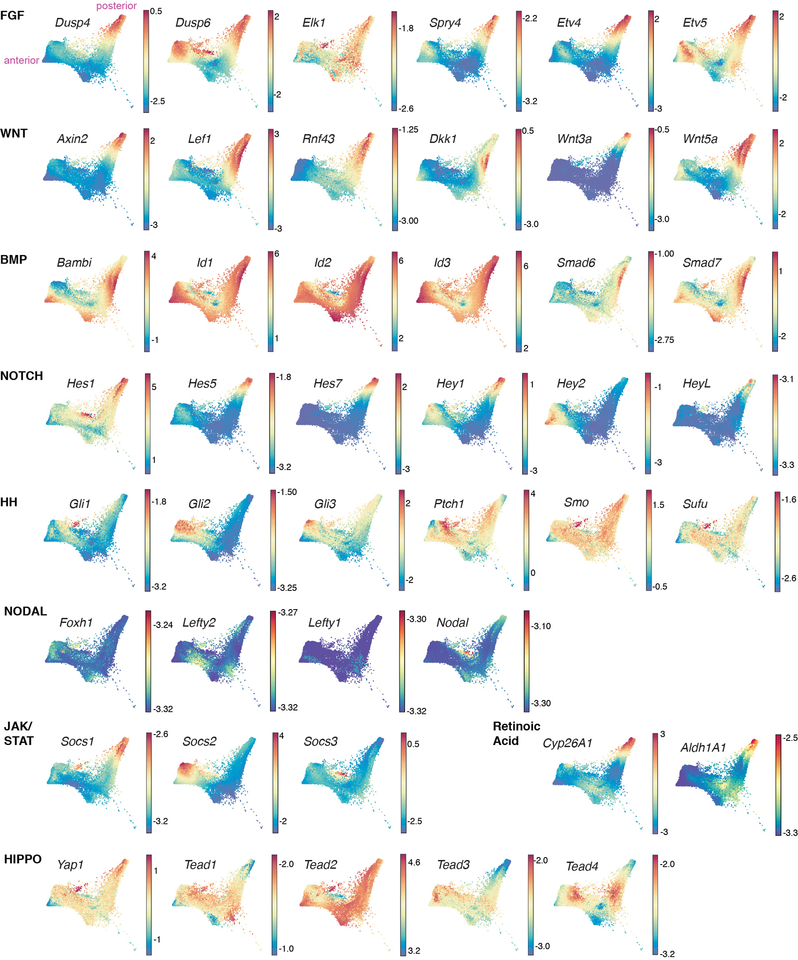
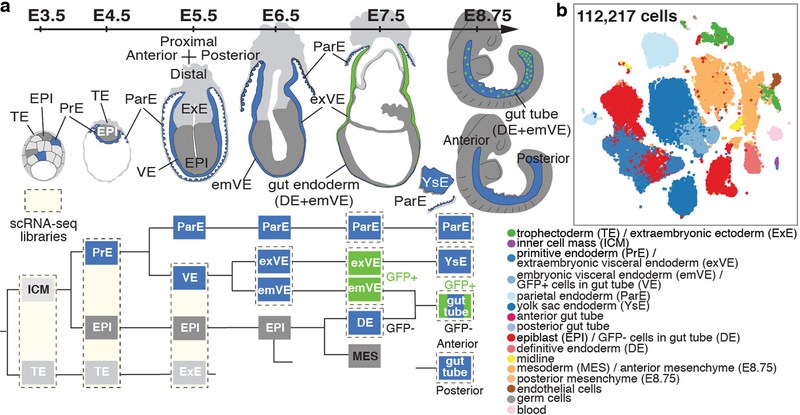
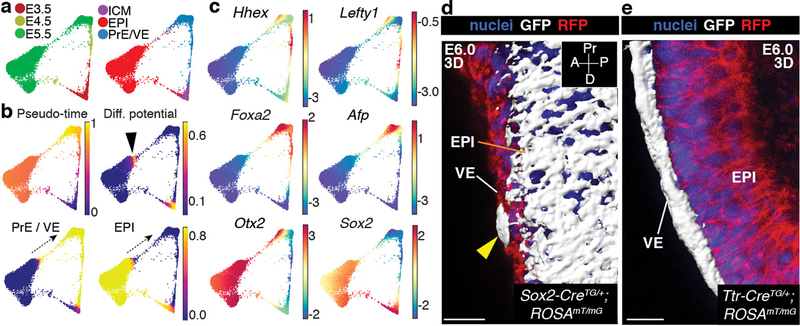
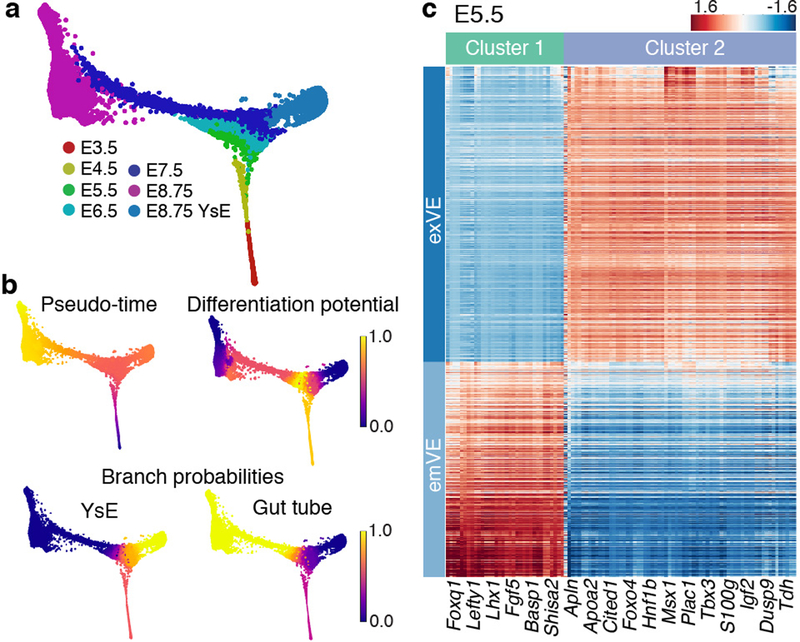
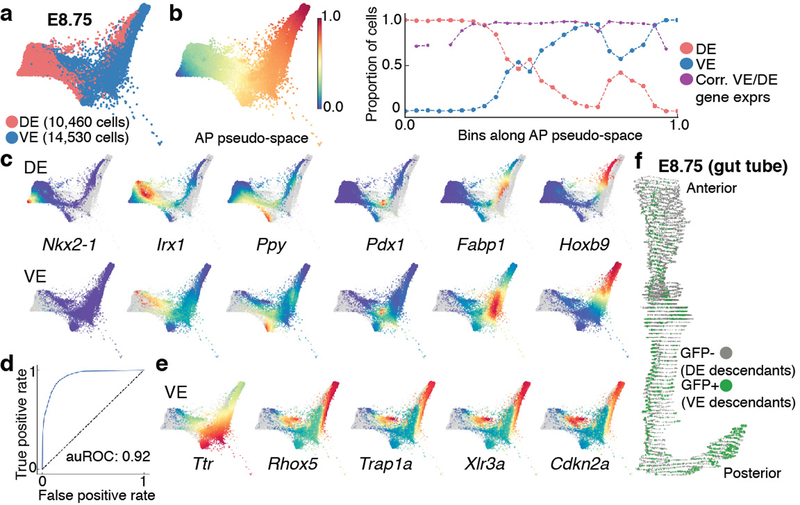
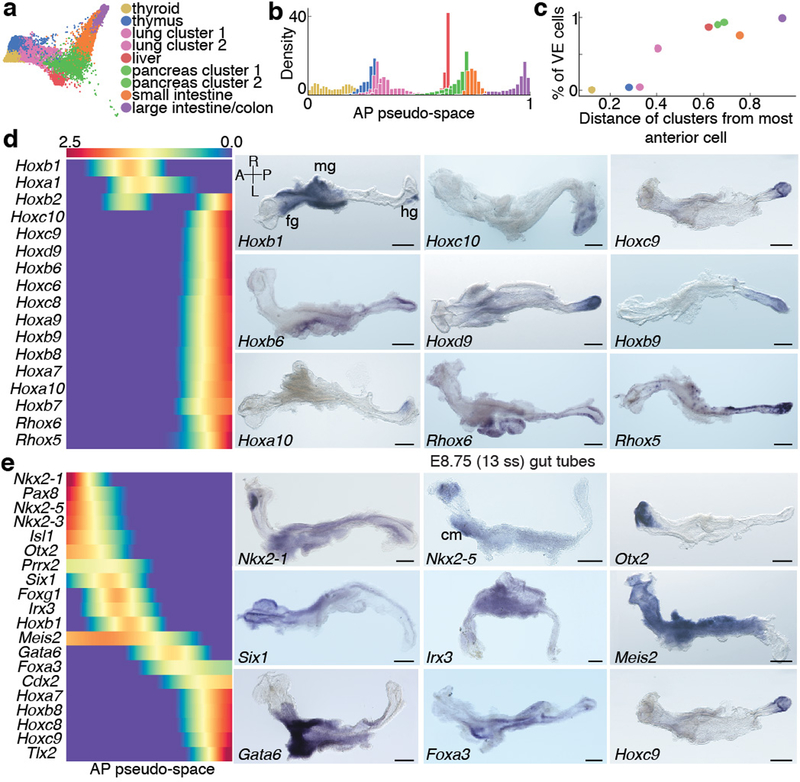
Here we delineate the ontogeny of the mammalian endoderm by generating 112,217 single-cell transcriptomes, which represent all endoderm populations within the mouse embryo until midgestation. We use graph-based approaches to model differentiating cells, which provides a spatio-temporal characterization of developmental trajectories and defines the transcriptional architecture that accompanies the emergence of the first (primitive or extra-embryonic) endodermal population and its sister pluripotent (embryonic) epiblast lineage. We uncover a relationship between descendants of these two lineages, in which epiblast cells differentiate into endoderm at two distinct time points-before and during gastrulation. Trajectories of endoderm cells were mapped as they acquired embryonic versus extra-embryonic fates and as they spatially converged within the nascent gut endoderm, which revealed these cells to be globally similar but retain aspects of their lineage history. We observed the regionalized identity of cells along the anterior-posterior axis of the emergent gut tube, which reflects their embryonic or extra-embryonic origin, and the coordinated patterning of these cells into organ-specific territories.


Conflict of interest statement

Competing interests

S.C.B and D.M.C. are employees and shareholders at 10x Genomics.

Figures

Extended Data Figure 1:
Extended Data Figure 1:. Endoderm cell representation in mouse embryos, from blastocyst through midgestation, and single-cell collection pipeline.
a, Distribution of extra-embryonic endoderm cells (GFP/green) from blastocyst (E3.5) to midgestation (E8.75, 13ss) demarcated using PdgfraH2B-GFP20 (pre-implantation stages) and Afp-GFP (post-implantation stages) reporters. Extra-embryonic endoderm (PrE and VE derivatives) cells contribute to the gut tube of the E8.75 embryo. b, Pie charts depicting fraction of endoderm cells per embryo, for all stages analyzed in this study. c, Schematic of protocol used for single cell collection, with E8.75 gut tube provided as an example. Gut tubes were micro-dissected from embryos, then dissociated into single cells. Single cells of either anterior and posterior halves of gut tubes, or AFP-GFP-positive (VE descendants) and AFP-GFP-negative (DE descendants) collected using FACS, were used for single-cell 3’ mRNA library construction on the 10x Genomics Chromium platform. For bulk RNA-seq, whole gut tubes dissociated into single cells and then pooled, whole intact gut tubes, and whole gut tubes dissected into quarters, were collected for sequencing. d, tSNE plots of collected libraries for each time-point with each dot representing a single cell. Phenograph was used to identify clusters of cells, color-coded by cell type with annotation based on expression of known markers.
Extended Data Figure 2:
Extended Data Figure 2:. Computational pipeline and comparison of scRNA-seq with bulk RNA-seq data.
a, Flow chart of computational data processing pipeline. b, Plots showing the Pearson correlation between aggregated scRNA-seq data of anterior and posterior halves of the gut tube with bulk RNA-seq of dissociated (and pooled) cells and bulk tissue, respectively. The two rows represent two replicates.
Extended Data Figure 3:
Extended Data Figure 3:. MNN augmentation to correct batch effects between time-points and Harmony unified framework for scRNA-seq data analysis.
a, Force directed layouts for cells of the following time-points: E3.5, E4.5, E5.5, E6.5, E7.5 and E8.75 (amalgamation of anterior and posterior gut tube halves). Cells are colored by time-point. The graph was generated using an adjacency matrix derived from the standard kNN graph. Differences between consecutive time-points represent underlying developmental changes but are also confounded by technical batch effects, including discontinuity between E3.5 and E.4.5 and lack of spatial alignment between E6.5 and E7.5. b, E6.5 and E7.5 cells projected along their respective first two diffusion components. These projections reveal a dominant first component with strong spatial signal within individual time-points. Cells are colored by Phenograph clusters. c, The number of edges connecting cells between time-points are limited in the kNN graph (Top panel). Bottom panel: Plots showing the number of mutually nearest neighbors (MNNs) between E6.5 and E7.5 time-points. The MNNs are enriched along the boundary between time-points, supporting augmentation of the kNN graph with additional edges between mutually nearest neighbors (MNNs) between the consecutive time-points. d, The MNN distances can be converted to affinities on a similar scale as the kNN affinities, using linear regression to determine the relationship between the kath kNN and kath MNN distances. e, Example of the augmented MNN affinity matrix construction. Left panel: kNN affinities for a subset of E6.5 and E7.5 cells. Middle panel: MNN affinity matrix constructed using linear regression (d) to convert distances E6.5 and E7.5 cells to affinities. Right panel: Augmented affinity matrix: Sum of the kNN and MNN affinity matrices. f, Comparison of force directed layouts. Left: Standard kNN affinity matrix, Middle: Harmony’s augmented affinity matrix. Right: Plot generated using mnnCorrect for global batch effect correction leading to “over-correction” and loss in signal between time-points. g, Harmony framework starts with the augmented affinity matrix generated as described in supplemental methods. The augmented affinity matrix is used to generate the force directed graph for visualizing the data. The same augmented matrix is used to compute the diffusion operator for determining the diffusion components which, (a) forms the basis for Palantir trajectory detection, and (b) MAGIC imputation. h, Robustness of Harmony: Plots showing the correlation between diffusion components for different values of k, the number of nearest neighbours for kNN graph construction. VE cells in Fig.4 were used for testing robustness. i, Harmony applied to replicates: Plots showing the Pearson correlation between diffusion components without Harmony (x-axis) and with Harmony applied between the two replicates of the E8.75 gut tube. Plots shown for 3512 cells.
Extended Data Figure 4:
Extended Data Figure 4:. Lineage decisions in the mammalian blastocyst.
Results from pooling cells of two replicates of E3.5 and E4.5 followed by Harmony augmentation. a, Force directed layout of E3.5 and E4.5 cells depicting relationship between three blastocyst lineages. Cells colored by time-point or annotated cell types. b, Plot showing projection of E3.5 and E4.5 cells along first two diffusion components. Distances between lineages were computed using multi-scale distances. c, Table showing the connectivity between different compartments in a kNN graph of E3.5 cells. Each row represents the fraction of outgoing edges from cells of the respective compartment connecting to cells in the compartments specified in the columns. d, Force directed layout of E3.5 and E4.5, following removal of TE cells, showing relationships between ICM, EPI and PrE. Cells are colored by time-point or Phenograph clusters. e, Palantir, determined pseudo-time ordering, differentiation potential (DP) and branch probabilities (BP) of PrE and EPI cell lineages. f, Plots showing the second derivative of PrE and EPI differentiation potential along pseudo-time suggesting that changes in differentiation potential, and hence lineage commitment in both lineages occur at E3.5. Points of highest changes along pseudo-time represent inferred lineage specification and commitment. g, Distribution of E3.5 lineage cells along pseudo-time, each distribution represents cells from one Phenograph cluster. h, Histograms showing the distribution of differentiation potential (left), PrE fate probability (middle) and EPI fate probability (right) in the E3.5 ICM clusters. i, Gene expression patterns of parietal (ParE) and visceral endoderm (VE) markers. Each cell is colored based on its MAGIC, imputed expression level for the indicated gene. Black and orange arrowheads mark presumptive ParE and VE lineages, respectively.
Extended Data Figure 5:
Extended Data Figure 5:. Gene expression trends in EPI, PrE, VE and ParE lineages in the blastocyst.
a, Plots comparing gene expression trends along pseudo-time for genes encoding components of the FGF signaling pathway (Fgf4, Fgf5, Fgf8, Fgfr1, Fgfr2, Spry4), the endoderm marker transcription factors Gata6, Gata4, Sox7 and Sox17 and Nanog during EPI and PrE lineage specification. Solid line represents the mean expression trend and shaded regions represents 1 s.d. b, Dynamics of TF ratios as lineages emerge: Gata6/Nanog and Gata6/Fgf4 along EPI; Nanog/Gata6 and Fgf4/Gata6 along PrE, compared to changes in differential potential (dotted line). TF ratios were computed for each cell by using the MAGIC imputed data for each gene. c, Plots comparing gene expression trends along pseudo-time: Gata and Sox transcription factors, Fgf-receptors or -ligands during PrE or EPI specification. Colors at the bottom of each panel represent time-point, and where applicable, E3.5 and E4.5 Phenograph clusters. Dashed lines represent BP in commitment towards respective lineages. d, Gene expression patterns of FGF signaling pathway components, Gata and Sox transcription factor genes. Orange, black and green arrowheads point to high expression in ParE, VE and EPI, respectively. e, Laser scanning confocal data depicting TCF7L1 expression at E3.5 (top panel) (n = 14) and E4.5 (bottom panel) (n = 11). SOX2 and GATA6 were used as EPI and PrE lineage markers, respectively. f, Gene expression patterns of Tcf7l1 and Nanog depicting similar expression of Tcf7l1 in EPI as Fgf4 (green arrowhead).
Extended Data Figure 6:
Extended Data Figure 6:. Force directed layouts of single E5.5 cells reveal relationships between EPI, VE and extra-embryonic ectoderm (ExE) lineages.
a, Force directed layouts of E5.5 data generated after pooling replicates, showing the relationship between EPI, VE and extra-embryonic ectoderm (ExE) lineages. Cells are colored by cell type. Black arrowheads mark cells that transdifferentiate from EPI to VE. b, Plot showing the projection of EPI, VE and ExE cells along the first two diffusion components. Distances between lineages were computed using multi-scale distances. c, Plots showing the shortest path step sizes for paths from EPI boundary cell to VE (top) and EPI to ExE (bottom) boundary cells. d, Left panel: Plots highlighting extremes of the diffusion components, serving as the boundaries of the phenotypic space for each lineage identity. Right panel: Plots showing the shortest path step sizes for paths from EPI-to-VE (top) and EPI-to-ExE (bottom). e, Gene expression plots of AVE (Cer1, Dkk1), VE (Eomes, Foxa1, Ttr), VE and EPI (Nodal) and EPI (Sox2) markers along EPI and PrE/VE lineages from E3.5-E5.5. Cells colored based on marker expression of indicated gene after MAGIC. f, Laser scanning confocal images of E5.5 and E6.0 Sox2-CreTG/+;ROSA26mT/mG (d) and Ttr-CreTG/+;ROSA26mT/mG (e) embryos immunostained for GFP, RFP (red fluorescent protein, membrane-localized tdTomato) and Gata6, a marker of endoderm identity, and VE at this stage. Cell nuclei stained with Hoechst and membranes labeled with RFP. Yellow arrowheads point cells of epiblast (EPI) origin present within the visceral endoderm (VE) epithelial layer. (n = 10/20 GFP-positive cells in VE of Sox2-CreTG/+;ROSA26mT/mG embryos, n = 0/27 GFP-positive cells in the EPI of Ttr-CreTG/+;ROSA26mT/mG embryos). Results validated in at least three independent experiments. ExE, extra-embryonic ectoderm. Scale bars: 50μm in low magnification images, 20μm in high magnification images. g, Laser confocal images of an E5.5 wild-type 4n <-> H2B-tdTomato embryonic stem cell (ESC) embryo chimera. An EPI cell is intercalating into the visceral endoderm layer (VE) (yellow arrowheads). Top two rows: Low and high magnification (3D images, maximum intensity projections) of an E5.5 wild-type 4n <-> H2B-tdTomato ESC embryo chimera (n = 9/19 showed Tomato-positive cells in the VE). Bottom rows: Low and high magnification views (2D images) of two E5.5 wild-type 4n <-> H2B-tdTomato ESC embryo chimeras. Embryo is counterstained with Hoechst to label nuclei, and Phalloidin to label F-Actin. Scale bars: 20μm in low magnification images, 10μm in high magnification images. A, anterior; D, distal; P, posterior; Pr, proximal.
Extended Data Figure 7:
Extended Data Figure 7:. Emergence of spatial patterning of the embryo at E5.5.
a, Plot showing Palantir pseudo-time versus differentiation potential of VE cells from stages E3.5-E8.75. Drops in differential potential occur at two time points. The first at E5.5, as cells acquire a distal versus proximal fate and the second at E7.5 as cells acquire an anterior versus posterior fate. b, Plots of branch probabilities of commitment towards yolk sac endoderm (YsE), anterior and posterior gut endoderm. c, Marker based (i) and bulk RNA-seq based (ii) prediction of exVE and emVE at E7.5. (iii) Plots showing the Pearson correlation between bulk RNA-seq replicates of exVE and emVE. d, (i-ii) Plots showing differentially expressed genes between of exVE (291 genes) and emVE (2239 genes) derived using bulk RNA-seq data. e, Plots showing the branch probabilities of E7.5, E6.5 and E5.5 exVE and emVE cells to commit towards YsE (extra-embryonic) and gut tube (embryonic). Cells labeled as exVE and emVE based on expression of known markers (plot on the left), match expected Palantir branch probabilities (4 plots on the right). Branch probabilities of E5.5 cells in committing towards YsE and gut tube were used to infer putative exVE and emVE identities at E5.5. f, Plot showing pseudo-time versus differentiation potential of endoderm cells at E5.5 colored by the inferred cell type. (A zoomed in view of Extended Data Fig 7a). g, Heatmaps of highly expressed genes specifically in exVE or emVE at E5.5 also distinguish exVE and emVE cells at E6.5 and E7.5. h, ISH of E6.25 embryos showing expression of Lhx1 (n = 3) and Lefty1 (n = 3), genes specific for emVE, and Apln (n = 3) and Msx1 (n = 3) specific for exVE. Scale bars: 50μm. A, anterior; D, distal; P, posterior; Pr, proximal.
Extended Data Figure 8:
Extended Data Figure 8:. Characterization of E8.75 gut tube anterior-posterior pseudo-space.
a, Force-directed layout as in Fig 5. (i): Plots showing the probabilities of anterior-posterior positioning for the Afp-GFP-positive/Afp-GFP-negative cells inferred using the manifold classifier trained on anterior-posterior cell. (ii): Plots showing the probabilities of GFP-positive/GFP-negative status for the cells from the anterior-posterior compartment inferred using the manifold classifier trained on GFP-positive/GFP-negative cells. b, (i): Anterior and posterior cells labeled by measured data (left). Anterior and posterior positions of Afp-GFP-positive/AFP-GFP-negative cells inferred data (right) using probabilities in (a-i). (ii): GFP-positive/GFP-negative cells labeled by measured data (left). GFP-positive/GFP-negative status of the anterior-posterior compartment cells inferred using probabilities in (a-ii). c, (i): Plot showing the first diffusion component of the E8.75 cells. (ii-iii): Plots showing the expression of anterior marker Nkx2.1 and posterior marker Hoxb9 in E8.75 cells. (iv-v): Bulk RNA-seq expression of Nkx2–1 and Hoxb9 in quadrants of the gut tube along the AP axis compares with A-P single cell expression patterns. d, Plot showing the proportion of anterior and posterior cells in bins along the AP pseudo-space axis. e, Receiver operating curve for classification of E7.5 VE and DE cells (4378 cells). f, Plots showing the expression patterns of genes that are best predictive of the DE class in the VE-DE classifier (top - DE; bottom -VE). g, Plots showing the expression patterns of genes in the DE best predictive of VE class in the VE-DE classifier. h, Force directed layouts following Harmony of E7.5 and E8.75 VE and DE cells with E7.5 cells highlighted in red (DE) and blue (VE) (left). E7.5 VE and DE cells colored by the branch probability of anterior localization (middle) and posterior localization (right). Black arrowheads indicate early emergence of AP spatial patterning at E7.5, with E7.5 DE cells predominantly destined towards anterior, and VE cells predominantly destined towards posterior. i, 3D renderings of gut tube depicting all endoderm cells along AP axis. Nuclei of VE and DE cells are labeled in green and grey, respectively. j, Plots comparing the ranks of proportion of GFP-positive cells along AP positioning in the Afp-GFP embryo-derived Neurolucida gut tube replicates (x-axis), and the ranks of VE cell proportions in bins along the AP pseudo-space axis (y-axis), the AP axis was partitioned into 20 bins, each dot representing the fraction of VE cells in that bin. k, Heatmap showing Pearson correlations between AP pseudo-space orderings determined using a varying number of diffusion components highlighting the robustness of the ordering. l, Plots comparing the AP pseudo-space ordering of GFP-positive/GFP-negative cells (replicate 2: 13335 cells) generated de novo using only the replicate 2 cells (x-axis, left) with the projected ordering from replicate 1 (8143 cells) (y-axis). Right panel shows a similar comparison with the pseudo-space ordering determined using cells of both the replicates on the x-axis. m, Same as l, for replicates of anterior-posterior cells (Replicate 1: 1821 cells, replicate 2: 1691 cells). Plots show the Pearson correlation.
Extended Data Figure 9:
Extended Data Figure 9:. Spatial patterning of the gut tube at E8.75.
a, Plots showing individual Phenograph clusters densities of the E8.75 gut tube cells ordered along AP pseudo-space (left panel) and in force directed layouts (middle panel). In situ hybridization of representative differentially expressed genes in each cluster on whole E8.75 embryos (n > 3 for each gene) or micro-dissected E8.75 gut tubes (n > 3 for each gene) (right panels). Arrowheads point to expression of representative gene for each particular cluster. All scale bars: 200μm, except for Nkx2–1: 100μm. A, anterior; fg, foregut; hg, hindgut; L, left; mg, midgut; no, notochord; R, right; P, posterior. b, Density of E8.75 cells along the AP pseudo-space axis. c, Comparison of empirical AP pseudo-space axis and the predicted AP pseudo-space using expression of TFs. Each dot represents the AP pseudo-space computed by all genes, verses only by the selected TFs. d, Plot showing the ranking of different TFs according to their predictive power based on the regression model. e, Heatmap showing the coefficients for the top TFs when different proportions for cells are subsampled for the regression (total cells: 24990). f, Heatmap showing the Pearson correlation of TF coefficients in (e), highlighting the robustness of TF coefficients in regression.
Extended Data Figure 10:
Extended Data Figure 10:. Hox gene expression within the E8.75 gut tube.
a, Force directed plots of Hox genes expressed in gut endoderm cells at E8.75. b, Whole-mount mRNA in situ hybridizations on whole E8.75 embryos (n > 3 for each gene) and micro-dissected gut tubes (n > 3 for each gene) of Hox genes depicting their distribution along the AP axis. All scale bars: 200μm, except for Hoxc10, Hoxd11: 100μm. A, anterior; fg, foregut; hg, hindgut; L, left; mg, midgut; R, right; P, posterior.
Extended Data Figure 11:
Extended Data Figure 11:. Signaling map of the gut tube of the E8.75 mouse embryo.
Force directed layouts of context-independent targets of key signaling pathways acting within the endoderm lineage of the embryo. FGF/Fibroblast Growth Factor; WNT; BMP/Bone Morphogenic Protein; NOTCH; HH/Hedgehog; Nodal/TGF-beta signaling; JASK/STAT; RA/ Retinoic Acid; HIPPO.
Figure 1:
Figure 1:. Single-cell map of the mouse endoderm, from blastocyst to midgestation.
a, Schematic experimental, highlighting single-cell libraries collected across sequential stages. b, tSNE plot of all samples, each dot representing a single-cell, color-coded by cell type.
Figure 2:
Figure 2:. Differentiation of epiblast into endoderm before gastrulation.
Results from Harmony applied to all replicates of E3.5-E5.5. a, Force directed layouts depicting relationship between EPI and PrE/VE lineages. Cells colored by time-point (left) and cell type labels (right). b, Palantir pseudo-time, differentiation potential (DP) and branch probabilities (BP) of EPI and PrE/VE cell lineages. Black arrowhead and dotted arrows denote EPI cells with high DP, representing a trans-differentiation to endoderm. c, Gene expression of AVE (Hhex, Lefty1), VE (Foxa2, Afp), VE and EPI (Otx2, Sox2) markers. Cells colored based on post-MAGIC gene expression. d–e, 3D surface renderings of mGFP-expressing cells in E6.0 Sox2-CreTG/+;ROSA26mT/mG (d) and Ttr-CreTG/+;ROSA26mT/mG embryos (e). Nuclei stained with Hoechst, membranes labeled with RFP. Results validated in >3 independent experiments. ExE, extra-embryonic ectoderm. Scale bars: 10μm A, anterior; D, distal; P, posterior; Pr, proximal.
Figure 3:
Figure 3:. Spatial pattern emerges within visceral endoderm at onset of post-implantation development (E5.5).
Results from Harmony applied to replicates of E3.5-E8.75 (excluding ParE). a, Force directed layout of endoderm cells from blastocyst-to-midgestation. b, Palantir pseudo-time, DP and BP of endoderm cells using a Nanoghi start cell. c, Heatmap of genes expressed (Extended Fig. 9h) in exVE or emVE at E5.5. Cells sorted within each compartment by pseudo-time ordering.
Figure 4:
Figure 4:. Anterior-Posterior pseudo-spatial axis of cells residing within the E8.75 gut tube.
Force directed layout of E8.75 VE/DE cells combining anterior/posterior cells with Afp-GFP-positive/AFP-GFP-negative cells using mNNCorrect (panels a-c, e). a, Cells colored based on measured or inferred AP position. b, Inferred anterior-posterior (AP) pseudo-space (left) and proportion of VE/DE cells in bins along AP pseudo-space (right). Purple dots represent correlation of aggregate expression VE/DE cells in corresponding bins. c, Expression of key organ markers in DE (top) and VE cells (bottom). d, Receiver operating curve for classification of E8.75 VE/DE cells using model trained on E7.5 cells. e, Expression of classifier genes best predictive VE. f, 3D rendering of gut tube depicting all endoderm cells along AP axis. Nuclei of VE/DE cells labeled in green/grey, respectively.
Figure 5:
Figure 5:. Spatial patterning and organ identities within the E8.75 gut tube of the mouse embryo.
a, Force directed graph of E8.75 cells colored by Phenograph clusters, annotated with putative endodermal organ associated with each cluster. b, Density of cells, per Phenograph cluster along AP pseudo-space. c, Percentage VE cells per cluster, ordered by average distance from anterior tip of AP pseudo-space. d, Heatmap of Hox gene expression along AP pseudo-space (left). Validation of Hox gene expression by ISH on E8.75 gut tubes (n >3 for each gene) (right). e, Heatmap of TF expression most predictive of AP pseudo-space in a regression model. Columns represent cells ordered by pseudo-space, each row representing expression of a particular TF. TFs ordered by expression along AP pseudo-space. Validation of predictive AP expression by ISH on E8.75 gut tubes (n >3 for each gene) (right). Scale bars: 200μm, except for Nkx2–1, Irx3: 100μm. A, anterior; cm, cardiac mesoderm; fg, foregut; hg, hindgut; L, left; mg, midgut; R, right; P, posterior. Scale bars: 200μm, except for Hoxc10: 100μm.

References

    1. Zorn AM & Wells JM Vertebrate endoderm development and organ formation. Annu Rev Cell Dev Biol 25, 221–251, doi:10.1146/annurev.cellbio.042308.113344 (2009). - DOI - PMC - PubMed
    1. Tremblay KD Formation of the murine endoderm: lessons from the mouse, frog, fish, and chick. Prog Mol Biol Transl Sci 96, 1–34, doi:10.1016/B978-0-12-381280-3.00001-4 (2010). - DOI - PubMed
    1. Chazaud C & Yamanaka Y Lineage specification in the mouse preimplantation embryo. Development 143, 1063–1074, doi:10.1242/dev.128314 (2016). - DOI - PubMed
    1. Nowotschin S & Hadjantonakis AK Cellular dynamics in the early mouse embryo: from axis formation to gastrulation. Curr Opin Genet Dev 20, 420–427, doi:10.1016/j.gde.2010.05.008 (2010). - DOI - PMC - PubMed
    1. Viotti M, Nowotschin S & Hadjantonakis AK SOX17 links gut endoderm morphogenesis and germ layer segregation. Nat Cell Biol 16, 1146–1156, doi:10.1038/ncb3070 (2014). - DOI - PMC - PubMed

Publication types