

Clog and Release, and Reverse Motions of DNA in a Nanopore
- PMID: 30960068
- PMCID: PMC6401990
- DOI: 10.3390/polym11010084
Clog and Release, and Reverse Motions of DNA in a Nanopore
Abstract
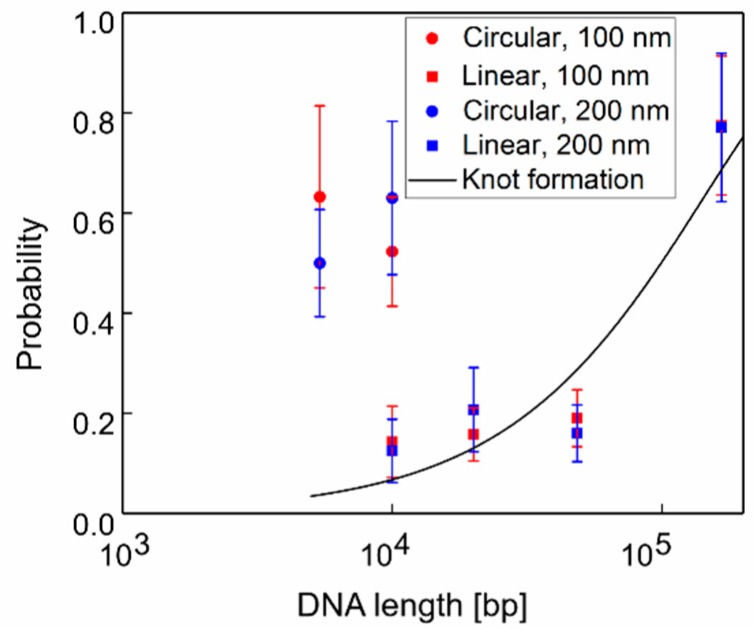
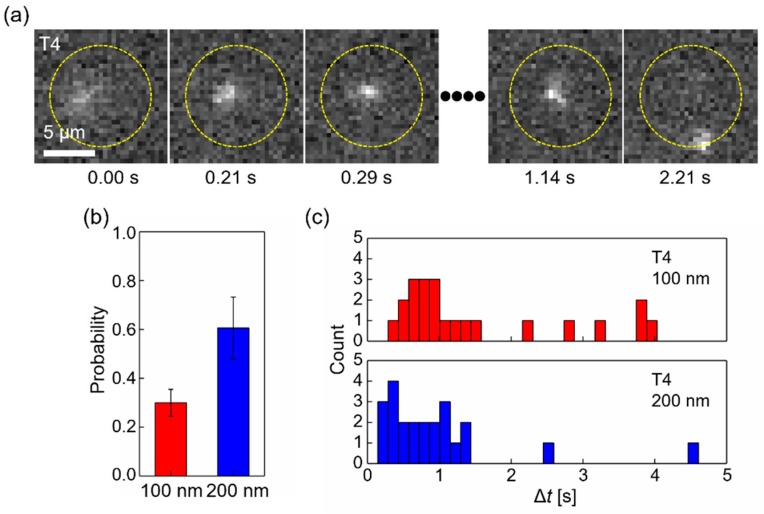
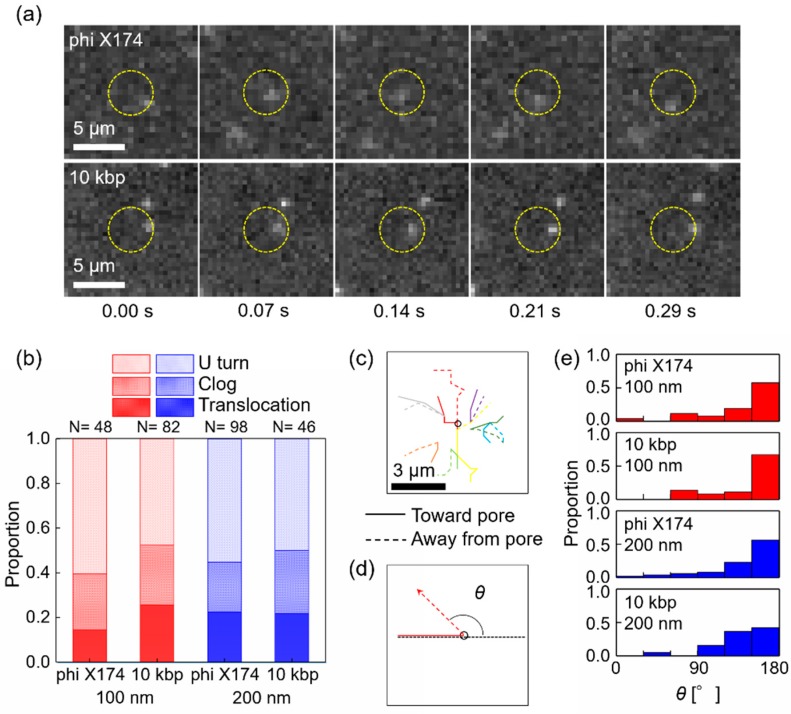
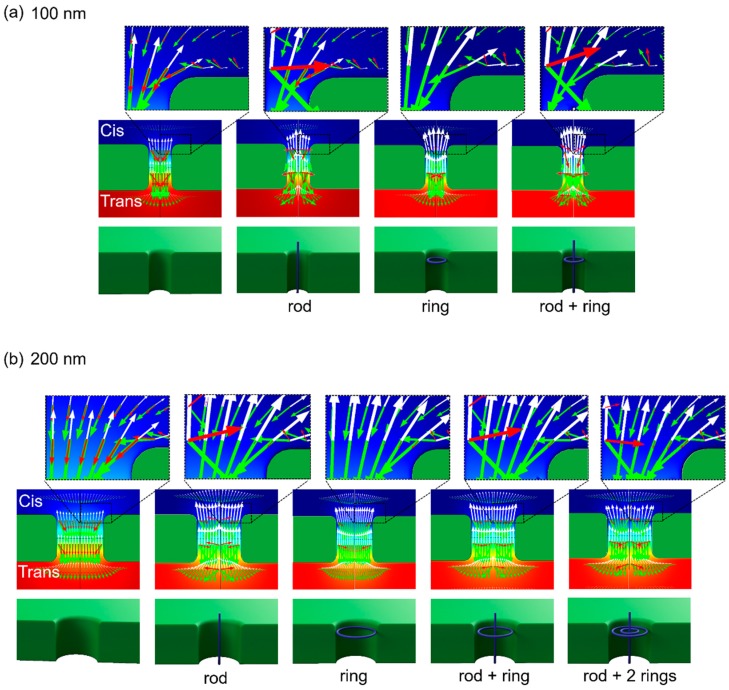
Motions of circular and linear DNA molecules of various lengths near a nanopore of 100 or 200 nm diameter were experimentally observed and investigated by fluorescence microscopy. The movement of DNA molecules through nanopores, known as translocation, is mainly driven by electric fields near and inside the pores. We found significant clogging of nanopores by DNA molecules, particularly by circular DNA and linear T4 DNA (165.65 kbp). Here, the probabilities of DNA clogging events, depending on the DNA length and shape-linear or circular-were determined. Furthermore, two distinct DNA motions were observed: clog and release by linear T4 DNA, and a reverse direction motion at the pore entrance by circular DNA, after which both molecules moved away from the pore. Finite element method-based numerical simulations were performed. The results indicated that DNA molecules with pores 100⁻200 nm in diameter were strongly influenced by opposing hydrodynamic streaming flow, which was further enhanced by bulky DNA configurations.
Keywords: DNA; electro-osmosis; nanopore; translocation.
Conflict of interest statement
The authors declare no conflict of interest.
Figures
Similar articles
-
Dynamics of DNA Clogging in Hafnium Oxide Nanopores.J Phys Chem B. 2020 Dec 24;124(51):11573-11583. doi: 10.1021/acs.jpcb.0c07756. Epub 2020 Dec 14. J Phys Chem B. 2020. PMID: 33315405 Free PMC article.
-
DNA motion induced by electrokinetic flow near an Au coated nanopore surface as voltage controlled gate.Nanotechnology. 2015 Feb 13;26(6):065502. doi: 10.1088/0957-4484/26/6/065502. Epub 2015 Jan 22. Nanotechnology. 2015. PMID: 25611963 Free PMC article.
-
Direct visualization of single-molecule translocations through synthetic nanopores comparable in size to a molecule.ACS Nano. 2013 May 28;7(5):4057-69. doi: 10.1021/nn400182s. Epub 2013 May 1. ACS Nano. 2013. PMID: 23607372
-
Directly observing the motion of DNA molecules near solid-state nanopores.ACS Nano. 2012 Nov 27;6(11):10090-7. doi: 10.1021/nn303816w. Epub 2012 Oct 12. ACS Nano. 2012. PMID: 23046052 Free PMC article.
-
Polarization Induced Electro-Functionalization of Pore Walls: A Contactless Technology.Biosensors (Basel). 2019 Oct 11;9(4):121. doi: 10.3390/bios9040121. Biosensors (Basel). 2019. PMID: 31614545 Free PMC article. Review.
Cited by
-
On-Chip Stretching, Sorting, and Electro-Optical Nanopore Sensing of Ultralong Human Genomic DNA.ACS Nano. 2019 Dec 24;13(12):14388-14398. doi: 10.1021/acsnano.9b07873. Epub 2019 Nov 26. ACS Nano. 2019. PMID: 31756076 Free PMC article.
-
Sensing with Nanopores and Aptamers: A Way Forward.Sensors (Basel). 2020 Aug 11;20(16):4495. doi: 10.3390/s20164495. Sensors (Basel). 2020. PMID: 32796729 Free PMC article. Review.
-
Role of DNA-DNA sliding friction and nonequilibrium dynamics in viral genome ejection and packaging.Nucleic Acids Res. 2023 Aug 25;51(15):8060-8069. doi: 10.1093/nar/gkad582. Nucleic Acids Res. 2023. PMID: 37449417 Free PMC article.
-
Dynamics of DNA Clogging in Hafnium Oxide Nanopores.J Phys Chem B. 2020 Dec 24;124(51):11573-11583. doi: 10.1021/acs.jpcb.0c07756. Epub 2020 Dec 14. J Phys Chem B. 2020. PMID: 33315405 Free PMC article.
-
Simulation Study of Chain-like Body Translocation through Conical Pores in Thick Membranes.Membranes (Basel). 2022 Jan 24;12(2):138. doi: 10.3390/membranes12020138. Membranes (Basel). 2022. PMID: 35207060 Free PMC article.
References
LinkOut - more resources
Full Text Sources
