Insights into Bacterial Cellulose Biosynthesis from Different Carbon Sources and the Associated Biochemical Transformation Pathways in Komagataeibacter sp. W1
- PMID: 30960888
- PMCID: PMC6403882
- DOI: 10.3390/polym10090963
Insights into Bacterial Cellulose Biosynthesis from Different Carbon Sources and the Associated Biochemical Transformation Pathways in Komagataeibacter sp. W1
Abstract
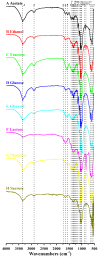
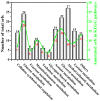
Cellulose is the most abundant and widely used biopolymer on earth and can be produced by both plants and micro-organisms. Among bacterial cellulose (BC)-producing bacteria, the strains in genus Komagataeibacter have attracted wide attention due to their particular ability in furthering BC production. Our previous study reported a new strain of genus Komagataeibacter from a vinegar factory. To evaluate its capacity for BC production from different carbon sources, the present study subjected the strain to media spiked with 2% acetate, ethanol, fructose, glucose, lactose, mannitol or sucrose. Then the BC productivity, BC characteristics and biochemical transformation pathways of various carbon sources were fully investigated. After 14 days of incubation, strain W1 produced 0.040⁻1.529 g L-1 BC, the highest yield being observed in fructose. Unlike BC yields, the morphology and microfibrils of BCs from different carbon sources were similar, with an average diameter of 35⁻50 nm. X-ray diffraction analysis showed that all membranes produced from various carbon sources had 1⁻3 typical diffraction peaks, and the highest crystallinity (i.e., 90%) was found for BC produced from mannitol. Similarly, several typical spectra bands obtained by Fourier transform infrared spectroscopy were similar for the BCs produced from different carbon sources, as was the Iα fraction. The genome annotation and Kyoto Encyclopedia of Genes and Genomes analysis revealed that the biochemical transformation pathways associated with the utilization of and BC production from fructose, glucose, glycerol, and mannitol were found in strain W1, but this was not the case for other carbon sources. Our data provides suggestions for further investigations of strain W1 to produce BC by using low molecular weight sugars and gives clues to understand how this strain produces BC based on metabolic pathway analysis.
Keywords: Komagataeibacter; bacterial cellulose; carbon sources; genome sequencing; metabolic pathway.
Conflict of interest statement
The authors declare no conflict of interest.
Figures


References
-
- Velásquez-Riaño M., Bojacá V. Production of bacterial cellulose from alternative low-cost substrates. Cellulose. 2017;24:2677–2698. doi: 10.1007/s10570-017-1309-7. - DOI
-
- Molina-Ramírez C., Castro M., Osorio M., Torres-Taborda M., Gómez B., Zuluaga R., Gómez C., Gañán P., Rojas O.J., Castro C. Effect of different carbon sources on bacterial nanocellulose production and structure using the low pH resistant strain Komagataeibacter medellinensis. Materials. 2017;10:639. doi: 10.3390/ma10060639. - DOI - PMC - PubMed
-
- Wang S.-S., Han Y.-H., Ye Y.-X., Shi X.-X., Xiang P., Chen D.-L., Li M. Physicochemical characterization of high-quality bacterial cellulose produced by Komagataeibacter sp. strain W1 and identification of the associated genes in bacterial cellulose production. RSC Adv. 2017;7:45145–45155. doi: 10.1039/C7RA08391B. - DOI
-
- Gallegos A.M.A., Carrera S.H., Parra R., Keshavarz T., Iqbal H.M.N. Bacterial cellulose: A sustainable source to develop value-added products—A review. BioResources. 2016;11:5641–5655. doi: 10.15376/biores.11.2.Gallegos. - DOI
Grants and funding
- 2017Y0027/The Science and Technology Program of Fujian Province
- JAT170144/The Education Department Fund of Fujian Province
- 2014H2003/The Key Technology Research and Development Platform of Synthetic Resin Functionalization of Fujian Province
- 2016G003/The Key Research and Development Platform of Advanced Polymer Materials
LinkOut - more resources
Full Text Sources
Molecular Biology Databases

