. 2019 May;20(3-4):264-274.
doi: 10.1080/21678421.2019.1587629. Epub 2019 Apr 9.

Predicting the future of ALS: the impact of demographic change and potential new treatments on the prevalence of ALS in the United Kingdom, 2020-2116

Affiliations

Predicting the future of ALS: the impact of demographic change and potential new treatments on the prevalence of ALS in the United Kingdom, 2020-2116

Alison Gowland et al. Amyotroph Lateral Scler Frontotemporal Degener. 2019 May.

Abstract

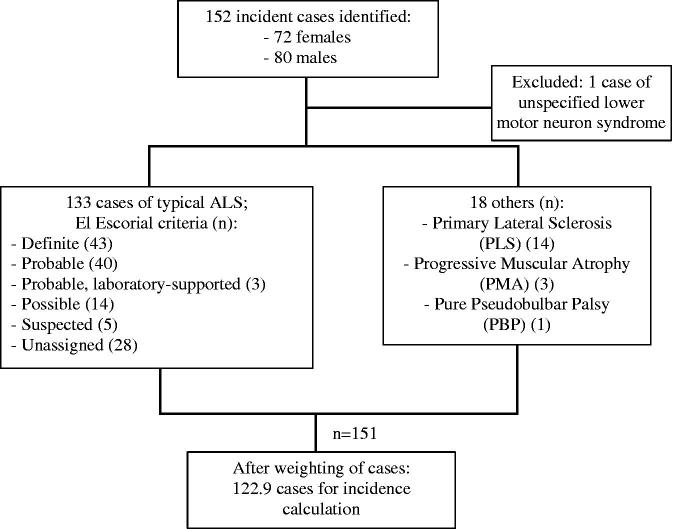
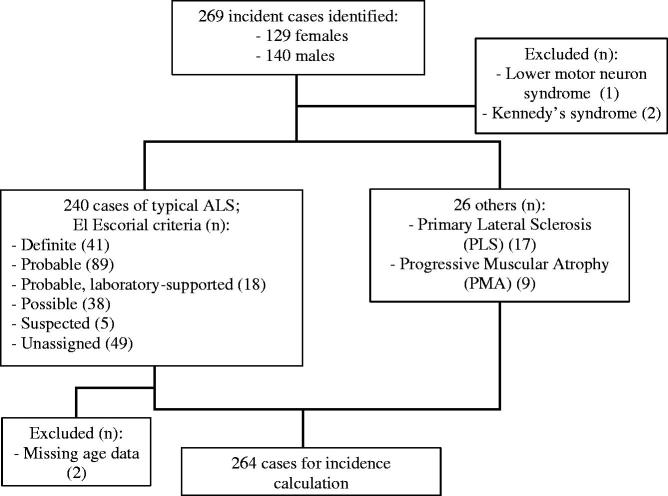
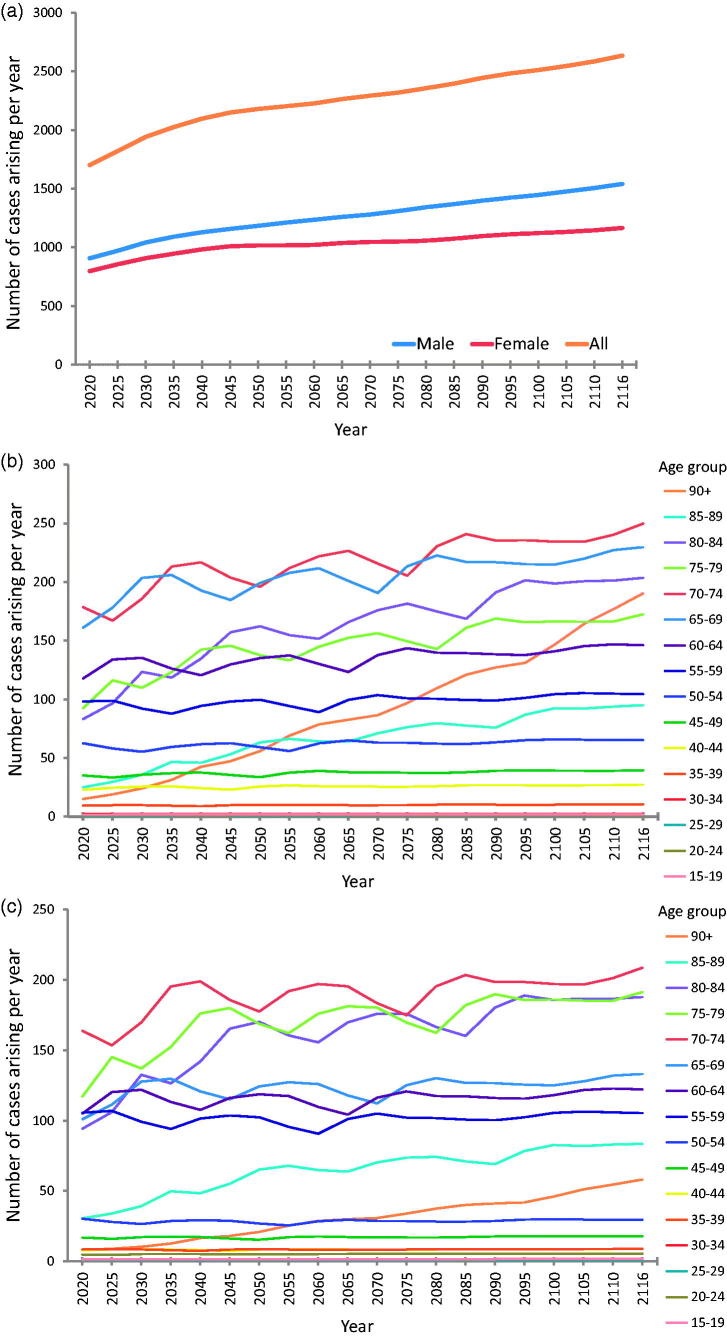
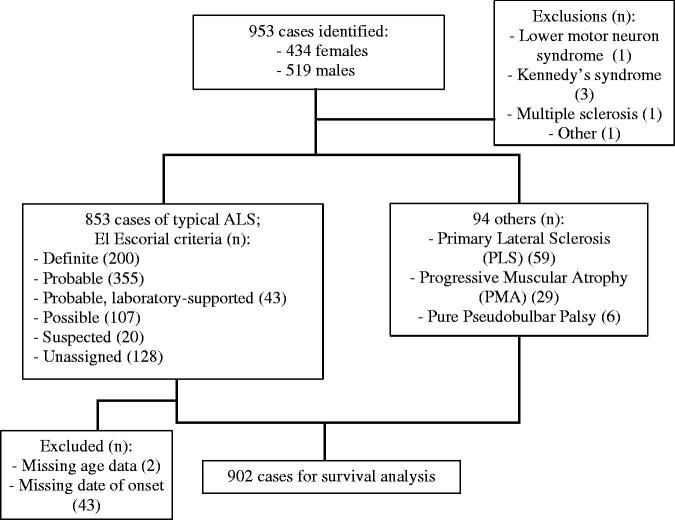
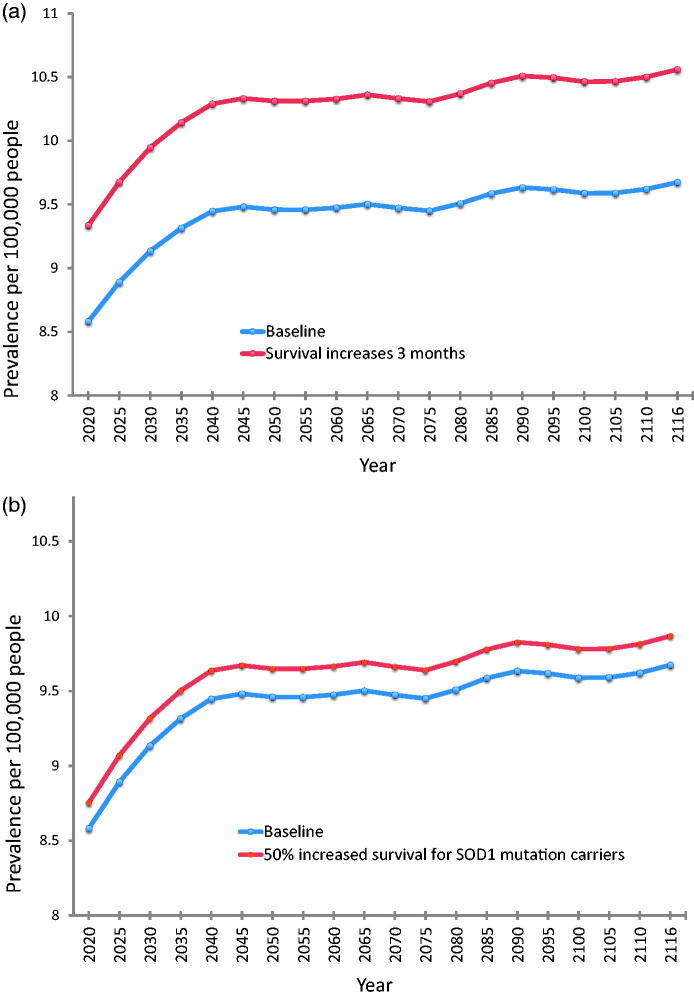
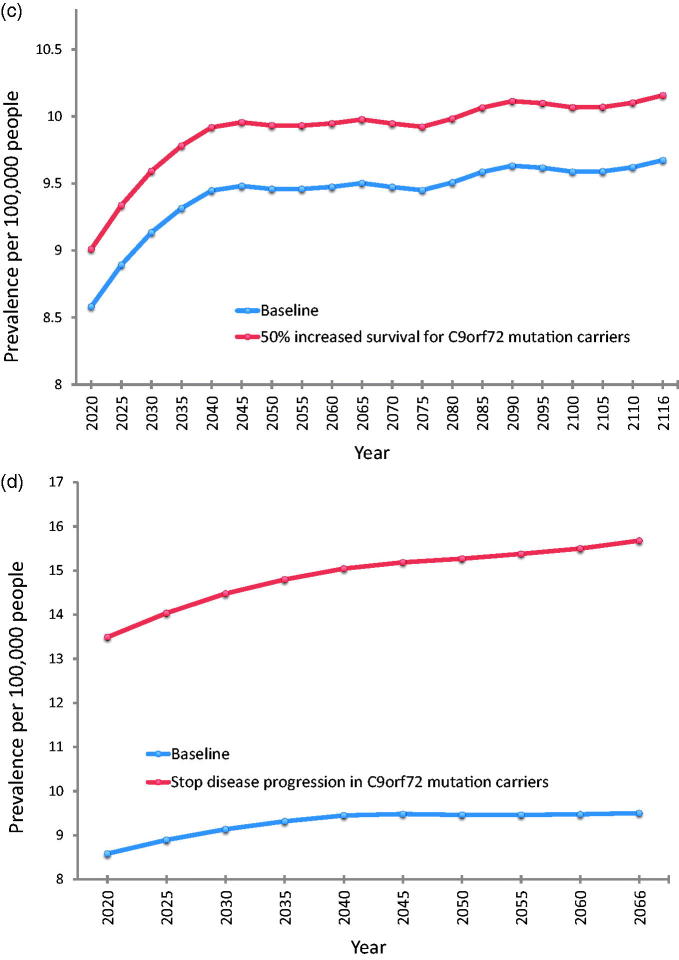
Objective: To model the effects of demographic change under various scenarios of possible future treatment developments in ALS. Methods: Patients diagnosed with ALS at the King's College Hospital Motor Nerve Clinic between 2004 and 2017, and living within the London boroughs of Lambeth, Southwark, and Lewisham (LSL), were included as incident cases. We also ascertained incident cases from the Canterbury region over the same period. Future incidence of ALS was estimated by applying the calculated age- and sex-specific incidence rates to the UK population projections from 2020 to 2116. The number of prevalent cases for each future year was estimated based on an established method. Assuming constant incidence, we modelled four possible future prevalence scenarios by altering the median disease duration for varying subsets of the population, to represent the impact of new treatments. Results: The total number of people newly diagnosed with ALS per year in the UK is projected to rise from a baseline of 1415 UK cases in 2010 to 1701 in 2020 and 2635 in 2116. Overall prevalence of ALS was predicted to increase from 8.58 per 100,000 persons in 2020 to 9.67 per 100,000 persons in 2116. Halting disease progression in patients with C9orf72 mutations would yield the greatest impact of the modelled treatment scenarios, increasing prevalence in the year 2066 from a baseline of 9.50 per 100,000 persons to 15.68 per 100,000 persons. Conclusions: Future developments in treatment would combine with the effects of demographic change to result in more people living longer with ALS.

Keywords: Epidemiology; genetics; models; survival; therapy.


Figures

Figure 1
Figure 1
Flowchart of incidence sample characteristics: Lambeth, Southwark, and Lewisham (LSL) data.
Figure 2
Figure 2
Flowchart of incidence sample characteristics: Canterbury data.
Figure 3
Figure 3
Predicted number of new cases of ALS arising in UK per year, by sex and by age group for each sex, 2020–2116. This is the illustration of future incidence projections. (a) Number of new UK cases arising per future year, by sex. Male incidence remains higher than female incidence, with a slight increase in the number of male cases arising in later years due to projected improvements in male life expectancy. (b) Number of new UK male cases arising per future year, by age cohort. Note the particularly steep rise in annual incidence rate for males in the 90+ age cohort; this is attributable to projected improvements in life expectancy for males resulting in increasingly large numbers of males reaching this age cohort, combined with a relatively high age-specific incidence rate in our sample (7.56 male cases per 100,000 persons compared to 1.99 female cases per 100,000 persons in this age cohort). (c) Number of new UK female cases arising per future year, by age cohort. This suggests an increase in the number of cases arising per year in future, particularly among the older age cohorts.
Figure 4
Figure 4
Flowchart of survival analysis sample characteristics.
Figure 5
Figure 5
Future prevalence estimates for each modelled scenario compared to baseline. (a) Baseline compared to a treatment that prolongs survival in all cases by three months. (b) Baseline compared to a treatment that prolongs median survival by 50% in the subgroup of patients with SOD1 mutation. (c) Baseline compared to a treatment that prolongs median survival by 50% in the subgroup of patients with C9orf72 mutation. (d) Baseline compared to a treatment that halts disease progression in the subgroup of patients with C9orf72 mutation, so that the life expectancy of these patients reverts to that predicted for their age, sex, and year cohort. This scenario generates the most significant difference in disease prevalence compared to baseline. Note that the range of the x-axis is different for (d) (2020–2066) compared to (a–c) (2020–2116) due to more limited availability of projected life expectancy data. Note that for all parts of Figure 5, the y-axis lower limit is eight (prevalent cases per 100,000 persons), not 0, for better illustration of the range of prevalence estimates.
Figure 5
Figure 5
Future prevalence estimates for each modelled scenario compared to baseline. (a) Baseline compared to a treatment that prolongs survival in all cases by three months. (b) Baseline compared to a treatment that prolongs median survival by 50% in the subgroup of patients with SOD1 mutation. (c) Baseline compared to a treatment that prolongs median survival by 50% in the subgroup of patients with C9orf72 mutation. (d) Baseline compared to a treatment that halts disease progression in the subgroup of patients with C9orf72 mutation, so that the life expectancy of these patients reverts to that predicted for their age, sex, and year cohort. This scenario generates the most significant difference in disease prevalence compared to baseline. Note that the range of the x-axis is different for (d) (2020–2066) compared to (a–c) (2020–2116) due to more limited availability of projected life expectancy data. Note that for all parts of Figure 5, the y-axis lower limit is eight (prevalent cases per 100,000 persons), not 0, for better illustration of the range of prevalence estimates.

References

    1. Logroscino G, Traynor BJ, Hardiman O, Chio A, Mitchell D, Swingler RJ, et al. . Incidence of amyotrophic lateral sclerosis in Europe. J Neurol Neurosurg Psychiatry. 2010;81:385–90. - PMC - PubMed
    1. McGuire V, Longstreth WT Jr., Koepsell TD, van Belle G. Incidence of amyotrophic lateral sclerosis in three counties in western Washington state. Neurology. 1996;47:571–3. - PubMed
    1. Mulder DW, Kurland LT. Motor neuron disease: epidemiologic studies. Adv Exp Med Biol. 1987;209:325–32. - PubMed
    1. Johnston CA, Stanton BR, Turner MR, Gray R, Blunt AH, Butt D, et al. . Amyotrophic lateral sclerosis in an urban setting: a population based study of inner city London. J Neurol. 2006;253:1642–3. - PubMed
    1. United Nations, Department of Economic and Social Affairs, Population Division. 2013. World Population Ageing 2013. ST/ESA/SER.A/348.http://www.un.org/en/development/desa/population/publications/pdf/ageing/WorldP...

Publication types