

3DMMS: robust 3D Membrane Morphological Segmentation of C. elegans embryo
- PMID: 30961566
- PMCID: PMC6454620
- DOI: 10.1186/s12859-019-2720-x
3DMMS: robust 3D Membrane Morphological Segmentation of C. elegans embryo
Abstract
Background: Understanding the cellular architecture is a fundamental problem in various biological studies. C. elegans is widely used as a model organism in these studies because of its unique fate determinations. In recent years, researchers have worked extensively on C. elegans to excavate the regulations of genes and proteins on cell mobility and communication. Although various algorithms have been proposed to analyze nucleus, cell shape features are not yet well recorded. This paper proposes a method to systematically analyze three-dimensional morphological cellular features.
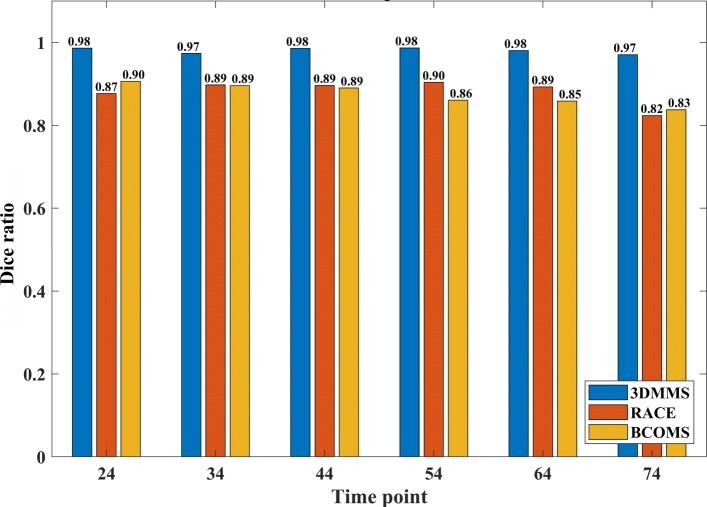
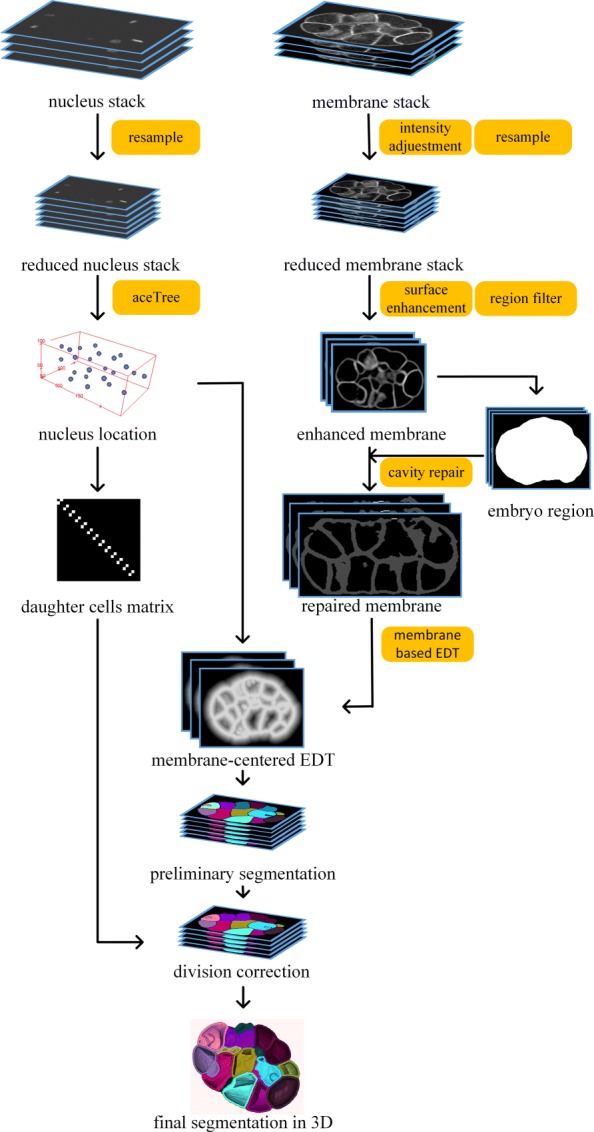
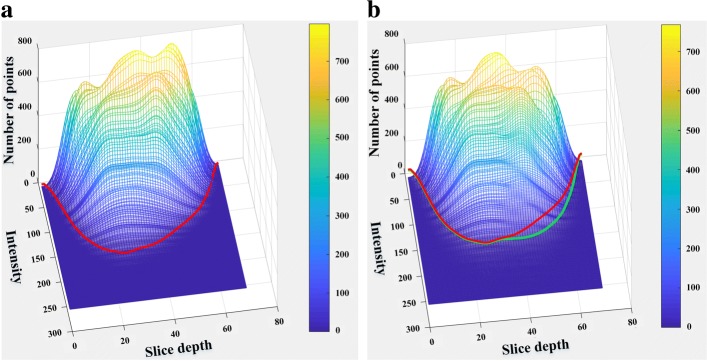
Results: Three-dimensional Membrane Morphological Segmentation (3DMMS) makes use of several novel techniques, such as statistical intensity normalization, and region filters, to pre-process the cell images. We then segment membrane stacks based on watershed algorithms. 3DMMS achieves high robustness and precision over different time points (development stages). It is compared with two state-of-the-art algorithms, RACE and BCOMS. Quantitative analysis shows 3DMMS performs best with the average Dice ratio of 97.7% at six time points. In addition, 3DMMS also provides time series of internal and external shape features of C. elegans.
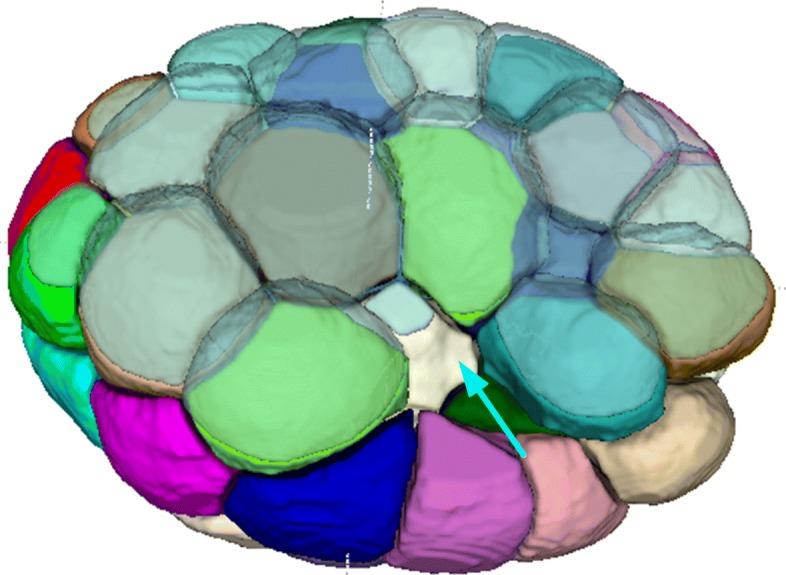
Conclusion: We have developed the 3DMMS based technique for embryonic shape reconstruction at the single-cell level. With cells accurately segmented, 3DMMS makes it possible to study cellular shapes and bridge morphological features and biological expression in embryo research.
Keywords: 3D morphological segmentation; C. elegans; Shape features; Watershed segmentation.
Conflict of interest statement
Ethics approval and consent to participate
Not applicable.
Consent for publication
Not applicable.
Competing interests
The authors declare that they have no competing interests.
Publisher’s Note
Springer Nature remains neutral with regard to jurisdictional claims in published maps and institutional affiliations.
Figures


Similar articles
-
Establishment of a morphological atlas of the Caenorhabditis elegans embryo using deep-learning-based 4D segmentation.Nat Commun. 2020 Dec 7;11(1):6254. doi: 10.1038/s41467-020-19863-x. Nat Commun. 2020. PMID: 33288755 Free PMC article.
-
Biologically constrained optimization based cell membrane segmentation in C. elegans embryos.BMC Bioinformatics. 2017 Jun 19;18(1):307. doi: 10.1186/s12859-017-1717-6. BMC Bioinformatics. 2017. PMID: 28629355 Free PMC article.
-
A generic classification-based method for segmentation of nuclei in 3D images of early embryos.BMC Bioinformatics. 2014 Jan 14;15:9. doi: 10.1186/1471-2105-15-9. BMC Bioinformatics. 2014. PMID: 24423252 Free PMC article.
-
C. elegans Embryonic Morphogenesis.Curr Top Dev Biol. 2016;116:597-616. doi: 10.1016/bs.ctdb.2015.11.012. Epub 2016 Feb 1. Curr Top Dev Biol. 2016. PMID: 26970644 Review.
-
The first cell cycle of the Caenorhabditis elegans embryo: spatial and temporal control of an asymmetric cell division.Results Probl Cell Differ. 2011;53:109-33. doi: 10.1007/978-3-642-19065-0_6. Results Probl Cell Differ. 2011. PMID: 21630143 Review.
Cited by
-
Delineating the mechanisms and design principles of Caenorhabditis elegans embryogenesis using in toto high-resolution imaging data and computational modeling.Comput Struct Biotechnol J. 2022 Aug 19;20:5500-5515. doi: 10.1016/j.csbj.2022.08.024. eCollection 2022. Comput Struct Biotechnol J. 2022. PMID: 36284714 Free PMC article. Review.
-
Improved 3D cellular morphometry of Caenorhabditis elegans embryos using a refractive index matching medium.PLoS One. 2020 Sep 30;15(9):e0238955. doi: 10.1371/journal.pone.0238955. eCollection 2020. PLoS One. 2020. PMID: 32997668 Free PMC article.
-
Systematic analysis of cell morphodynamics in C. elegans early embryogenesis.Front Bioinform. 2023 Mar 21;3:1082531. doi: 10.3389/fbinf.2023.1082531. eCollection 2023. Front Bioinform. 2023. PMID: 37026092 Free PMC article.
-
Establishment of a morphological atlas of the Caenorhabditis elegans embryo using deep-learning-based 4D segmentation.Nat Commun. 2020 Dec 7;11(1):6254. doi: 10.1038/s41467-020-19863-x. Nat Commun. 2020. PMID: 33288755 Free PMC article.
-
Software tools for 3D nuclei segmentation and quantitative analysis in multicellular aggregates.Comput Struct Biotechnol J. 2020 Jun 3;18:1287-1300. doi: 10.1016/j.csbj.2020.05.022. eCollection 2020. Comput Struct Biotechnol J. 2020. PMID: 32612752 Free PMC article. Review.
References
-
- Meijering E. Cell segmentation: 50 years down the road. IEEE Signal Proc Mag. 2012;29(5):140–5. doi: 10.1109/MSP.2012.2204190. - DOI
-
- Lu C, Mahmood M, Jha N, Mandal M. A robust automatic nuclei segmentation technique for quantitative histopathological image analysis. Anal Quant Cytol Histol. 2012;34(6):296. - PubMed
-
- Oscanoa J, Doimi F, Dyer R, Araujo J, Pinto J, Castaneda B. Automated segmentation and classification of cell nuclei in immunohistochemical breast cancer images with estrogen receptor marker. In: 2016 38th Annual International Conference of the IEEE Engineering in Medicine and Biology Society (EMBC): 2016. p. 2399–402. ISSN 1558-4615 10.1109/EMBC.2016.7591213. - PubMed
MeSH terms
Grants and funding
LinkOut - more resources
Full Text Sources
