. 2019 May 4;393(10183):1843-1855.
doi: 10.1016/S0140-6736(19)30226-0. Epub 2019 Apr 5.

Mapping diphtheria-pertussis-tetanus vaccine coverage in Africa, 2000-2016: a spatial and temporal modelling study

Affiliations

Mapping diphtheria-pertussis-tetanus vaccine coverage in Africa, 2000-2016: a spatial and temporal modelling study

Jonathan F Mosser et al. Lancet. .

Abstract

Background: Routine childhood vaccination is among the most cost-effective, successful public health interventions available. Amid substantial investments to expand vaccine delivery throughout Africa and strengthen administrative reporting systems, most countries still require robust measures of local routine vaccine coverage and changes in geographical inequalities over time.

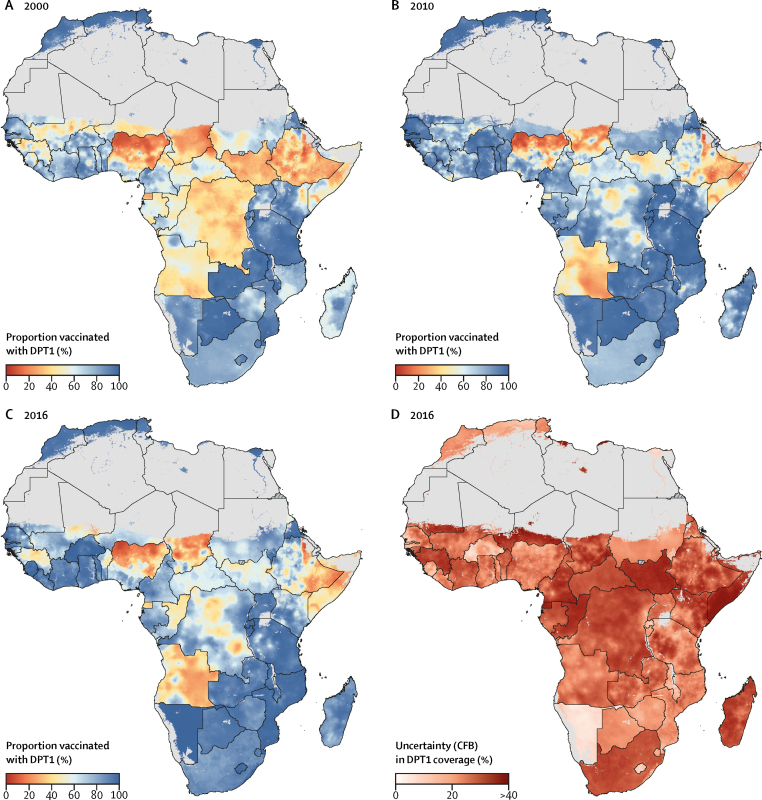
Methods: This analysis drew from 183 surveys done between 2000 and 2016, including data from 881 268 children in 49 African countries. We used a Bayesian geostatistical model calibrated to results from the Global Burden of Diseases, Injuries, and Risk Factors Study 2017, to produce annual estimates with high-spatial resolution (5 × 5 km) of diphtheria-pertussis-tetanus (DPT) vaccine coverage and dropout for children aged 12-23 months in 52 African countries from 2000 to 2016.

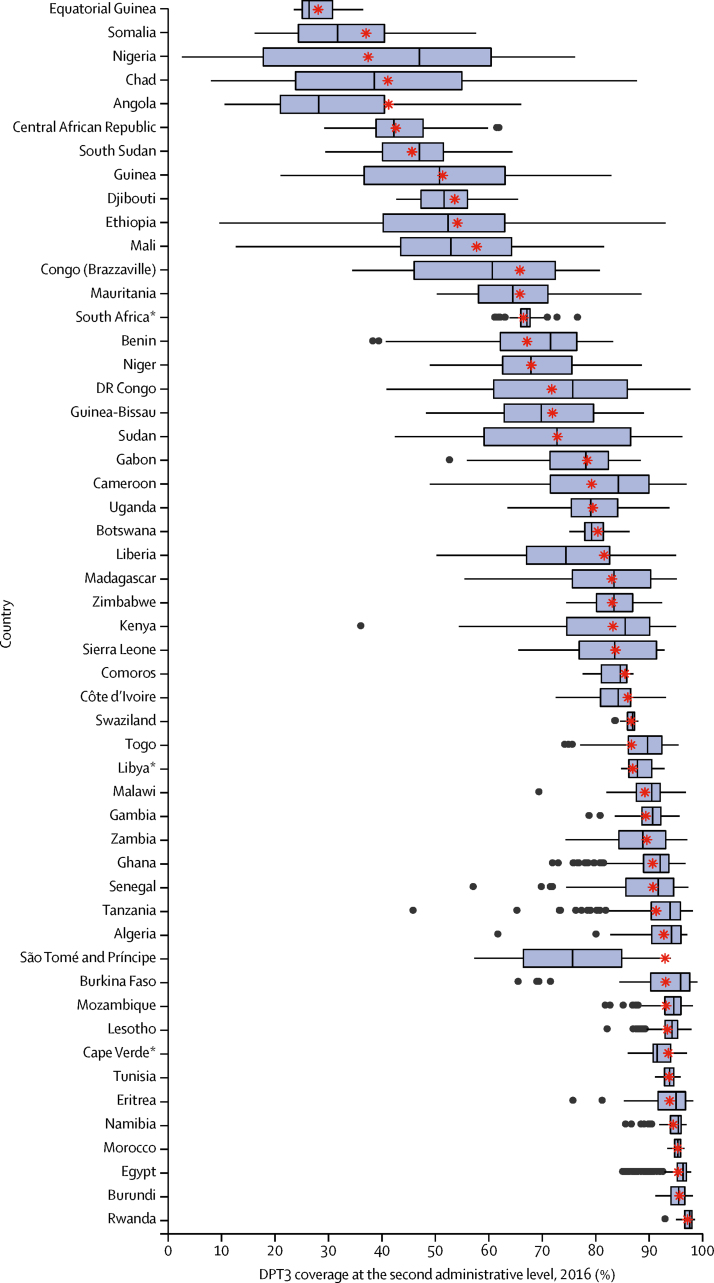
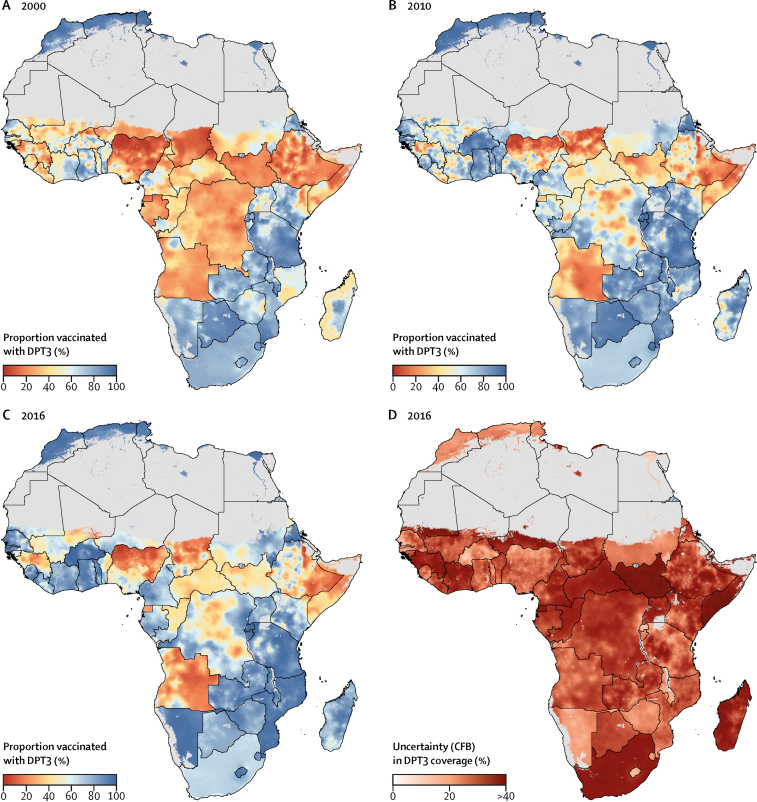
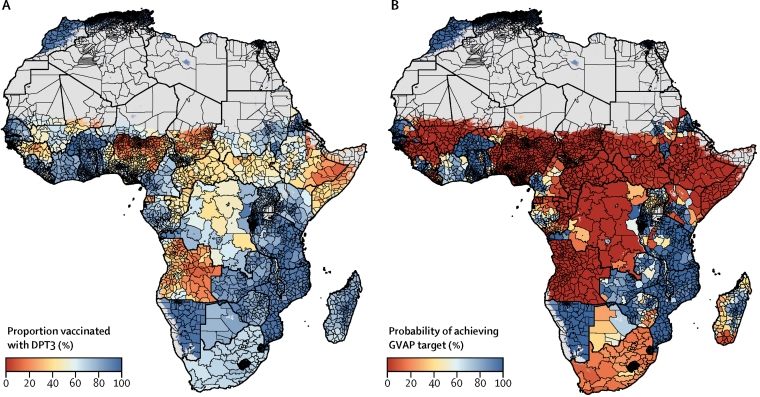
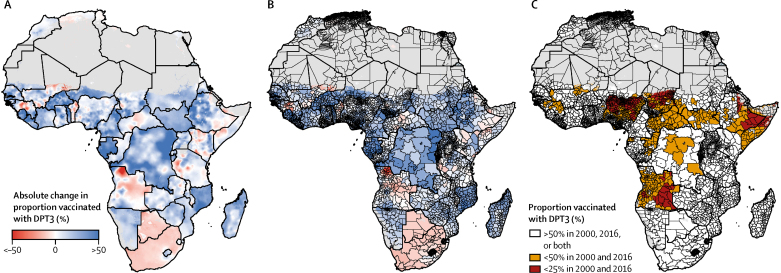
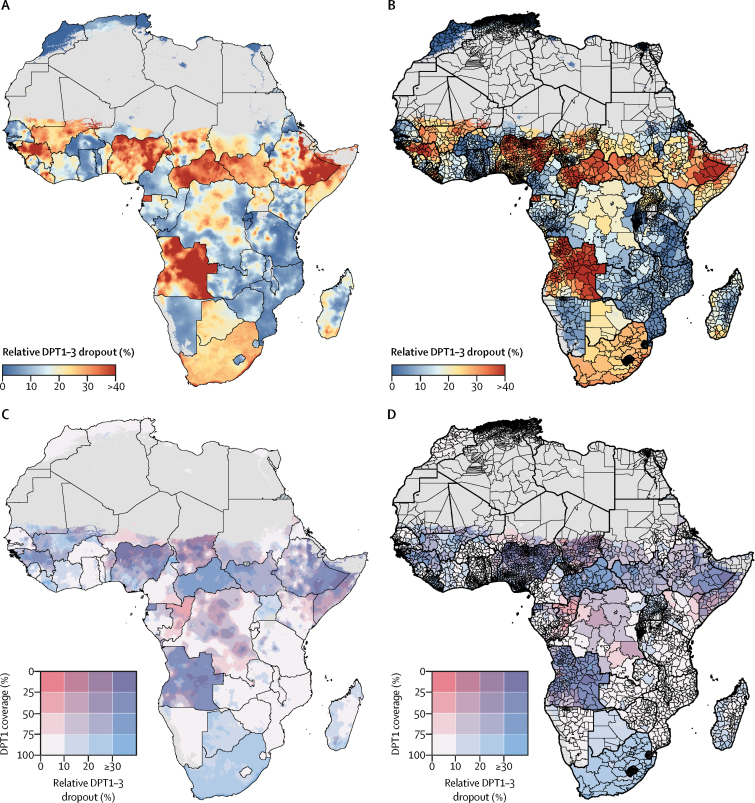
Findings: Estimated third-dose (DPT3) coverage increased in 72·3% (95% uncertainty interval [UI] 64·6-80·3) of second-level administrative units in Africa from 2000 to 2016, but substantial geographical inequalities in DPT coverage remained across and within African countries. In 2016, DPT3 coverage at the second administrative (ie, district) level varied by more than 25% in 29 of 52 countries, with only two (Morocco and Rwanda) of 52 countries meeting the Global Vaccine Action Plan target of 80% DPT3 coverage or higher in all second-level administrative units with high confidence (posterior probability ≥95%). Large areas of low DPT3 coverage (≤50%) were identified in the Sahel, Somalia, eastern Ethiopia, and in Angola. Low first-dose (DPT1) coverage (≤50%) and high relative dropout (≥30%) together drove low DPT3 coverage across the Sahel, Somalia, eastern Ethiopia, Guinea, and Angola.

Interpretation: Despite substantial progress in Africa, marked national and subnational inequalities in DPT coverage persist throughout the continent. These results can help identify areas of low coverage and vaccine delivery system vulnerabilities and can ultimately support more precise targeting of resources to improve vaccine coverage and health outcomes for African children.

Funding: Bill & Melinda Gates Foundation.


Figures

Figure 1
Figure 1
Distribution of diphtheria-pertussis-tetanus third-dose (DPT3) vaccine coverage at the second administrative level for 52 countries in Africa, 2016 Each box plot displays the distribution of estimated DPT3 coverage among second administrative units in 2016 for a single country. National mean DPT3 coverage estimates from GBD 2017 are shown as red asterisks. *No data were available for these countries.
Figure 2
Figure 2
Estimated diphtheria-pertussis-tetanus third-dose (DPT3) vaccine coverage in Africa, 2000–16 (A–C) DPT3 coverage among children aged 12–23 months with a 5 × 5 km resolution in 2000, 2010, and 2016. (D) Model uncertainty in 2016; model uncertainty is displayed by use of the Coffey-Feingold-Bromberg metric (CFB), a measure of uncertainty that is comparable regardless of mean coverage and scales from 0% (no uncertainty) to 100% (highest possible uncertainty for a given mean). Results are masked in grey in areas where total population density was less than ten individuals per 1 × 1 km pixel in 2015 per WorldPop estimates, or where land cover was classified as “barren or sparsely vegetated” on the basis of MODIS satellite data in 2013. No data were available for Cape Verde, Libya, and South Africa.
Figure 3
Figure 3
Estimated diphtheria-pertussis-tetanus third-dose (DPT3) vaccine coverage in Africa by administrative district and probabilities of achieving Global Vaccine Action Plan (GVAP) target coverage in 2016 (A) DPT3 coverage among children aged 12–23 months at the second administrative level. (B) Probability of second-level administrative unit achieving the GVAP target of 80% DPT3 coverage or higher in 2016. Results are masked in grey in areas where total population density was less than ten individuals per 1 × 1 km pixel in 2015 per WorldPop estimates, or where land cover was classified as “barren or sparsely vegetated” on the basis of MODIS satellite data in 2013. No data were available for Cape Verde, Libya, and South Africa.
Figure 4
Figure 4
Estimated changes in diphtheria-pertussis-tetanus third-dose (DPT3) vaccine coverage in Africa, 2000–16 Mean estimated changes in DPT3 coverage among children aged 12–23 months between 2000 and 2016 with a 5 × 5 km resolution (A) and at the second administrative level (B). Colours represent estimated absolute change (%), with positive changes (increased coverage) represented in blue and negative changes (decreased coverage) in red. Increases and decreases of 50% or higher are represented by dark blue (increases) and dark red (decreases). (C) Areas of low DPT3 coverage over time; second administrative units with coverage lower than 25% in both 2000 and 2016 are represented in red, whereas units with coverage ranging from 25% to lower than 50% in both 2000 and 2016 are represented in orange. Results are masked in grey in areas where total population density was less than ten individuals per 1 × 1 km pixel in 2015 per WorldPop estimates, or where land cover was classified as “barren or sparsely vegetated” on the basis of MODIS satellite data in 2013. No data were available for Cape Verde, Libya, and South Africa.
Figure 5
Figure 5
Estimated diphtheria-pertussis-tetanus first-dose (DPT1) vaccine coverage in Africa, 2000–16 (A–C) DPT1 coverage among children aged 12–23 months at the 5 × 5 km resolution in 2000, 2010, and 2016. (D) Model uncertainty in 2016; model uncertainty is displayed by use of the Coffey-Feingold-Bromberg metric (CFB), a measure of uncertainty that is comparable regardless of mean coverage and scales from 0% (no uncertainty) to 100% (highest possible uncertainty for a given mean). Results are masked in grey in areas where total population density was less than ten individuals per 1 × 1 km pixel in 2015 per WorldPop estimates, or where land cover was classified as “barren or sparsely vegetated” on the basis of MODIS satellite data in 2013. No data were available for Cape Verde, Libya, and South Africa.
Figure 6
Figure 6
Estimated relative diphtheria-pertussis-tetanus (DPT) vaccine dropout (first dose minus third dose; DPT1–3) in Africa, 2016 DPT1–3 relative dropout with a 5 × 5 km resolution (A) and at the second administrative unit level (B). (C, D) Bivariate maps of DPT1 coverage and DPT1–3 relative dropout; each grid square represents a range of DPT1 coverage (vertical axis, white to red) and DPT1–3 dropout (horizontal axis, white to blue) for each modelled 5 × 5 km area (C) and second-level administrative unit (D) in Africa. Results are masked in grey in areas where total population density was less than ten individuals per 1 × 1 km pixel in 2015 per WorldPop estimates, or where land cover was classified as “barren or sparsely vegetated” on the basis of MODIS satellite data in 2013. No data were available for Cape Verde, Libya, and South Africa.

Comment in

References

    1. Ozawa S, Mirelman A, Stack ML, Walker DG, Levine OS. Cost-effectiveness and economic benefits of vaccines in low- and middle-income countries: a systematic review. Vaccine. 2012;31:96–108. - PubMed
    1. Ozawa S, Clark S, Portnoy A. Estimated economic impact of vaccinations in 73 low- and middle-income countries, 2001–2020. Bull World Health Organ. 2017;95:629–638. - PMC - PubMed
    1. Wang H, Abajobir AA, Abate KH. Global, regional, and national under-5 mortality, adult mortality, age-specific mortality, and life expectancy, 1970–2016: a systematic analysis for the Global Burden of Disease Study 2016. Lancet. 2017;390:1084–1150. - PMC - PubMed
    1. Naghavi M, Abajobir AA, Abbafati C. Global, regional, and national age-sex specific mortality for 264 causes of death, 1980–2016: a systematic analysis for the Global Burden of Disease Study 2016. Lancet. 2017;390:1151–1210. - PMC - PubMed
    1. Haakenstad A, Birger M, Singh L. Vaccine assistance to low- and middle-income countries increased to $3·6 billion in 2014. Health Aff Proj Hope. 2016;35:242–249. - PubMed

MeSH terms

Substances