. 2019 Jul;18(7):1285-1306.
doi: 10.1074/mcp.RA118.000988. Epub 2019 Apr 8.

Unraveling Hidden Components of the Chloroplast Envelope Proteome: Opportunities and Limits of Better MS Sensitivity

Affiliations

Unraveling Hidden Components of the Chloroplast Envelope Proteome: Opportunities and Limits of Better MS Sensitivity

Imen Bouchnak et al. Mol Cell Proteomics. 2019 Jul.

Abstract

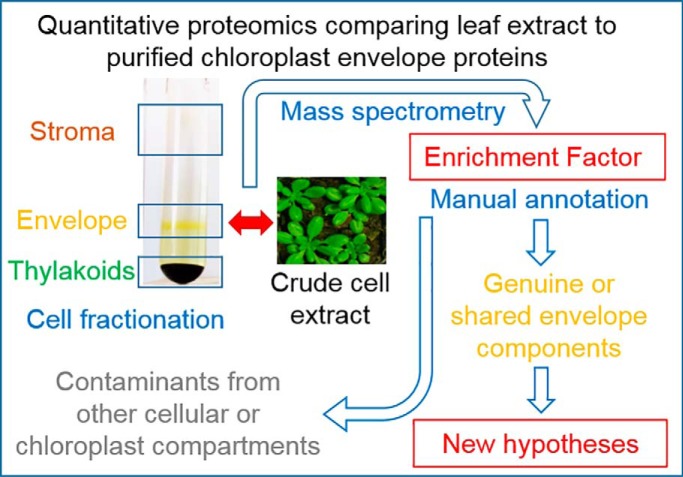
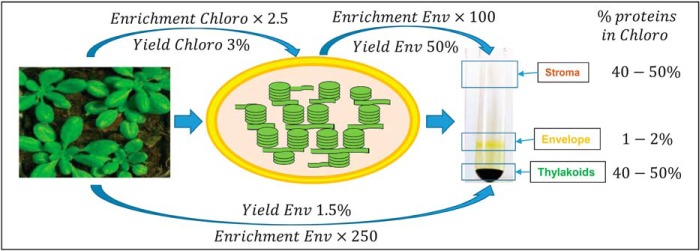
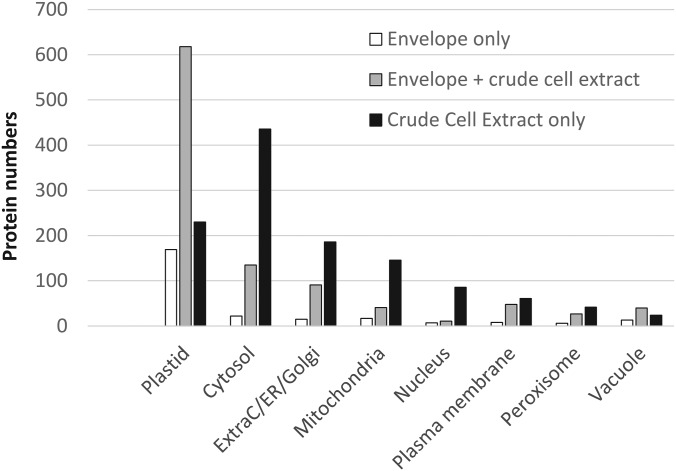
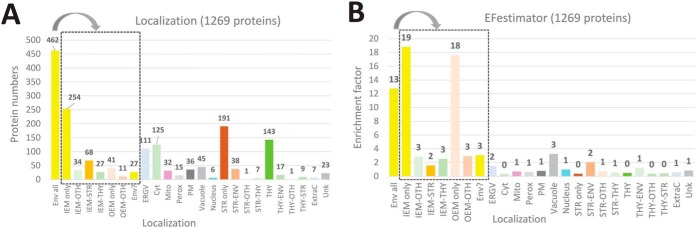
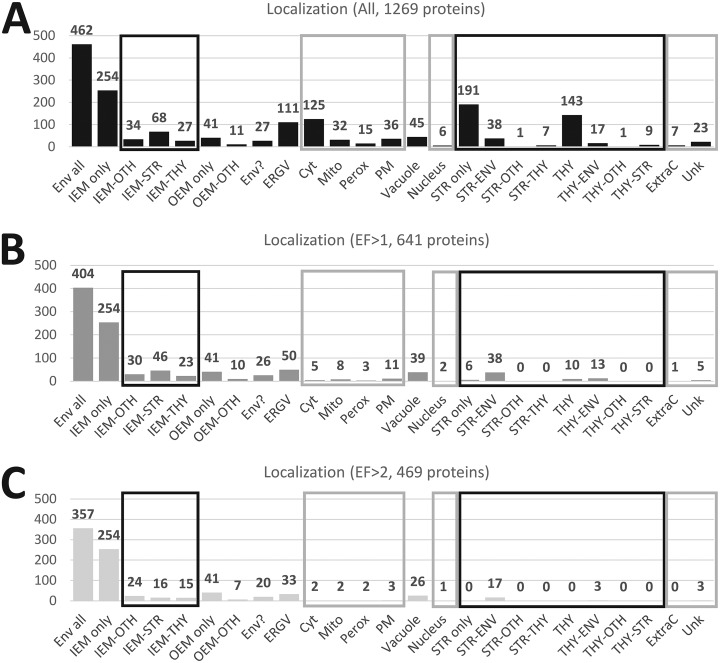
The chloroplast is a major plant cell organelle that fulfills essential metabolic and biosynthetic functions. Located at the interface between the chloroplast and other cell compartments, the chloroplast envelope system is a strategic barrier controlling the exchange of ions, metabolites and proteins, thus regulating essential metabolic functions (synthesis of hormones precursors, amino acids, pigments, sugars, vitamins, lipids, nucleotides etc.) of the plant cell. However, unraveling the contents of the chloroplast envelope proteome remains a difficult challenge; many proteins constituting this functional double membrane system remain to be identified. Indeed, the envelope contains only 1% of the chloroplast proteins (i.e. 0.4% of the whole cell proteome). In other words, most envelope proteins are so rare at the cell, chloroplast, or even envelope level, that they remained undetectable using targeted MS studies. Cross-contamination of chloroplast subcompartments by each other and by other cell compartments during cell fractionation, impedes accurate localization of many envelope proteins. The aim of the present study was to take advantage of technologically improved MS sensitivity to better define the proteome of the chloroplast envelope (differentiate genuine envelope proteins from contaminants). This MS-based analysis relied on an enrichment factor that was calculated for each protein identified in purified envelope fractions as compared with the value obtained for the same protein in crude cell extracts. Using this approach, a total of 1269 proteins were detected in purified envelope fractions, of which, 462 could be assigned an envelope localization by combining MS-based spectral count analyses with manual annotation using data from the literature and prediction tools. Many of such proteins being previously unknown envelope components, these data constitute a new resource of significant value to the broader plant science community aiming to define principles and molecular mechanisms controlling fundamental aspects of plastid biogenesis and functions.

Keywords: Cell fractionation*; Cellular organelles*; Chloroplast; Chloroplast envelope; Plant Biology*; Subcellular Separation; Subcellular analysis.


Figures

None
Graphical abstract
Fig. 1.
Fig. 1.
Theoretical enrichment factor (EF) of envelope proteins, from crude cell extract to purified envelope fractions. Chloroplasts contain 40% of plant cell proteins. Thus, an enrichment factor of chloroplast proteins in Percoll-purified chloroplast fraction compared with total extract would be 2.5. Because the chloroplast envelope represents a minor chloroplast component (i.e. only 1–2% of the chloroplast proteins), envelope proteins should be around 250 times more abundant in the purified envelope fraction when compared with whole cell extract. This enrichment factor (EF) could be used to discriminate genuine envelope proteins from contaminants.
Fig. 2.
Fig. 2.
Predicted subcellular localization of proteins identified in purified envelope fractions and crude cell extracts according to the SUBA3 database (SUBAcon, see (88). Note that only 1 of the almost 2500 proteins detected during this work was not present in the SUBA3 database. Proteins identified in envelope fractions are enriched in predicted plastid proteins whereas crude cell extracts (CCE) contain more proteins predicted to be localized in other cell compartments. Envelope only (white): proteins only detected in the envelope fraction. Envelope + CCE (gray): proteins detected in both envelope and crude cell extract. CCE only (black): proteins detected in crude cell extract and absent from the list of envelope proteins.
Fig. 3.
Fig. 3.
Subplastidial and subcellular localizations of the 1269 proteins detected in purified envelope fractions as deduced from manual annotation (see supplemental Table S5). The black square contains subcategories of envelope proteins (Env All): proteins only detected in envelope (IEM or OEM only), proteins shared with other undefined plastid compartments (IEM- or OEM-OTH), stroma (IEM-STR) or thylakoid (IEM-THY) or envelope candidates (Env?). A, As deduced from information present in the literature, databases and prediction tools (see Fig. 3), only 462 (383 Env + 52 OEM + 27 Env?) of the 1269 proteins are predicted to be associated with envelope membranes. B, As expected (see Fig. 1 and supplemental Fig. S3, “safe set”), the average enrichment factor of predicted envelope proteins is far above that of proteins associated with other plastid or cell compartments. Note the relatively low EF values of proteins shared between envelope and other plastid compartments, and the surprisingly high EF value of vacuolar proteins. IEM; inner envelope membrane, OEM; outer envelope membrane, Env?; Envelope candidates; ERGV: endoplasmic reticulum/Golgi, Cyto; cytosol, Mito; mitochondria, Perox; peroxisome, PM; plasma membrane, Vacuole; vacuole, Nucleus; nucleus, Str; stroma, thy; thylakoid, Ext; extracellular localization, Unk; unknown and unpredictable localization, OTH; other undefined localization.
Fig. 4.
Fig. 4.
Functional categories of the chloroplast envelope proteome as deduced from manual annotation (see supplemental Table S5, column “Curated function”). Functional annotations of the 462 envelope proteins were collected from the appropriate literature (PubMed) and databases (Uniprot, TAIR, MapManBins…). Note that although 20% of envelope proteins were classified as “unknown,” the functions of the vast majority of proteins assigned to known functional groups were deduced from sequence similarity and remain to be demonstrated.
Fig. 5.
Fig. 5.
Descriptive statistics depicting groups of EF values for cell proteins identified in purified envelope fractions (see supplemental Table S5, “this work,” columns “EFestimator” and “Simplified location (this work)”). A, Box plots displaying EF variations in the chloroplast envelope proteome (average EF = 30) when compared with other proteins (average EF = 0.1). B, Most non-envelope cell components have lower EFs. Surprisingly, vacuolar components are slightly enriched in the purified envelope fraction with an average of 2. ENV; All envelope proteins (including outer envelope membrane components), ENV-Oth; proteins shared with other undefined plastid compartments, ENV-STR: envelope proteins shared with the stroma, ENV-Thy; envelope proteins shared with the thylakoid, ENV?; Envelope candidates; OTH-CYT; cytosol, OTH-ERGV: endoplasmic reticulum/Golgi, OTH-Ext; extracellular localization, OTH-Mit; mitochondria, OTH-Nuc; nucleus, OTH-PER; peroxisome, OTH-PM; plasma membrane, OTH-Vac; vacuole, STR; stroma, THY; thylakoid. Descriptive statistics depicting groups of EF values for functional categories at the chloroplast envelope scale. C, Box plots displaying EF variations across functional categories (see Fig. 4) of the chloroplast envelope proteome. D, Note that when assigning protein complexes (e.g. 14 Clp subunits 9 FtsH subunits) to a single functional category (e.g. here, “Chaperone and protease”), both the interquartile ranges and the degree of dispersion are reduced (see A). Outliers (here, ClpC2 and Ftsh7) are plotted (red squares) as individual points easily identified in supplemental Table S5 (“this work,” columns “EFestimator” and “Curated function (this work)”). Ribosomal proteins = 34 proteins, transporters = 88 proteins.
Fig. 6.
Fig. 6.
Increasing the EF threshold level to 1 or even 2 reduces the number of envelope proteins shared with other compartments and excludes most other plastid and cell components (see supplemental Table S5, A and B, “Only EF>1” or C, “Only EF>2”). Note that most (84% for EF>1 or 95% for EF>2) of the 406 plastid proteins (right black squares) localized in the stroma and thylakoid are excluded using a threshold of 1 or 2 when compared with whole data. This is also true for most (85% for EF>1 or 95% for EF>2) of the 244 proteins (gray squares) from the cytosol, mitochondria, peroxisome, plasma membrane, nucleus, extracellular space, and unknown compartment. However, note that even an EF threshold of 2 does not remove non-negligible parts of ER/Golgi (30%) and vacuolar (58%) components.
Fig. 7.
Fig. 7.
Intermediate EF values are compatible with genuine envelope localization. A, Representative SDS-PAGE analysis. Each lane contains 15 μg of proteins. CCE, crude cell extract; MW, molecular weight; E, envelope fraction, S, stroma; T, thylakoid. RbcL, Large Subunit of Rubisco. LHCP, Light harvesting complex proteins. B, Validation of the multiple subplastidial localizations of FtsY protein by Western blotting. Experiment performed on Arabidopsis plants, using FtsY antibody. The expected MW of the mature form (i.e. after cleavage of its plastid transit peptide) of FtsY is 35.1 kDa. Values between brackets are % abundance in the envelope, stroma, and thylakoids, according to Ferro et al. (12), and the EF value (this work). As expected from previous data (see AT_CHLORO database), FtsY is shared between the three chloroplast sub-compartments (34% in Envelope, 32% in Stroma and 33% in Thylakoid). Note that although unambiguously present in the envelope membrane, the EF value (2.7) of FtsY is far below the average EF value of envelope proteins (i.e. 13, see Fig. 3). LHCP, Light harvesting complex proteins. HMA1, Heavy Metal ATPase 1. KARI, Ketol-acid reducto-isomerase.
Fig. 8.
Fig. 8.
Illustration of the correlation between enrichment factor (EF) and subcellular or subplastidial localizations of proteins deduced from in planta expression of GFP/CFP fusions. To investigate protein localizations, Arabidopsis plants stably expressing UP1-GFP (envelope only, intermediate EF 8.0), SFR2-CFP (outer envelope membrane, intermediate EF 7.7), VTE1-GFP (shared between envelope and thylakoid, intermediate EF 1.7), TSP9-CFP (thylakoid only, low EF 0.2), and eIF-5A-GFP (cytosol, low EF 0.2) were constructed. From left to right: data from AT_CHLORO (% in envelope, stroma, and thylakoid), deduced subcellular and subplastidial localization, EF deduced from this work, fluorescence of GFP or CFP fusion proteins, chlorophyll auto-fluorescence, merge of GFP/CFP and chlorophyll fluorescences, and protein names. Note that the fluorescence of SFR2-CFP reveals that SFR2, which previous data have shown is localized in the outer envelope membrane (43), might also be shared with non-plastid structures, thus explaining its intermediate EF value. One would expect a higher EF value for UP1, which is localized to the envelope only. However, note that UP1 was not detected in the crude cell extract sample and its EF might have been underestimated. The perfect correlation between TSP9-CFP fluorescence and chlorophyll autofluorescence agrees with the thylakoid localization of the protein and supports its lower EF value of 0.2. Note that although correlations between EF values and subcellular localizations were obtained, GFP fusion overexpression systems might not accurately reflect the localizations of the endogenous proteins.
Fig. 9.
Fig. 9.
Detection of vacuolar and ER/Golgi components in purified envelope fractions is partially explained by cross-contamination. A, SDS-PAGE analysis. Each lane contains 15 μg of proteins. MW, molecular weight; CCE, crude leaf extract; Mic, microsomal fraction, Ton, tonoplast fraction, Cp, Percoll-purified chloroplast, E, envelope fraction, S, stroma; T, thylakoid. B, Analysis of envelope contamination with markers from ER/Golgi and tonoplast components. Validation of the enrichment of HMA1 (envelope marker) when compared with CCE. As expected, Bip (ER marker) is enriched in microsomal fraction and contaminates purified tonoplast fractions. The same is true for V-ATPAse (tonoplast marker), which is strongly enriched in the tonoplast fraction. Note that both Bip and V-ATPAse signals were barely detectable in purified envelope fractions. However, these signals are not enriched when compared with CCE. Surprisingly, the signal detected using the bob-TIP antibody (raised against N- and C-ter of the cauliflower TIP1.1, a tonoplast marker), is similar in the tonoplast and purified envelope fractions, thus suggesting specific cross-contamination or dual localization. Note that this protein was the only TIP isoform that was previously detected in envelope fractions by both Simm et al. (14) and Ferro et al. (12). C, Alignment of N- and C-ter of cauliflower bobTIP1.1, supporting detection of the TIP1.1 protein in Arabidopsis samples.

Similar articles

Cited by

References

    1. Leister D. (2016) Towards understanding the evolution and functional diversification of DNA-containing plant organelles. F1000Res. 5, - PMC - PubMed
    1. Trentmann O., and Haferkamp I. (2013) Current progress in tonoplast proteomics reveals insights into the function of the large central vacuole. Front. Plant Sci. 4, 34. - PMC - PubMed
    1. Gould S. B., Waller R. F., and McFadden G. I. (2008) Plastid evolution. Ann. Rev. Plant Biol. 59, 491–517 - PubMed
    1. Cline K., and Dabney-Smith C. (2008) Plastid protein import and sorting: different paths to the same compartments. Current Opinion Plant Biol. 11, 585–592 - PMC - PubMed
    1. Jarvis P., and Lopez-Juez E. (2013) Biogenesis and homeostasis of chloroplasts and other plastids. Nature Rev. Mol. Cell Biol. 14, 787–802 - PubMed

Publication types

MeSH terms