. 2019 Jul 1;25(13):4128-4140.
doi: 10.1158/1078-0432.CCR-18-3239. Epub 2019 Apr 8.

Leukemia Inhibitory Factor Promotes Castration-resistant Prostate Cancer and Neuroendocrine Differentiation by Activated ZBTB46

Affiliations

Leukemia Inhibitory Factor Promotes Castration-resistant Prostate Cancer and Neuroendocrine Differentiation by Activated ZBTB46

Yen-Nien Liu et al. Clin Cancer Res. .

Abstract

Purpose: The molecular targets for castration-resistant prostate cancer (CRPC) are unknown because the disease inevitably recurs, and therapeutic approaches for patients with CRPC remain less well understood. We sought to investigate regulatory mechanisms that result in increased therapeutic resistance, which is associated with neuroendocrine differentiation of prostate cancer and linked to dysregulation of the androgen-responsive pathway.

Experimental design: The underlying intracellular mechanism that sustains the oncogenic network involved in neuroendocrine differentiation and therapeutic resistance of prostate cancer was evaluated to investigate and identify effectors. Multiple sets of samples with prostate adenocarcinomas and CRPC were assessed via IHC and other assays.

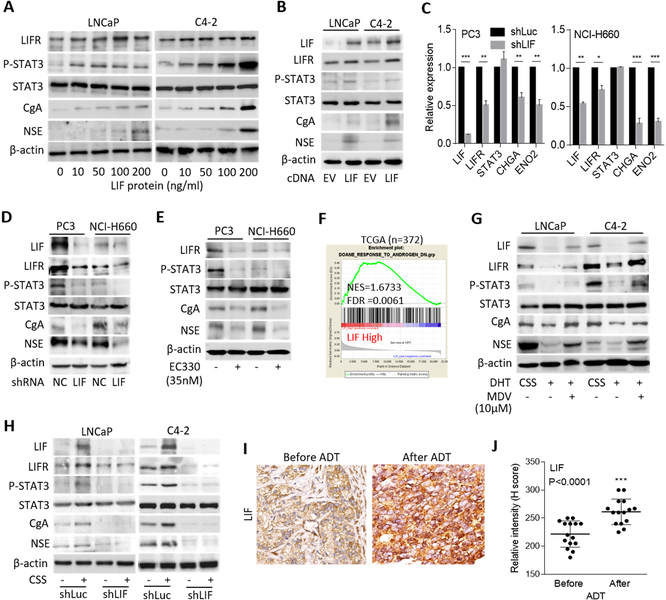
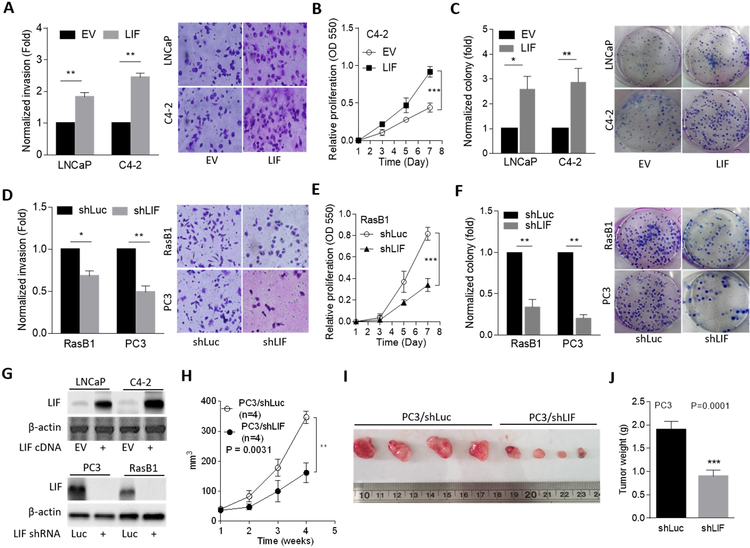
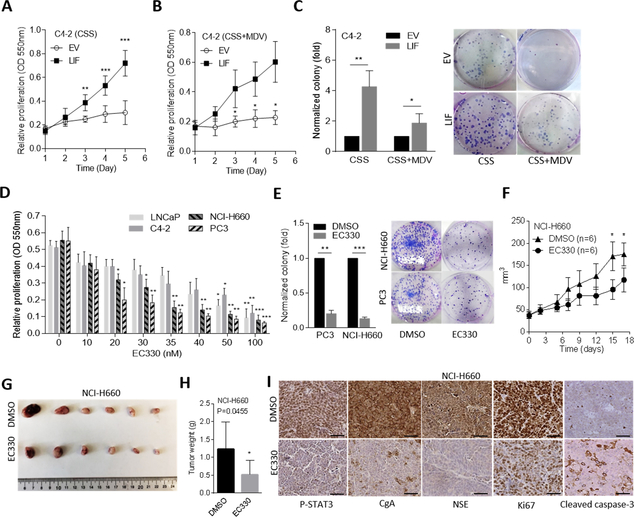
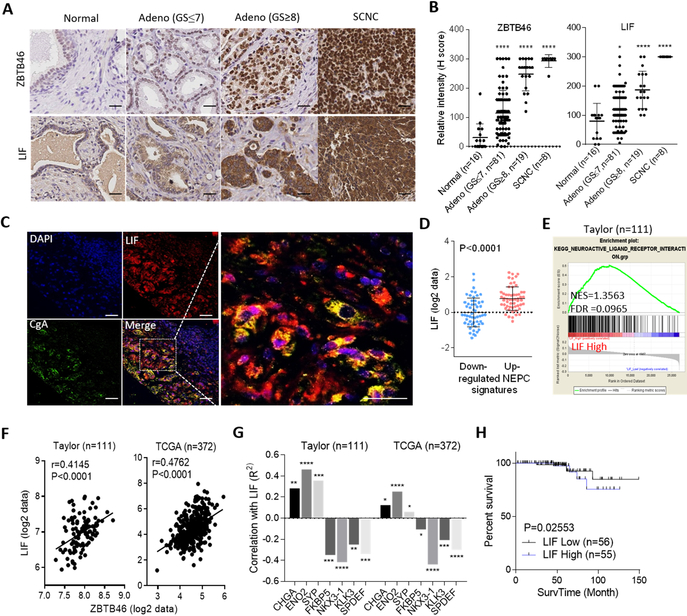
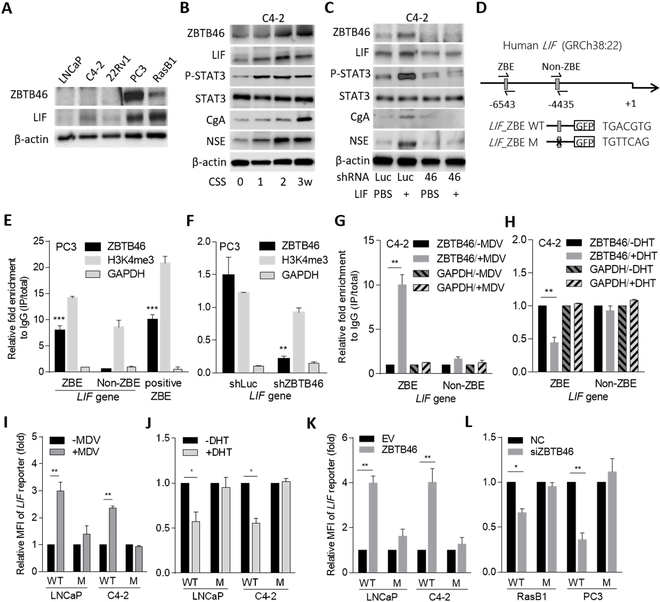
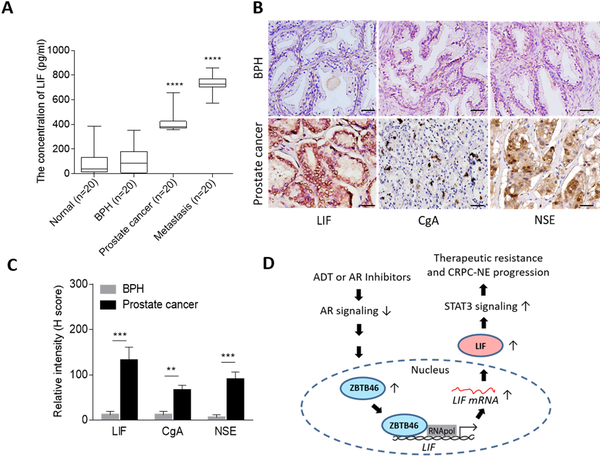
Results: We demonstrated that leukemia inhibitory factor (LIF) was induced by androgen deprivation therapy (ADT) and was upregulated by ZBTB46 in prostate cancer to promote CRPC and neuroendocrine differentiation. LIF was found to be induced in patients with prostate cancer after ADT and was associated with enriched nuclear ZBTB46 staining in high-grade prostate tumors. In prostate cancer cells, high ZBTB46 output was responsible for the activation of LIF-STAT3 signaling and neuroendocrine-like features. The abundance of LIF was mediated by ADT-induced ZBTB46 through a physical interaction with the regulatory sequence of LIF. Analysis of serum from patients showed that cases of higher tumor grade and metastatic prostate cancer exhibited higher LIF titers.

Conclusions: Our findings suggest that LIF is a potent serum biomarker for diagnosing advanced prostate cancer and that targeting the ZBTB46-LIF axis may therefore inhibit CRPC development and neuroendocrine differentiation after ADT.


Conflict of interest statement

Conflicts of interest: The authors disclose no potential conflicts of interest.

Figures

Figure 1.
Figure 1.
ADT induces LIF abundance and NE differentiation of prostate cancer cells. (A) Western blotting for LIFR, p-STAT3, STAT3, CgA, and NSE in LNCaP and C4–2 cells treated with LIF protein at various concentrations for 24 h. (B) Protein levels of LIF, LIFR, p-STAT3, STAT3, CgA, and NSE in LNCaP and C4–2 cells following stable expression of an LIF cDNA vector. (C) mRNA levels of LIF, LIFR, STAT3, CHGA, and ENO2 in PC3 and NCI-H660 cells following stable expression of an LIF shRNA vector. (D) Western blotting for LIF, LIFR, p-STAT3, STAT3, CgA, and NSE in PC3 and NCI-H660 cells stably expressing the LIF shRNA vector. (E) Western blotting for LIFR, p-STAT3, STAT3, CgA, and NSE in PC3 and NCI-H660 cells treated with EC330 (35 nM) for 24 h. (F) GSEA of the TCGA prostate cancer dataset showing that higher LIF expression was associated with an androgen-inactivated gene signature. NES, normalized enrichment score; FDR, false discovery rate. (G) Effects of DHT and MDV3100 (MDV), relative to that of the vehicle (methanol or DMSO), on the expression of LIF, LIFR, p-STAT3, STAT3, CgA, and NSE proteins in LNCaP and C4–2 cells cultured with 10% CSS-containing medium. (H) LIF, LIFR, p-STAT3, STAT3, CgA, and NSE protein levels in control (Luc) and LIF-knockdown LNCaP or C4–2 cells and those treated with androgen withdrawal (CSS) for 1 week. (I and J) IHC staining (I) and analysis (J) of cytoplasmic LIF in prostate cancer tissue sections from patients before and after ADT treatment. The 18 samples were obtained from Taipei Medical University-Wan Fang Hospital. Scale bars, 100 μm. Statistical analysis by the two-tailed Student’s t-test. Data from the quantification of mRNA are presented as the mean ± SEM, n=3. * p<0.05, ** p<0.01, *** p<0.001.
Figure 2.
Figure 2.
LIF induces malignant progression of prostate cancer cells. (A) Invasion assay in stable cell lines containing either a control (empty vector; EV) or LIF-expressing vector. Selected images are shown on the right. (B) Proliferation assay in stably LIF-expressing C4–2 cells. (C) Colony formation by LNCaP and C4–2 cells stably transfected with the EV or LIF-expressing vector. (D) Invasion assay in RasB1 and PC3 cells by stable transfection of either a control (shLuc) or an LIF-targeted shRNA (shLIF) vector. (E and F) Proliferation (E) and colony formation (F) of RasB1 or PC3 cells stably transfected with shLuc or shLIF. (G) Confirmation of the overexpression (top) or knockdown (bottom) efficiency by an LIF-expressing vector or LIF shRNA in stable cell lines. (H-J) Growth (H), images (I), and weights (J) of tumor xenografts in male nude mice 4 weeks after subcutaneous inoculation with PC3 cells stably expressing shLuc or shLIF. n=4 mice per group. Data from the invasion, proliferation, and colony formation assays are presented as the mean ± SEM from three independent experiments. * p<0.05, ** p<0.01, *** p<0.001.
Figure 3.
Figure 3.
LIF promotes tumor growth and enzalutamide resistance, and LIF inhibitor reduces NE marker expression. (A and B) Proliferation assay in C4–2 cells treated with androgen withdrawal (A, charcoal-stripped serum (CSS)) or the combination of androgen withdrawal and enzalutamide (10 μM) (B, CSS+MDV3100), n=8. (C) Quantification and images of the colony formation of C4–2 cells with androgen withdrawal (CSS) or combined androgen withdrawal with MDV3100 (10 μM) treatment (CSS+MDV) for 6 days following empty vector (EV) or LIF-expressing vector overexpression. (D) Proliferation assays in LNCaP, C4–2, PC3, and NCI-H660 cells treated with an LIF inhibitor (EC330) at the indicated concentrations for 24 h, n=8. (E) Colony formation of PC3 and NCI-H660 cells with EC330 (35 nM) treatment for 6 days. (F-H) Tumor growth analysis of NCI-H660 cells subcutaneously inoculated into male nude mice followed by treatment with EC330 (2.5 mg/kg). Tumor sizes were monitored twice a week (F), and images (G) and tumor weights (H) were also measured at the end of the experiment. n=6 mice per group. (I) IHC staining of subcutaneous tumors with antibodies specific for p-STAT3, CgA, NSE, Ki67, and cleaved caspase-3 in tumor-bearing mice from F. Scale bars represent 100 μm. Data from the proliferation and colony formation assays are presented as the mean ± SEM from three independent experiments. * p<0.05, ** p<0.01, *** p<0.001.
Figure 4.
Figure 4.
LIF is positively associated with the induction of ZBTB46 and NE markers in clinical samples. (A) IHC staining of ZBTB46 and LIF of a prostate cancer TMA from Duke University School of Medicine. Scale bars, 100 μm. (B) Relative intensities of the ZBTB46- and LIF-positive staining statuses in prostate cancer TMA sections containing normal tissues (n=16), adenocarcinomas with a Gleason score ≤ 7 (n=81), adenocarcinomas with a Gleason score ≥ 8 (n=19), and SCNCs (n=8) from Duke University School of Medicine by H-score analysis. (C) IF staining of a CRPC TMA from Duke University School of Medicine showing coexpression of LIF and CgA in the same tumor cells. Scale bars, 50 μm. (D and E) Z-score analyses (D) and GSEA (E) of the Taylor prostate dataset showing that higher LIF expression in prostate tissues was positively associated with a CRPC-NE response signaling gene set (D) and neuronal development signature (E). (F and G) Pearson correlation analysis of LIF with ZBTB46, NE markers, and androgen-response gene mRNA levels in clinical tissue samples from the Taylor and TCGA prostate cancer datasets. Significance was determined using a two-tailed test. * vs. LIF. * p<0.05, ** p<0.01, *** p<0.001, **** p<0.0001. (H) Survival analysis of patients in the Taylor dataset (n=111) based on LIF expression. A log-rank test was used for the survival curve analysis.
Figure 5.
Figure 5.
The induction of LIF is regulated by ZBTB46 in prostate cancer cells following ADT. (A) Western blotting of ZBTB46 and LIF from a panel of prostate cancer cells. (B) Western blotting of ZBTB46, LIF, p-STAT3, STAT3, CgA, and NSE in C4–2 cells after treatment with androgen withdrawal (CSS) at each time point. (C) Abundances of ZBTB46, LIF, p-STAT3, STAT3, CgA, and NSE protein levels in control (Luc) and ZBTB46-knockdown C4–2 cells and those treated with LIF protein (200 ng/ml) or vehicle (PBS) for 24 h. (D) Schematic of the predicted ZBTB46 response element (ZBE) or a non-ZBTB46 response element (non-ZBE) and an introduced binding site mutant in regulatory sequence reporter constructs of human LIF. (E) ChIP assays in PC3 cells. Antibodies against H3K4me3 and GAPDH served as the positive and negative controls, respectively. Precipitated DNA was quantified by qRT-PCR of ZBE, non-ZBE, and positive ZBE sites. Enrichment is presented as a percentage of the total input followed by normalization to immunoglobulin G (IgG). * vs. non-ZBE. (F) ChIP assays in PC3 cells following control (Luc) or ZBTB46 knockdown. * vs. shLuc. (G and H) ChIP assays in C4–2 cells following MDV3100 (10 μM, left) or DHT (10 nM, right) treatment for 10 h. (I and J) Relative MFIs of the wild-type (WT) and mutant (M) LIF reporter in LNCaP and C4–2 cells after treatment with MDV3100 (I) and DHT (J). (K and L) Relative WT and M LIF reporter activities in response to ZBTB46 overexpression in LNCaP and C4–2 cells (K) or ZBTB46 knockdown in RasB1 and PC3 cells (L). Quantification of the mRNA and ChIP data and MFIs are presented as the mean ± SEM from three independent experiments. * p<0.05, ** p<0.01, *** p<0.001.
Figure 6.
Figure 6.
LIF is a potent diagnostic and predictive biomarker for prostate cancer. (A) Measurement of LIF levels in human serum from healthy donors (n=20), patients with BPH (n=20), prostate cancer (n=20), and patients with bone metastatic tumors (n=20) collected from the Chinese PLA General Hospital. * vs. Normal. (B and C) IHC staining (B) and relative intensities (C) of samples from eight BPH patients and 18 prostate cancer patients collected from (A) for LIF, CgA, and NSE examination. Scale bars, 100 μm. ** p<0.01, *** p<0.001. (D) Proposed model of LIF-mediated therapeutic resistance and NE differentiation of prostate cancer. An anti-androgen or AR antagonist inactivates AR signaling and induces ZBTB46 expression. Induced ZBTB46 enhances malignant progression and is involved in the development of CRPC-NE by an activated LIF-STAT3 pathway.

Similar articles

Cited by

References

    1. Karantanos T, Corn PG, Thompson TC. Prostate cancer progression after androgen deprivation therapy: mechanisms of castrate resistance and novel therapeutic approaches. Oncogene 2013;32:5501–11 - PMC - PubMed
    1. Sun Y, Niu J, Huang J. Neuroendocrine differentiation in prostate cancer. Am J Transl Res 2009;1:148–62 - PMC - PubMed
    1. Beltran H, Rickman DS, Park K, Chae SS, Sboner A, MacDonald TY, et al. Molecular characterization of neuroendocrine prostate cancer and identification of new drug targets. Cancer Discov 2011;1:487–95 - PMC - PubMed
    1. Niu Y, Altuwaijri S, Lai KP, Wu CT, Ricke WA, Messing EM, et al. Androgen receptor is a tumor suppressor and proliferator in prostate cancer. Proc Natl Acad Sci U S A 2008;105:12182–7 - PMC - PubMed
    1. Nadal R, Schweizer M, Kryvenko ON, Epstein JI, Eisenberger MA. Small cell carcinoma of the prostate. Nat Rev Urol 2014;11:213–9 - PMC - PubMed

Publication types

MeSH terms