. 2019 May 15;202(10):2907-2923.
doi: 10.4049/jimmunol.1801565. Epub 2019 Apr 8.

Nur77 Links Chronic Antigen Stimulation to B Cell Tolerance by Restricting the Survival of Self-Reactive B Cells in the Periphery

Affiliations

Nur77 Links Chronic Antigen Stimulation to B Cell Tolerance by Restricting the Survival of Self-Reactive B Cells in the Periphery

Corey Tan et al. J Immunol. .

Abstract

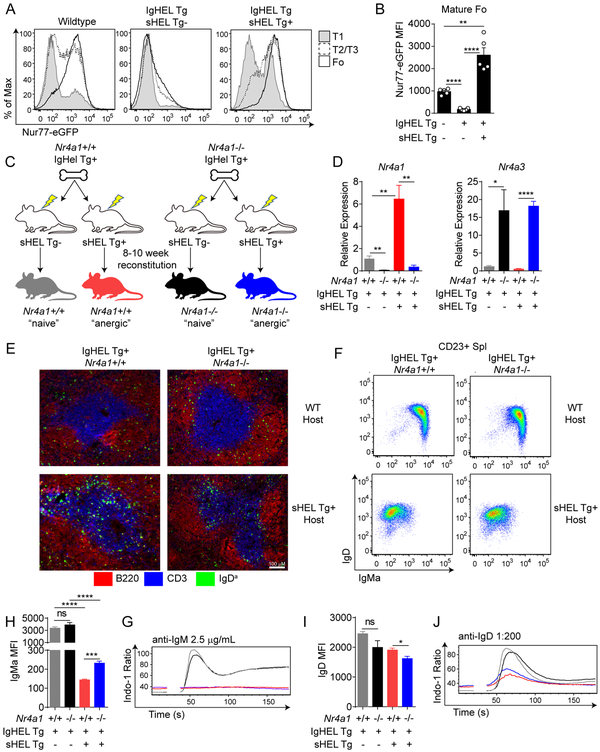
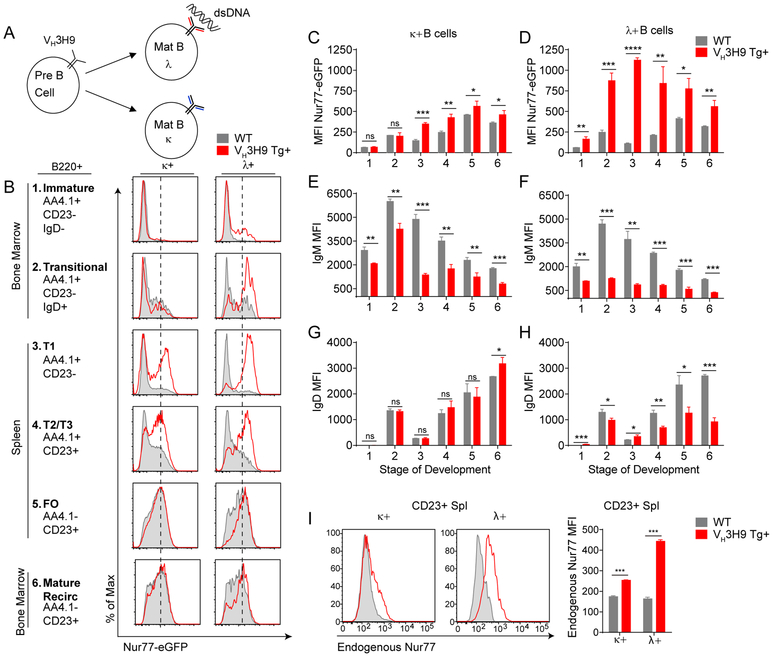
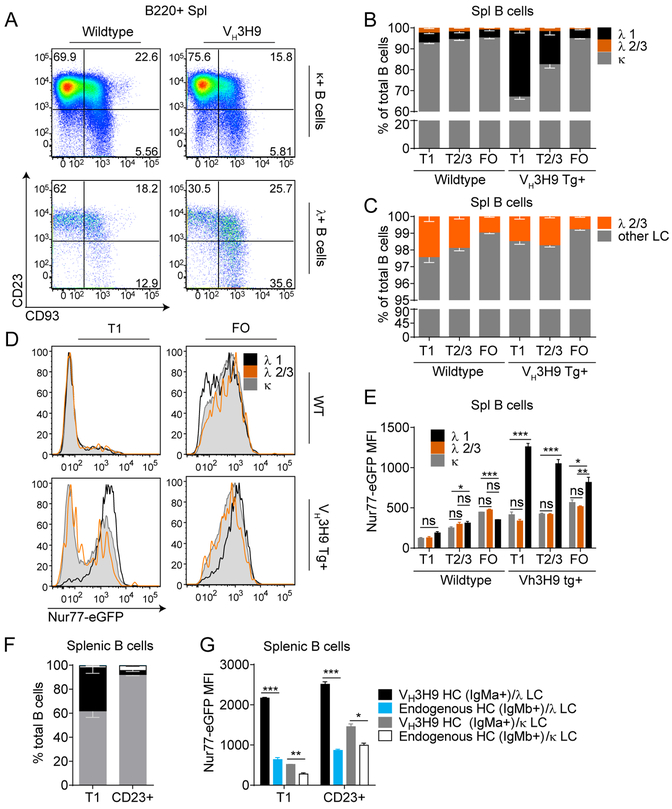
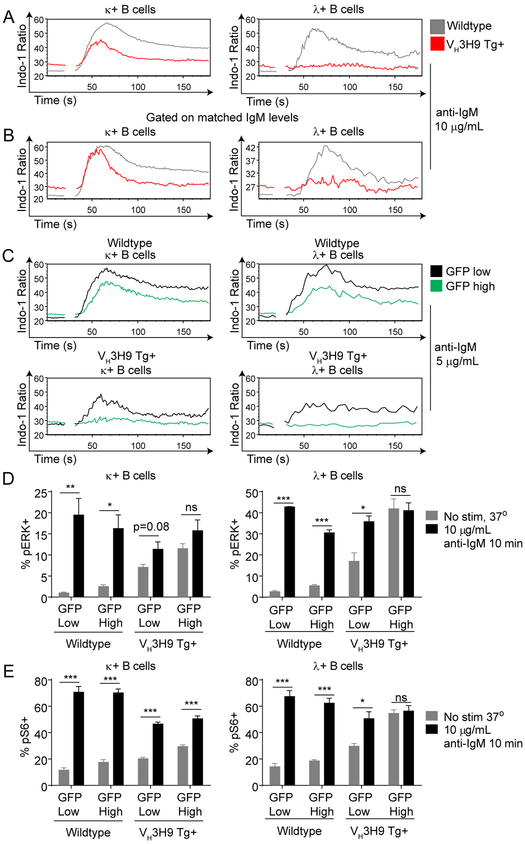
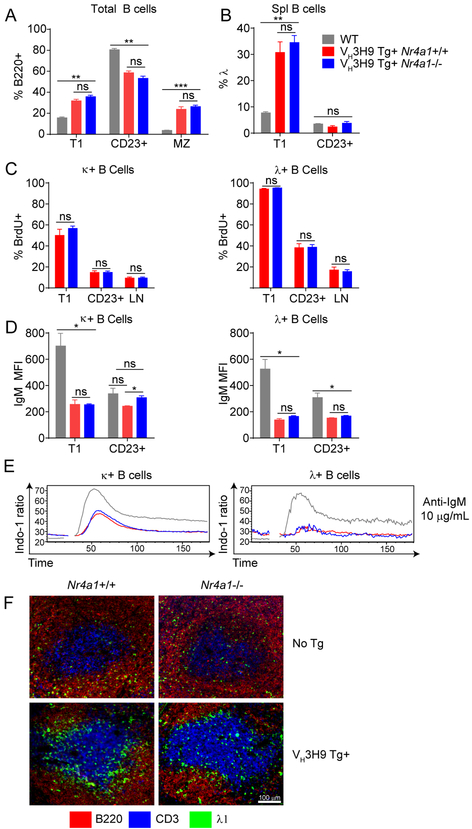
Nur77 (Nr4a1) belongs to a small family of orphan nuclear receptors that are rapidly induced by BCR stimulation, yet little is known about its function in B cells. We have previously characterized a reporter of Nr4a1 transcription, Nur77-eGFP, in which GFP expression faithfully detects Ag encounter by B cells in vitro and in vivo. In this study, we report that Nur77 expression correlates with the degree of self-reactivity, counterselection, and anergy among individual B cell clones from two distinct BCR transgenic mouse models but is dispensable for all of these tolerance mechanisms. However, we identify a role for Nur77 in restraining survival of self-reactive B cells in the periphery under conditions of competition for a limited supply of the survival factor BAFF. We find that Nur77 deficiency results in the progressive accumulation of self-reactive B cells in the mature repertoire with age and is sufficient to break B cell tolerance in VH3H9 H chain transgenic mice. We thus propose that Nur77 is upregulated in self-reactive B cells in response to chronic Ag stimulation and selectively restricts the survival of these cells, gradually pruning self-reactivity from the mature repertoire to impose a novel layer of peripheral B cell tolerance.


Figures

Figure 1.
Figure 1.. Nur77 is upregulated, but dispensable for anergy, in IgHEL B cells chronically exposed to soluble cognate antigen.
A. B220+ splenic B cells from WT, IgHEL Tg, and IgHEL/sHEL Tg Nur77-eGFP mice were stained with CD23 and CD93 to identify T1(CD23 CD93+), T2/3 (CD23+ CD93+) and Follicular (CD23+ CD93) subsets. Histograms represent Nur77-eGFP expression in these cells and are representative of at least 5 independent experiments. B. Quantification of Nur77-eGFP MFI as shown in Fig 1A. C. Schematic representation of IgHEL/sHEL Tg chimera generation. Lethally irradiated wildtype or sHEL Tg hosts were reconstituted with 5×10⁶ bone marrow cells from either Nr4a1+/+ or Nr4a1−/− IgHEL Tg hosts. After at least 10 weeks of reconstitution, mice were sacrificed for further analysis. D. Mature CD23+ splenic B cells were sorted from IgHEL chimeras. Relative Nr4a1 and Nr4a3 mRNA expression was determined via qPCR. N=4 for each group. E. Representative spleen sections depicting localization of adoptive transferred Nr4a1+/+ or Nr4a1−/− IgHEL Tg B cells (IgDa+) into WT or sHEL Tg hosts after 12 hours. Data are representative of two independent mice of each of four conditions. F. Representative flow plots showing IgM and IgD expression on splenic CD23+ mature B cells from chimeras. G, I. Quantification of IgMa and IgD MFI as shown in Fig 1F. H, J. Splenic B cells from IgHEL/sHEL Tg chimeras were loaded with Indo-1 dye. Ratiometric assessment of intracellular calcium was assessed by flow cytometry after stimulation with anti-IgM (2.5 μg/mL, H) or anti-IgD (1:200 dilution, J). Plots are representative of 3 (D) or 4 (G, I) separate mice per group.
Figure 2.
Figure 2.. Nur77 limits survival of “anergic” IgHEL Tg B cells chronically exposed to cognate HEL in vitro and in vivo Ag.
A-D. Lymph nodes were harvested from IgHEL/sHEL Tg chimeras generated as described in Fig 1C. Tg CD45.2+ B cells were mixed 1:1 with CD45.1+ WT B cells and plated at a total concentration of 5×10⁶ cells per well. These cells were incubated for up to 2 days with or without 20 ng/mL BAFF. The CD45.2/CD45.1 ratio was calculated at each time point and normalized to the CD45.2/CD45.1 cell input ratio. N=4 for each group. E. Schematic for experimental setup used for Fig. 2F-I. IgHEL/sHEL Tg chimeras were generated as in Fig 1C. Splenocytes from IgHEL/sHEL Tg chimeras and CD45.1 WT mice were loaded with the vital dye Cell Trace Violet (CTV) and combined 1:1. 5×10⁶ total splenocytes were adoptively co-transferred into either WT or sHEL Tg mice via I.V. injection. 2 days after adoptive transfer, mice were sacrificed, and spleens were harvested for surface marker analysis via flow cytometry. Donor cells were identified as CTV+, and IgHEL Tg and CD45.1 WT B cells were separated based on CD45.1 and CD45.2 expression. F. Representative plots shown. G. Nur77-eGFP MFI of CTV+, CD45.2+ and Nur77-eGFP+ B cells isolated from sHEL Tg+ and sHEL Tg- host mice, N=3 per group. H. IgMa MFI of adoptively transferred B cells, N=3 per group. I. Ratio of transferred IgHEL Tg cells compared to competitively transferred CD45.1 WT cells normalized to the input ratio. N=3 per group.
Figure 3.
Figure 3.. Nur77 limits survival of “naïve” B cells chronically exposed to their cognate antigen in vivo.
A. Schematic of experimental set up. Splenocytes from IgHEL Tg and WT CD45.1 mice were loaded with the vital dye Cell Trace Violet (CTV) and combined 1:1. 5×10⁶ total splenocytes were adoptively co-transferred into either WT or sHEL Tg hosts via I.V. injection. 3 days after adoptive transfer, mice were sacrificed, and spleens were harvested for surface marker analysis via flow cytometry. Donor cells were identified as CTV+, and IgHEL Tg and WT CD45.1 B cells were separated based on CD45.1 and CD45.2 staining. B. Representative plots shown. C. Ratio of transferred IgHEL Tg cells compared to competitively transferred CD45.1 WT cells normalized to the input ratio. N=3 per group. D. IgMa MFI of IgHEL Tg B cells recovered from adoptively transferred hosts. N=3 per group.
Figure 4.
Figure 4.. DNA-reactive reporter B cells upregulate Nur77-eGFP early during their development in VH3H9 Tg mice.
A. Schematic of relative autoreactivity amongst different light chain pairings in VH3H9 Tg B cells. B. Histograms represent Nur77-eGFP expression across B cell development in Vκ or Vλ B cells in either WT Nur77-eGFP or VH3H9 Tg Nur77-eGFP mice. Histograms are representative of at least 3 separate experiments. C-D. Quantification of Nur77-eGFP from histograms from Fig 4B. N=3 for each group. E-H. Quantification of IgM or IgD MFI across B cell development from Vκ or Vλ expressing B cells in either WT or VH3H9 Tg Nur77-eGFP mice. N=3 for each group. I. (Left) Histograms represent endogenous Nur77 protein expression in Vκ or Vλ expressing B cells from either WT or VH3H9 Tg mice. Histograms are representative of 3 different mice. (Right) Quantification of endogenous Nur77 MFI from histograms.
Figure 5.
Figure 5.. Nur77-eGFP expression correlates with counter-selection of self-reactive B cells in VH3H9 Tg mice.
A. Representative flow plots showing the relative sizes of developmental compartments containing Vκ or Vλ expressing splenic B cells in either WT or VH3H9 Tg Nur77-eGFP mice. Plots are representative of several experiments with at least N=3 mice per experiment. B. Splenic B cells from either WT or VH3H9 Tg mice were concurrently stained with an anti-pan Vλ and an anti-Vλ1 antibody to identify B cells expressing different Vλ light chains. B cells were also stained with surface markers to identify different developmental stages, and light chain usage across B cell development was charted. N=3 mice per group. % total Vλ1 p values: WT T1 vs Tg T1: ***; Tg T1 vs Tg T2/3: **; Tg T2/3 vs Tg FO: **. C. % total Vλ2/3 p values: Tg T1 vs Tg T2/3: ns; Tg 2/3 vs Tg FO: ***. D. Histograms represent Nur77-eGFP expression of B cells expressing various light chains in either WT or VH3H9 Tg Nur77-eGFP mice. E. Quantification of Nur77-eGFP MFI as shown in Fig 5D. N=3 mice per group. F. Splenic B cells were stained IgMb to identify B cells expressing the endogenous HC VH3H9 Tg mice. N=3 mice per group. % total VH3H9 Tg/ Vλ T1 vs CD23+ p value: ****; % total endogenous HC/ Vκ T1 vs CD23+ p value: **. G. Quantification of the Nur77-eGFP MFI of B cell subsets identified in F. N=3 mice per group.
Figure 6.
Figure 6.. Nur77-eGFP expression correlates with B cell anergy in VH3H9 Tg mice.
Splenic B cells from WT and VH3H9 Tg Nur77-eGFP mice were loaded with Indo-1 dye. Ratiometric assessment of intracellular calcium was determined by flow cytometry. Samples were run for 30 seconds to assess basal calcium flux, and then anti-IgM was added to stimulate the cells. A. Spleens were harvested from WT or VH3H9 transgenic Nur77-eGFP mice, and intracellular calcium entry was assessed after stimulation with 10 μg/mL anti-IgM. Data is representative of at least 3 independent experiments. B. Intracellular calcium entry was assessed as in Fig 6A. A narrow IgM gate was drawn to assess intracellular calcium entry on cells with matched IgM levels. Data is representative of at least 3 independent experiments. C. Splenic B cells from WT or VH3H9 transgenic Nur77-eGFP mice were harvested, and intracellular calcium entry was assessed after stimulation with 5 μg/mL anti-IgM. The top and bottom 10% Nur77-eGFP expressing cells were gated as GFP-high and GFP low respectively. Data is representative of at least 3 independent experiments. D. Spleens from Nur77-eGFP VH3H9 Tg+ and Tg- mice were stimulated at 37° with 10 μg/mL IgM for 10 minutes. Phosphorylated ERK expression was determined via intracellular flow cytometry staining. N=5 for each group. E. Spleens from Nur77-eGFP VH3H9 Tg+ and Tg- mice were stimulated at 37° with 10 μg/mL anti-IgM for 45 minutes. Phosphorylated S6 expression was determined via intracellular flow cytometry staining. N=5 for each group
Figure 7.
Figure 7.. Nur77 is dispensable for editing, deletion, IgM downregulation and anergy in VH3H9 Tg mice.
A-B. Spleens were harvested from Nr4a1+/+ and Nr4a1−/− VH3H9 Tg mice as well as WT mice. Splenic developmental subsets and Vλ usage was determined through flow cytometry. N=3 for each group C. Non-transgenic and VH3H9 Tg mice were fed BrdU-laced water for 6 days. Spleens and lymph nodes were harvested for flow cytometry analysis. N=3 mice for each group. D. Spleens were harvested from WT, Nr4a1+/+ VH3H9 Tg and Nr4a1−/− VH3H9 Tg mice and stained for flow cytometry analysis. IgM and IgD MFI on Vκ and Vλ expressing B cells was quantified. N=3 for each group. E. Splenic B cells from WT, Nr4a1+/+ and Nr4a1−/− mice were loaded with Indo-1 dye. Ratiometric assessment of intracellular calcium was determined by flow cytometry following stimulation with 10 μg/mL anti-IgM. Plots are representative of 3 independent experiments. F. Representative spleen sections depicting localization of Vλ1 B cells in Nr4a1+/+ or Nr4a1−/− mice with or without the VH3H9 Tg. Data are representative of two independent mice of each of four conditions.
Figure 8.
Figure 8.. Nur77 limits survival of DNA-reactive mature B cells in vitro and in vivo, and maintains tolerance in VH3H9 Tg mice.
A-D. Lymph nodes were harvested from Nr4a1+/+ and Nr4a1−/− VH3H9 Tg mice, and mixed 1:1 with lymph nodes from WT CD45.1 mice. 5×10⁶ total cells were incubated for up to 3 days with either media alone or 10 μg/mL anti-IgM stim, in the absence or presence of 20 ng/mL BAFF. The ratio of VH3H9 Tg B cells to WT CD45.1 B cells was calculated and normalized to the input ratio at Day 0. N=3 for each group E-F. Mixed bone marrow chimeras were generated by reconstituting lethally irradiated IgHa WT mice with either Nr4a1−/− or Nr4a1+/+ CD45.2 bone marrow mixed 1:1 with WT CD45.1 bone marrow. 13 weeks after reconstitution, lymph nodes were harvested from the chimeras, and incubated with either media alone or 5 μg/mL anti-IgM for up to 75 hours. Donor cells were separated from host cells via expression of IgHa, and the ratio of CD45.2 to CD45.1 cells was calculated and normalized to the ratio of transferred bone marrow cells. N=5 for each group G. Spleens were harvested from either Nr4a1+/+ or Nr4a1−/− VH3H9 Tg mice, and total B cell numbers were determined. N ≥ 13 for each group. H. Vλ usage was determined in Nr4a1+/+ and Nr4a1−/− VH3H9 Tg mice via flow cytometry. N ≥ 3 for each group. I-J. Serum was collected from 14-week Nr4a1+/+ and Nr4a1−/− VH3H9 Tg mice via tail bleed, and both total IgG titer and relative anti-dsDNA IgG titer was determined via ELISA. N ≥ 10 for each group.

References

    1. Wardemann H, Yurasov S, Schaefer A, Young JW, Meffre E, and Nussenzweig MC. 2003. Predominant autoantibody production by early human B cell precursors. Science 301: 1374–1377. - PubMed
    1. Nemazee D 2017. Mechanisms of central tolerance for B cells. Nat Rev Immunol 17: 281–294. - PMC - PubMed
    1. Cambier JC, Gauld SB, Merrell KT, and Vilen BJ. 2007. B-cell anergy: from transgenic models to naturally occurring anergic B cells? Nat Rev Immunol 7: 633–643. - PMC - PubMed
    1. Lesley R, Xu Y, Kalled SL, Hess DM, Schwab SR, Shu H-B, and Cyster JG. 2004. Reduced competitiveness of autoantigen-engaged B cells due to increased dependence on BAFF. Immunity 20: 441–453. - PubMed
    1. Thien M, Phan TG, Gardam S, Amesbury M, Basten A, Mackay F, and Brink R. 2004. Excess BAFF Rescues Self-Reactive B Cells from Peripheral Deletion and Allows Them to Enter Forbidden Follicular and Marginal Zone Niches. Immunity 20: 785–798. - PubMed

Publication types

MeSH terms

Substances