

Neutralization of BCL-2/XL Enhances the Cytotoxicity of T-DM1 In Vivo
- PMID: 30962322
- PMCID: PMC6758547
- DOI: 10.1158/1535-7163.MCT-18-0743
Neutralization of BCL-2/XL Enhances the Cytotoxicity of T-DM1 In Vivo
Abstract
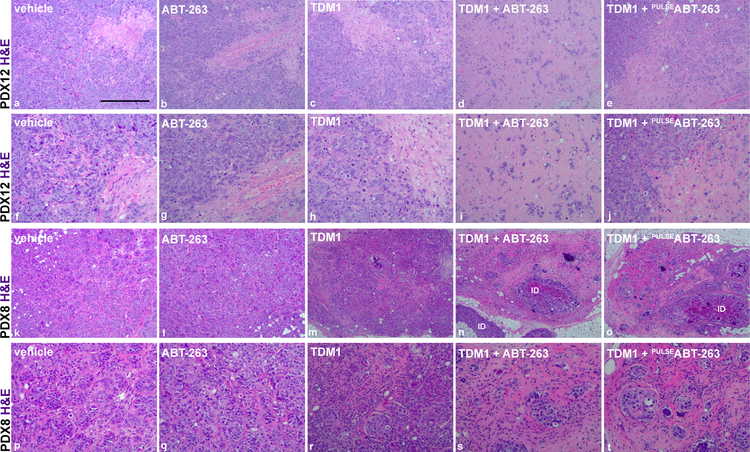
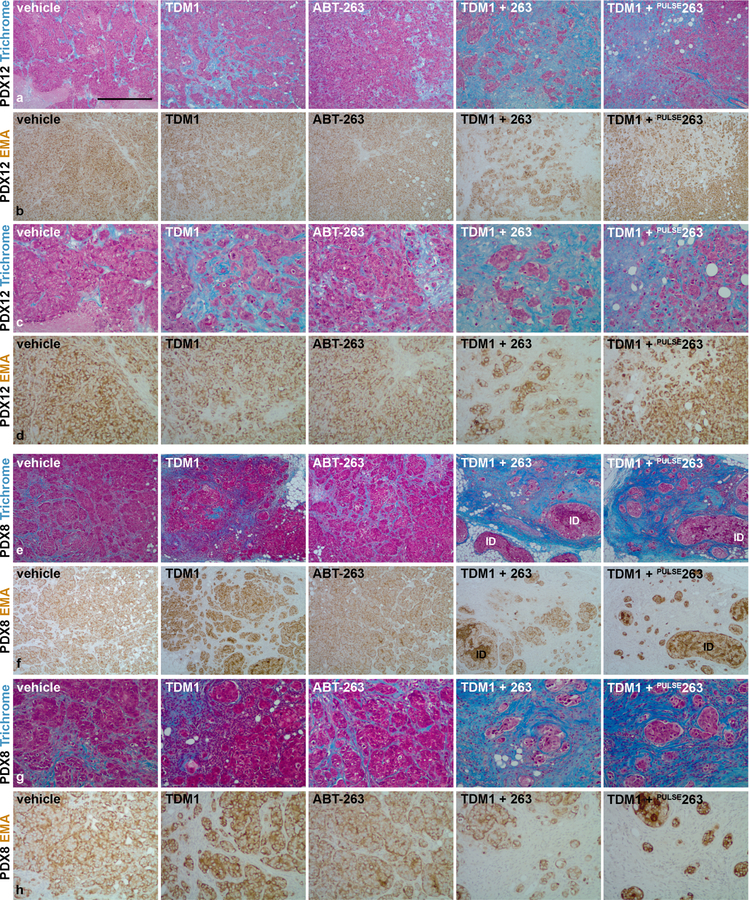
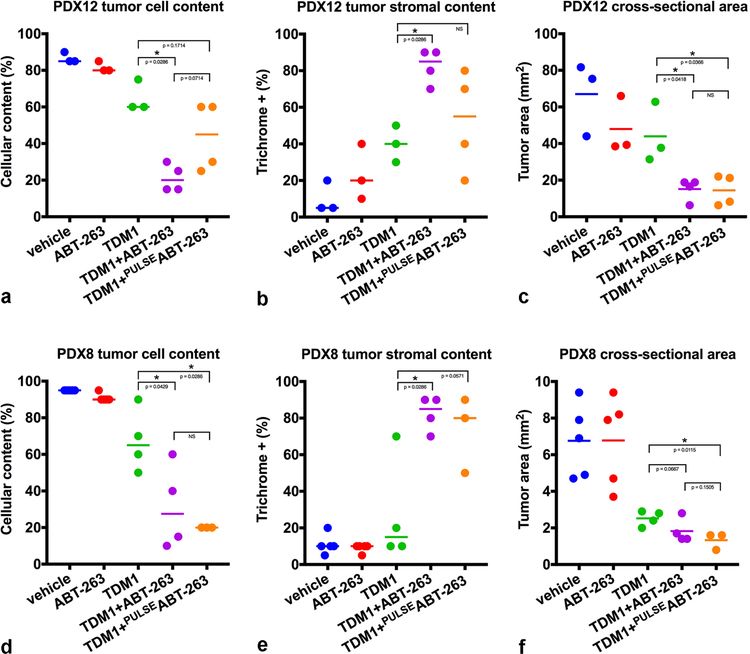
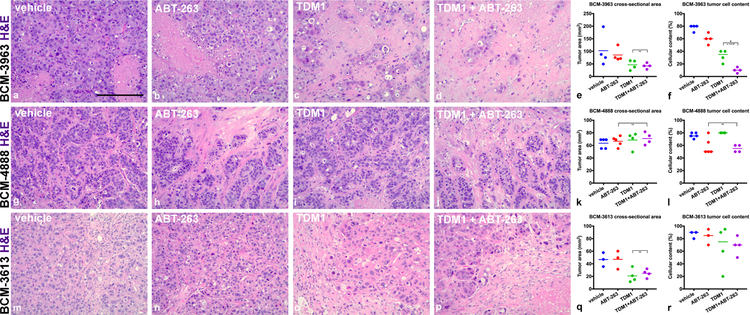
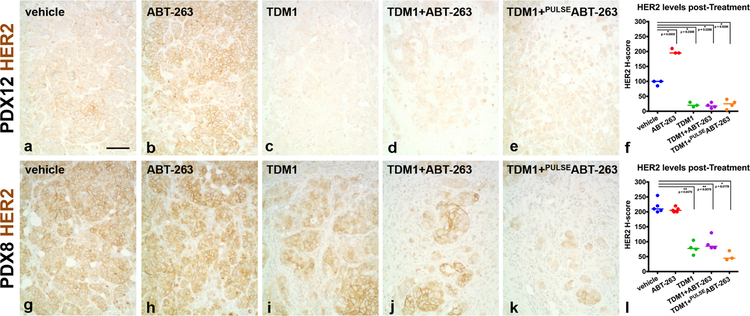
One of the most recent advances in the treatment of HER2+ breast cancer is the development of the antibody-drug conjugate, T-DM1. T-DM1 has proven clinical benefits for patients with advanced and/or metastatic breast cancer who have progressed on prior HER2-targeted therapies. However, T-DM1 resistance ultimately occurs and represents a major obstacle in the effective treatment of this disease. Because anti-apoptotic BCL-2 family proteins can affect the threshold for induction of apoptosis and thus limit the effectiveness of the chemotherapeutic payload, we examined whether inhibition of BCL-2/XL would enhance the efficacy of T-DM1 in five HER2-expressing patient-derived breast cancer xenograft models. Inhibition of BCL-2/XL via navitoclax/ABT-263 significantly enhanced the cytotoxicity of T-DM1 in two of three models derived from advanced and treatment-exposed metastatic breast tumors. No additive effects of combined treatment were observed in the third metastatic tumor model, which was highly sensitive to T-DM1, as well as a primary treatment-exposed tumor, which was refractory to T-DM1. A fifth model, derived from a treatment naïve primary breast tumor, was sensitive to T-DM1 but markedly benefited from combination treatment. Notably, both PDXs that were highly responsive to the combination therapy expressed low HER2 protein levels and lacked ERBB2 amplification, suggesting that BCL-2/XL inhibition can enhance sensitivity of tumors with low HER2 expression. Toxicities associated with combined treatments were significantly ameliorated with intermittent ABT-263 dosing. Taken together, these studies provide evidence that T-DM1 cytotoxicity could be significantly enhanced via BCL-2/XL blockade and support clinical investigation of this combination beyond ERBB2-amplified and/or HER2-overexpressed tumors.
©2019 American Association for Cancer Research.
Conflict of interest statement
Figures

Similar articles
-
Navitoclax enhances the effectiveness of EGFR-targeted antibody-drug conjugates in PDX models of EGFR-expressing triple-negative breast cancer.Breast Cancer Res. 2020 Nov 30;22(1):132. doi: 10.1186/s13058-020-01374-8. Breast Cancer Res. 2020. PMID: 33256808 Free PMC article.
-
ARX788, a novel anti-HER2 antibody-drug conjugate, shows anti-tumor effects in preclinical models of trastuzumab emtansine-resistant HER2-positive breast cancer and gastric cancer.Cancer Lett. 2020 Mar 31;473:156-163. doi: 10.1016/j.canlet.2019.12.037. Epub 2020 Jan 2. Cancer Lett. 2020. PMID: 31904483
-
A Novel Anti-HER2 Antibody-Drug Conjugate XMT-1522 for HER2-Positive Breast and Gastric Cancers Resistant to Trastuzumab Emtansine.Mol Cancer Ther. 2019 Oct;18(10):1721-1730. doi: 10.1158/1535-7163.MCT-19-0207. Epub 2019 Jul 10. Mol Cancer Ther. 2019. PMID: 31292166
-
HER2-Overexpressing/Amplified Breast Cancer as a Testing Ground for Antibody-Drug Conjugate Drug Development in Solid Tumors.Clin Cancer Res. 2020 Feb 15;26(4):775-786. doi: 10.1158/1078-0432.CCR-18-1976. Epub 2019 Oct 3. Clin Cancer Res. 2020. PMID: 31582515 Review.
-
Mechanisms of resistance to trastuzumab emtansine (T-DM1) in HER2-positive breast cancer.Br J Cancer. 2020 Mar;122(5):603-612. doi: 10.1038/s41416-019-0635-y. Epub 2019 Dec 16. Br J Cancer. 2020. PMID: 31839676 Free PMC article. Review.
Cited by
-
Targeting Mitochondria with ClpP Agonists as a Novel Therapeutic Opportunity in Breast Cancer.Cancers (Basel). 2023 Mar 23;15(7):1936. doi: 10.3390/cancers15071936. Cancers (Basel). 2023. PMID: 37046596 Free PMC article. Review.
-
Therapeutic efficacy of a MMAE-based anti-DR5 drug conjugate Oba01 in preclinical models of pancreatic cancer.Cell Death Dis. 2023 Apr 29;14(4):295. doi: 10.1038/s41419-023-05820-1. Cell Death Dis. 2023. PMID: 37120688 Free PMC article.
-
The Biological Roles and Clinical Applications of the PI3K/AKT Pathway in Targeted Therapy Resistance in HER2-Positive Breast Cancer: A Comprehensive Review.Int J Mol Sci. 2024 Dec 13;25(24):13376. doi: 10.3390/ijms252413376. Int J Mol Sci. 2024. PMID: 39769140 Free PMC article. Review.
-
Novel ADCs and Strategies to Overcome Resistance to Anti-HER2 ADCs.Cancers (Basel). 2021 Dec 29;14(1):154. doi: 10.3390/cancers14010154. Cancers (Basel). 2021. PMID: 35008318 Free PMC article. Review.
-
Resistance to antibody-drug conjugates in breast cancer: mechanisms and solutions.Cancer Commun (Lond). 2023 Mar;43(3):297-337. doi: 10.1002/cac2.12387. Epub 2022 Nov 10. Cancer Commun (Lond). 2023. PMID: 36357174 Free PMC article. Review.
References
Publication types
MeSH terms
Substances
Grants and funding
LinkOut - more resources
Full Text Sources
Other Literature Sources
Medical
Research Materials
Miscellaneous
