

Defining the RNA interactome by total RNA-associated protein purification
- PMID: 30962360
- PMCID: PMC6452921
- DOI: 10.15252/msb.20188689
Defining the RNA interactome by total RNA-associated protein purification
Abstract
The RNA binding proteome (RBPome) was previously investigated using UV crosslinking and purification of poly(A)-associated proteins. However, most cellular transcripts are not polyadenylated. We therefore developed total RNA-associated protein purification (TRAPP) based on 254 nm UV crosslinking and purification of all RNA-protein complexes using silica beads. In a variant approach (PAR-TRAPP), RNAs were labelled with 4-thiouracil prior to 350 nm crosslinking. PAR-TRAPP in yeast identified hundreds of RNA binding proteins, strongly enriched for canonical RBPs. In comparison, TRAPP identified many more proteins not expected to bind RNA, and this correlated strongly with protein abundance. Comparing TRAPP in yeast and E. coli showed apparent conservation of RNA binding by metabolic enzymes. Illustrating the value of total RBP purification, we discovered that the glycolytic enzyme enolase interacts with tRNAs. Exploiting PAR-TRAPP to determine the effects of brief exposure to weak acid stress revealed specific changes in late 60S ribosome biogenesis. Furthermore, we identified the precise sites of crosslinking for hundreds of RNA-peptide conjugates, using iTRAPP, providing insights into potential regulation. We conclude that TRAPP is a widely applicable tool for RBPome characterization.
Keywords: RNA binding sites; mass spectrometry; phase separation; protein–RNA interaction; yeast.
© 2019 The Authors. Published under the terms of the CC BY 4.0 license.
Conflict of interest statement
The authors declare that they have no conflict of interest.
Figures
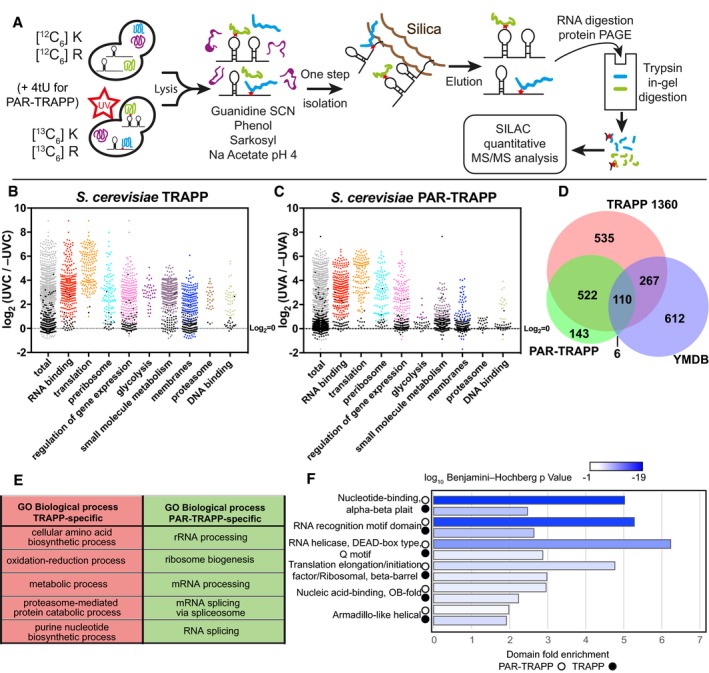
TRAPP and PAR‐TRAPP workflows used to identify RNA‐interacting proteins with SILAC MS‐MS. See the main text for details.
Scatter plot of Log2 SILAC ratios +UVC/−UVC (1,360 mJ cm−2) for Saccharomyces cerevisiae proteins, quantified with TRAPP. Proteins were subdivided based on the indicated GO term categories. Proteins belonging to GO terms “membrane” and “DNA binding” do not contain proteins mapping to GO terms “RNA metabolic process”, “RNA binding”, “ribonucleoprotein complex”. Black dots represent proteins that failed to pass statistical significance cut‐off (P‐value adjusted < 0.05).
Scatter plot of Log2 SILAC ratios +UVA/−UVA for S. cerevisiae proteins, quantified with PAR‐TRAPP. Proteins were subdivided based on the indicated GO term categories. Proteins belonging to GO terms “small molecule metabolism”, “membrane” and “DNA binding” do not contain proteins mapping to GO terms “RNA metabolic process”, “RNA binding”, “ribonucleoprotein complex”. Black dots represent proteins that failed to pass statistical significance cut‐off (P‐value adjusted < 0.05). See Methods and Protocols for calculation of significance.
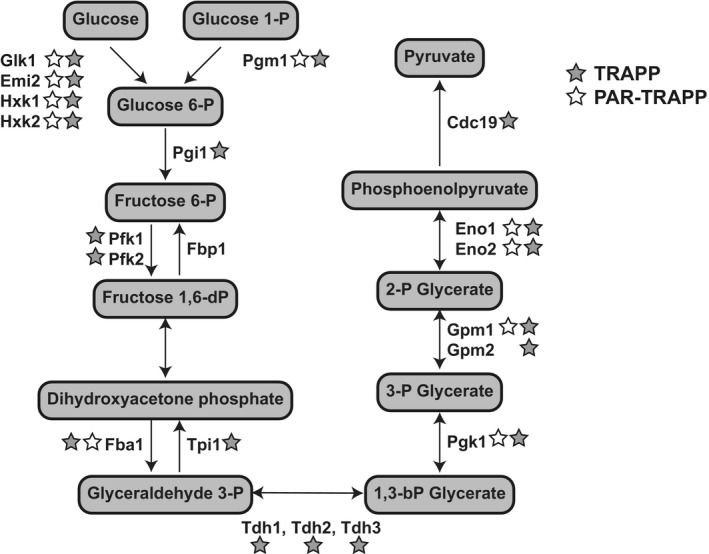
Venn diagram showing the overlap between proteins identified in TRAPP and PAR‐TRAPP and proteins of intermediary metabolism annotated in the yeast metabolome database (YMDB).
5 most enriched GO terms amongst proteins identified only in TRAPP or exclusively in PAR‐TRAPP.
6 most significantly enriched domains (lowest P‐value) in PAR‐TRAPP‐identified proteins were selected if the same domain was enriched amongst TRAPP‐identified proteins. Domain fold enrichment in the recovered proteins is plotted on the x‐axis, while colour indicates log10 Benjamini–Hochberg adjusted P‐value.
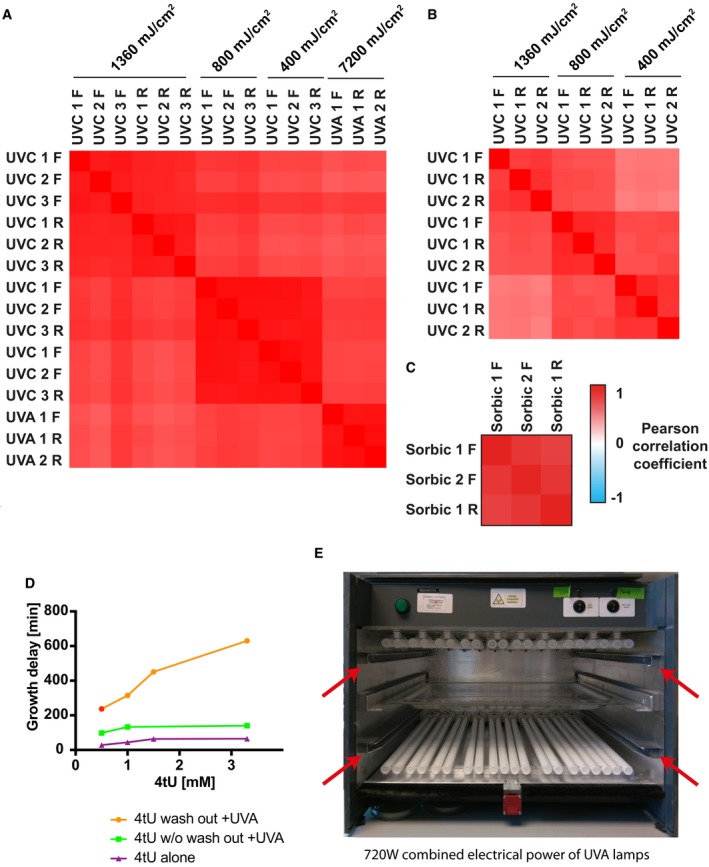
Pairwise Pearson correlation coefficients for protein Log2 +UV/−UV ratios obtained in S. cerevisiae with TRAPP and PAR‐TRAPP experiments. Forward isotopic labelling and reverse isotopic labelling are indicated as “FWD” and “RV”, respectively.
Data for Escherichia coli 1 forward and 2 reverse labelling TRAPP repeats were processed as in (A).
The analysis of S. cerevisiae forward and reverse PAR‐TRAPP experiments upon sorbic acid exposure performed as in (A).
Effect of 4tU and UVA treatments on the growth of yeast cells. Exponentially growing yeast cells were treated for 2 h with 4‐thiouracil at the indicated concentrations. The cultures were then irradiated with 350 nm UVA light in the eBox for 30 s delivering 5.8 J cm−2. The lag time of treated cultures was measured by monitoring samples growth curve with Tecan sunrise instrument. Samples: “4tU wash out +UVA”—growth delay of 4‐thiouracil‐treated UVA‐irradiated cells, compared to UVA‐exposed sample. 4tU was removed prior to irradiation; “4tU w/o wash out +UVA”—As sample 1, but 4tU persisted in the media while cells were irradiated; “4tU alone”—growth delay of cells treated with 4tU for 2 h as compared to untreated cells without irradiation.
Frontal view on the eBox irradiation apparatus. The frontal door and the shutters are not present on the picture. Red arrows indicate rails for shutters, designed to prevent sample exposure to UV light, while the lamps are warming up for stable UVA output. The UVA transparent sample tray made of borosilicate glass is placed between the two UVA lamp banks.
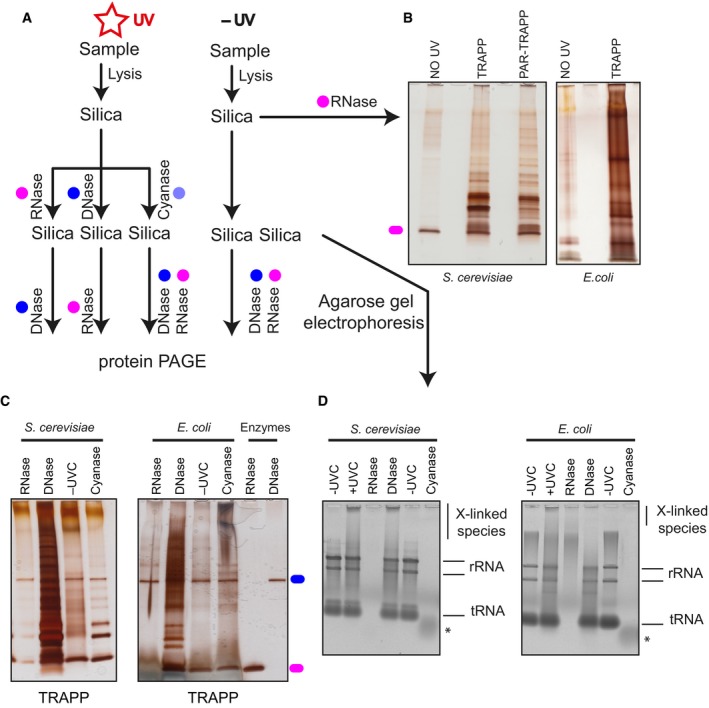
The experimental set‐up indicating the stages when samples are collected. Coloured circles designate treatment with the indicated enzyme.
Samples are purified following the TRAPP protocol as described in Materials and Methods. After RNase A and RNase T1 treatment to degrade the co‐purifying RNA, sample was resolved on polyacrylamide gel and silver staining was performed.
TRAPP‐purified samples were treated with the indicated enzymes and loaded onto silica once again. After elution, nucleic acids were resolved with agarose gel electrophoresis (see Fig EV2D), while the remainder of the sample was treated with the indicated enzyme followed by polyacrylamide gel electrophoresis and silver staining.
Same as in (C), but the samples were collected before the second nuclease treatment and were then resolved on a SYBR Safe stained agarose gel. * denotes residual nucleic acid species in the cyanase‐treated sample.
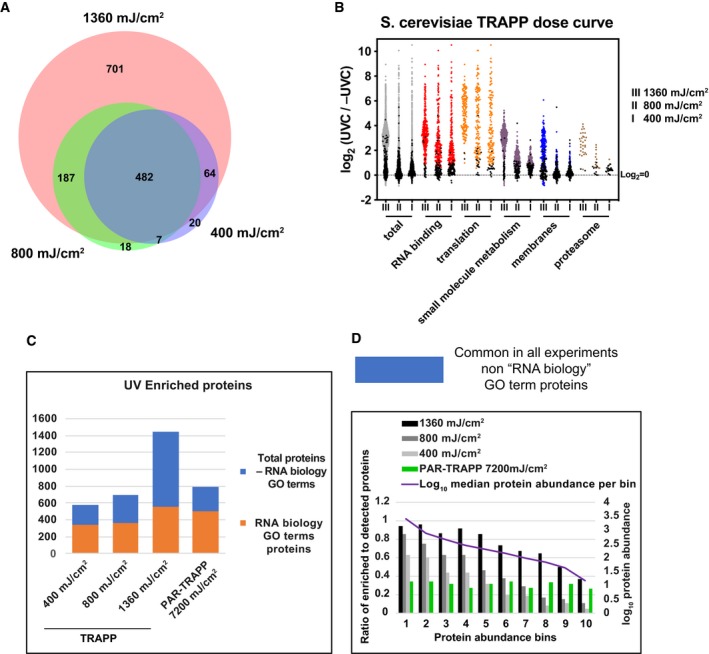
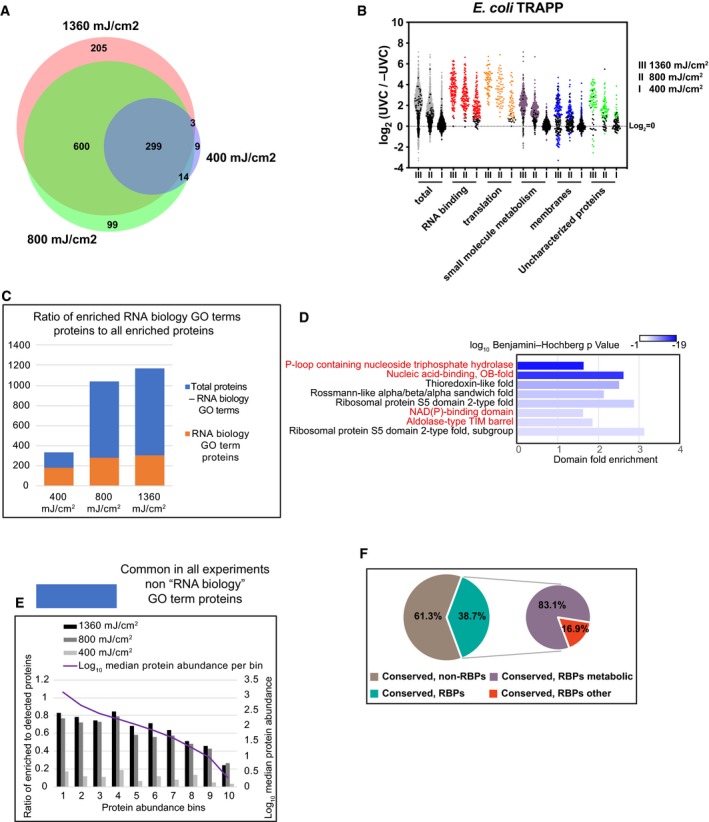
Venn diagram showing the overlap between proteins identified in TRAPP using the indicated UVC irradiation regime.
Scatter plot of Log2 SILAC ratios +UVC/−UVC (for the indicated UV doses) for S. cerevisiae proteins, quantified with TRAPP. Proteins were subdivided based on the indicated GO term categories. Proteins, belonging to GO terms “membrane” and “small molecule metabolism” do not contain proteins mapping to GO terms “RNA metabolic process”, “RNA binding”, “ribonucleoprotein complex”. Black dots represent proteins that failed to pass statistical significance cut‐off (P‐value adjusted < 0.05).
Proteins, identified in TRAPP and PAR‐TRAPP were subdivided into 2 categories: “RNA biology” proteins (GO terms “RNA metabolic process”, “RNA binding”, “ribonucleoprotein complex”) (orange bars); Proteins, not classified with either of the 3 GO terms above (blue bars). Numbers of proteins in each category are plotted per experiment.
Proteins quantified in both TRAPP and PAR‐TRAPP were filtered to remove proteins annotated with GO terms “RNA metabolic process”, “RNA binding”, “ribonucleoprotein complex” (blue bars in Fig 2C). The remaining proteins were split into 10 bins by abundance (see Materials and Methods). For each bin, the ratio between enriched to detected proteins was calculated as well as median protein abundance as reported by PaxDb.
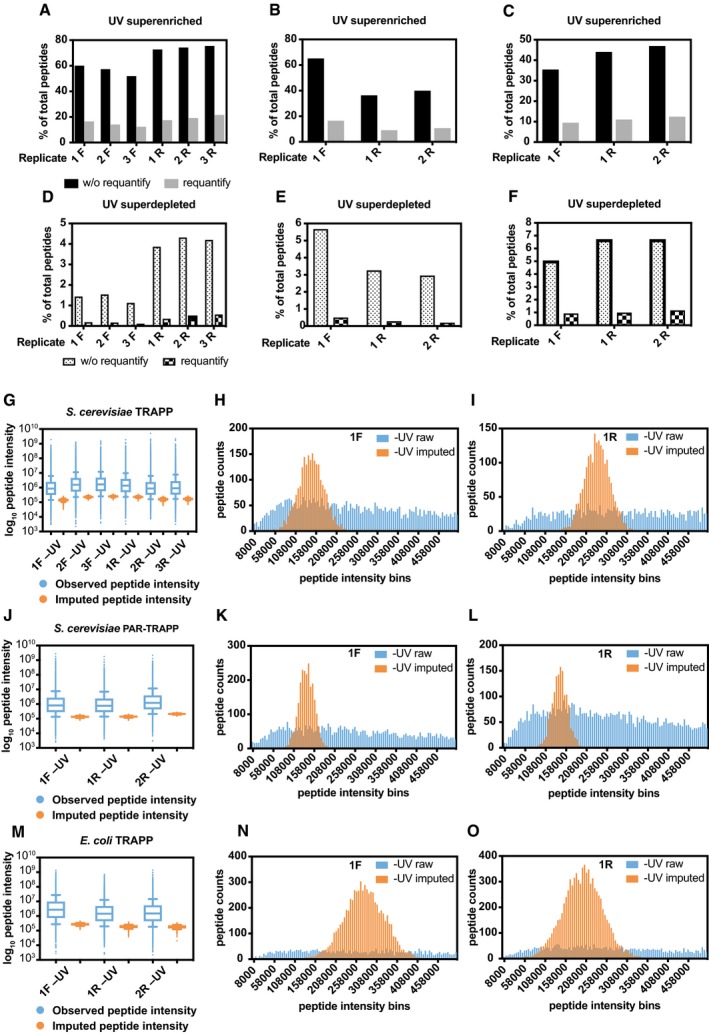
The percentage of peptides with reported intensity in +UV sample, but not in −UV sample (superenriched peptides) by MaxQuant in Saccharomyces cerevisiae TRAPP (at 1,360 mJ cm−2) SILAC quantification experiments without (black bars) or with (grey bars) “requantify” option enabled. 3 biological repeats had light‐labelled cells UV irradiated (1F, 2F,3F), while three other repeats (1R, 2R, 3R) had heavy‐labelled cells UV irradiated.
The data of S. cerevisiae PAR‐TRAPP experiments were analysed the same way as in (A).
The data of E. coli TRAPP experiments were analysed the same way as in (A), except the 2 biological repeats, which had light‐labelled cells UV irradiated, were labelled 1R and 2R.
The percentage of peptides with reported intensity in −UV sample, but not in +UV sample (superdepleted peptides) by MaxQuant in S. cerevisiae TRAPP (at 1,360 mJ cm−2) without (dotted) or with (chequered) “requantify” option enabled. Sample labelling as in (A).
The data of S. cerevisiae PAR‐TRAPP experiments were analysed the same way as in (D).
The data of E. coli TRAPP (at 1,360 mJ cm−2) experiments were analysed the same way as in (D), sample labelling was as in panel (C).
Box plot of Log10 peptide intensity of −UV peptides from S. cerevisiae TRAPP (at 1,360 mJ cm−2) (blue) samples (labelling as in (A)), plotted together with Log10 peptide intensity values imputed by imputeLCMD R package for −UV samples (orange). Box represents values between 25th and 75th percentiles, while whiskers represent 10th and 90th percentiles. All other data are represented as points below or above 10th or 90th percentiles, respectively. Line inside the box shows median value.
Histogram of peptide intensity frequency obtained from −UV sample (1F), plotted for intensities from 0 to 5 × 10⁵ units. Colour labelling is as in (G).
Same as panel (H), performed for sample 1R which had reversed SILAC labelling, compared to the sample analysed in panel (H).
Box plot of Log10 peptide intensity of −UV peptides from S. cerevisiae PAR‐TRAPP (blue) samples (labelling as in (B)), plotted together with Log10 peptide intensity values imputed by imputeLCMD R package for −UV samples (orange).
Histogram of peptide intensity frequency obtained from −UV sample (1F), plotted for intensities from 0 to 5 × 10⁵ units. Colour labelling is as in (J).
Same analysis as panel (K), performed for sample 1R which had reversed SILAC labelling, compared to the sample analysed in panel (K).
Box plot of Log10 peptide intensity of −UV peptides from E. coli TRAPP (at 1,360 mJ cm−2) (blue) samples (labelling as in (C)), plotted together with Log10 peptide intensity values imputed by imputeLCMD R package for −UV samples (orange).
Histogram of peptide intensity frequency obtained from −UV sample (1F), plotted for intensities from 0 to 5 × 10⁵ units. Colour labelling is as in (M).
Same analysis as panel (N), performed for sample 1R which had reversed SILAC labelling, compared to the sample analysed in panel (N).
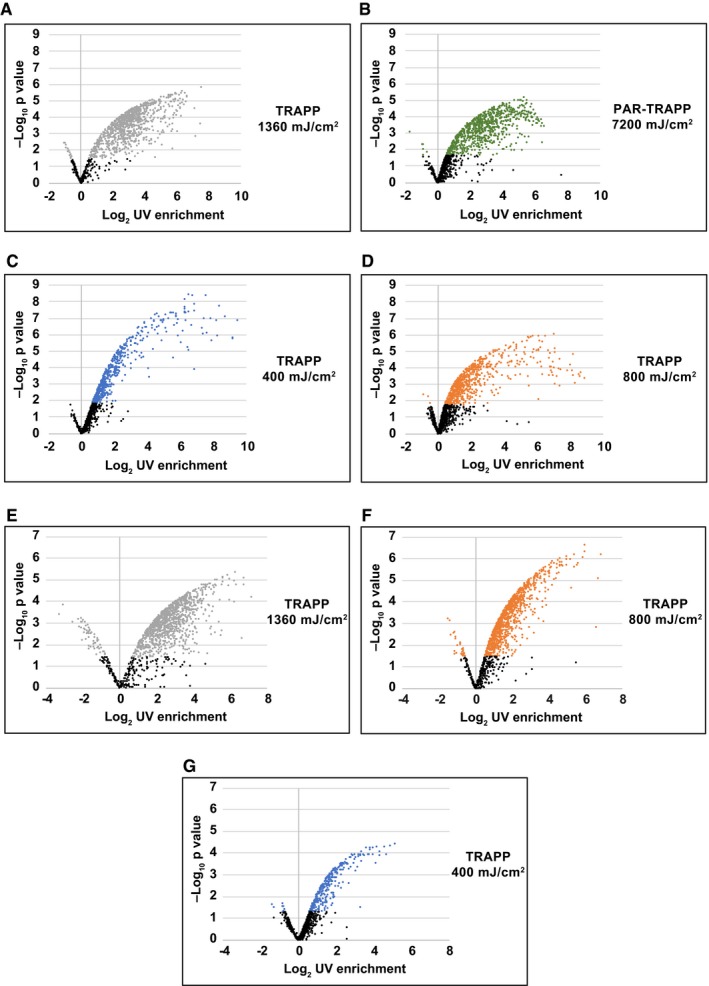
- A–G
Volcano plot showing Log2 UV fold enrichment plotted against – Log10 per protein for the following experiments: (A) Saccharomyces cerevisiae TRAPP at 1,360 mJ cm−2; (B) S. cerevisiae PAR‐TRAPP at 7.2 J cm−2; (C) S. cerevisiae TRAPP at 400 mJ cm−2; (D) S. cerevisiae TRAPP at 800 mJ cm−2; (E) E. coli TRAPP at 1,360 mJ cm−2; (F) E. coli TRAPP at 800 mJ cm−2; (G) E. coli TRAPP at 400 mJ cm−2.
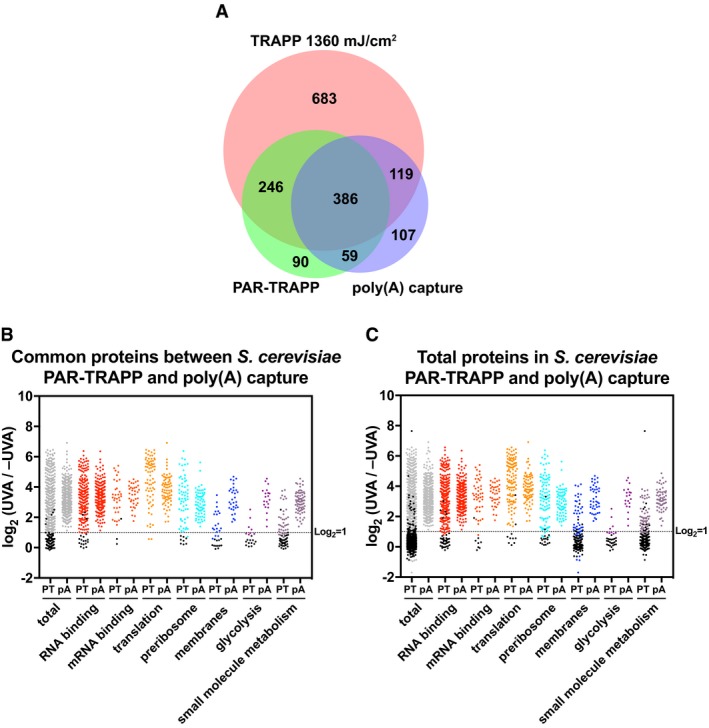
Venn diagram showing the overlap between proteins identified in PAR‐TRAPP, poly(A) capture and TRAPP.
Scatter plot of Log2 PAR‐TRAPP SILAC ratios +UVA/−UVA for Saccharomyces cerevisiae proteins and Log2 +UVA/−UVA fold enrichment for poly(A) capture technique. Only proteins identified in both methods as RBPs are shown. Proteins were subdivided based on the indicated GO term categories. Proteins belonging to GO terms “membrane” and “small molecule metabolism” do not contain proteins mapping to GO terms “RNA metabolic process”, “RNA binding”, “ribonucleoprotein complex”. Black dots represent proteins that failed to pass statistical significance cut‐off (P‐value adjusted < 0.05).
Scatter plot of Log2 SILAC ratios +UVA/−UVA for all S. cerevisiae proteins identified in PAR‐TRAPP plotted together with Log2 +UVA/−UVA fold enrichment for all proteins, reported as RBPs in poly(A) capture technique. Labelling is as in panel (B).
Venn diagram showing the overlap between proteins identified in TRAPP using the indicated UVC irradiation regime.
Scatter plot of Log2 SILAC ratios +UVC/−UVC for E. coli proteins, quantified with TRAPP. Proteins were subdivided based on the indicated GO term categories. Proteins belonging to GO terms “membrane” and “small molecule metabolism” do not contain proteins mapping to GO terms “RNA metabolic process”, “RNA binding”, “ribonucleoprotein complex”. Black dots represent proteins that failed to pass statistical significance cut‐off (P‐value adjusted < 0.05).
Proteins, identified in E. coli TRAPP, were subdivided into two categories: “RNA biology” proteins (GO terms “RNA metabolic process”, “RNA binding”, “ribonucleoprotein complex”) (orange bars); Proteins, not classified with either of the 3 GO terms above (blue bars). Numbers of proteins in each category are plotted per experiment.
Most significantly enriched protein domains (lowest P‐value) in E. coli TRAPP‐identified proteins at 1,360 mJ cm−2. Fold enrichment of the indicated domain amongst the recovered proteins is plotted on the x‐axis, while colour indicates log10 Benjamini–Hochberg adjusted P‐value. Domains found enriched in the yeast TRAPP data (at 1,360 mJ cm−2) are labelled with red colour.
Proteins quantified in all of the E. coli TRAPP experiments were filtered to remove proteins annotated with GO terms “RNA metabolic process”, “RNA binding”, “ribonucleoprotein complex” (blue bars in Fig 4C). The remaining proteins were split into 10 bins by abundance (see Materials and Methods). For each bin, the ratio between enriched to detected proteins was calculated as well as median protein abundance as reported by PaxDb.
Pie chart of Inparanoid 8.0 database orthologous clusters between S. cerevisiae and E. coli. For a cluster to be labelled as conserved RNA interacting (“conserved, RBPs”), it was required to contain at least one bacterial and one yeast protein enriched in TRAPP (at 1,360 mJ cm−2). “Conserved, RBPs metabolic” are clusters where at least one protein in yeast or bacteria is identified in the YMDB or in ECMDB databases, respectively (see Materials and Methods).
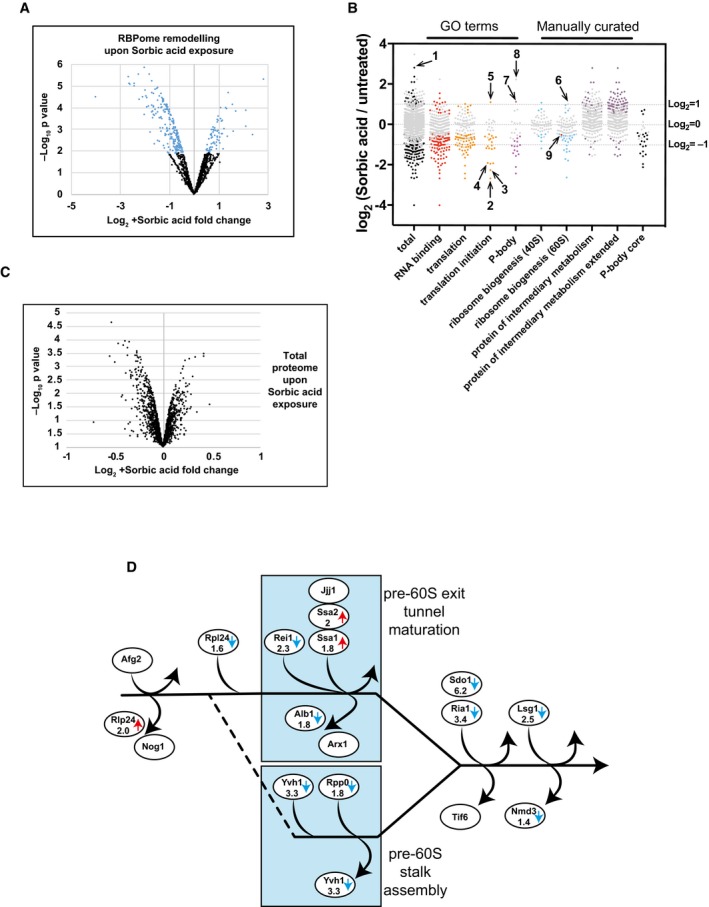
Volcano plot showing Log2 protein abundance fold change in RBPome plotted against – Log10 P‐value. Black points represent proteins showing no statistically significant change upon sorbic acid exposure in PAR‐TRAPP, while proteins changing significantly (P‐value adjusted < 0.05) are labelled with blue. Only proteins observed as RNA interacting in PAR‐TRAPP were included in the analysis.
Scatter plot of Log2 SILAC ratios +Sorbic/−Sorbic for Saccharomyces cerevisiae proteins, quantified with PAR‐TRAPP. Grey points represent proteins showing no statistically significant change upon sorbic acid exposure in PAR‐TRAPP, while proteins changing significantly (P‐value adjusted < 0.05) are labelled with other colours. Only proteins observed as RNA interacting in PAR‐TRAPP were included in the analysis, except for proteins in the category “protein of intermediary metabolism extended”, for which this criterion was dropped. Proteins annotated with GO term categories “RNA binding”, “translation”, “translation initiation”, “P‐body” and “small molecule metabolism” are displayed together with proteins annotated in literature‐curated lists: “ribosome biogenesis 40S”, “ribosome biogenesis 60S” (Woolford & Baserga, 2013). Proteins belonging to categories “protein of intermediary metabolism” and “protein of intermediary metabolism extended” are yeast enzymes and transporters of intermediary metabolism, obtained from YMDB and further filtered to remove aminoacyl‐tRNA synthetases. “P‐body core” category contains proteins identified as core components of P‐bodies in yeast (Buchan et al, 2010). Numbers label the following protein on the chart: 1 – Rtc3; 2 – Tif3; 3 – Rpg1; 4 – Tif35; 5 – Gcd11; 6 – Rlp24; 7 – Ssd1; 8 – Rbp7; 9 – Nmd3.
Volcano plot showing Log2 fold change in protein abundance upon sorbic acid exposure plotted against – Log10 P‐value. Black points represent proteins showing no statistically significant change in abundance upon sorbic acid exposure (P‐value adjusted > 0.05).
The cytoplasmic phase of large subunit maturation in yeast (Lo et al, 2010). Proteins altered in abundance in PAR‐TRAPP data upon sorbic acid exposure are indicated with arrows. Blue arrow denotes decrease, while red arrows indicate increase in PAR‐TRAPP recovery upon stress. For proteins passing the statistical significance cut‐off (P‐value adjusted < 0.05), fold change is indicated.
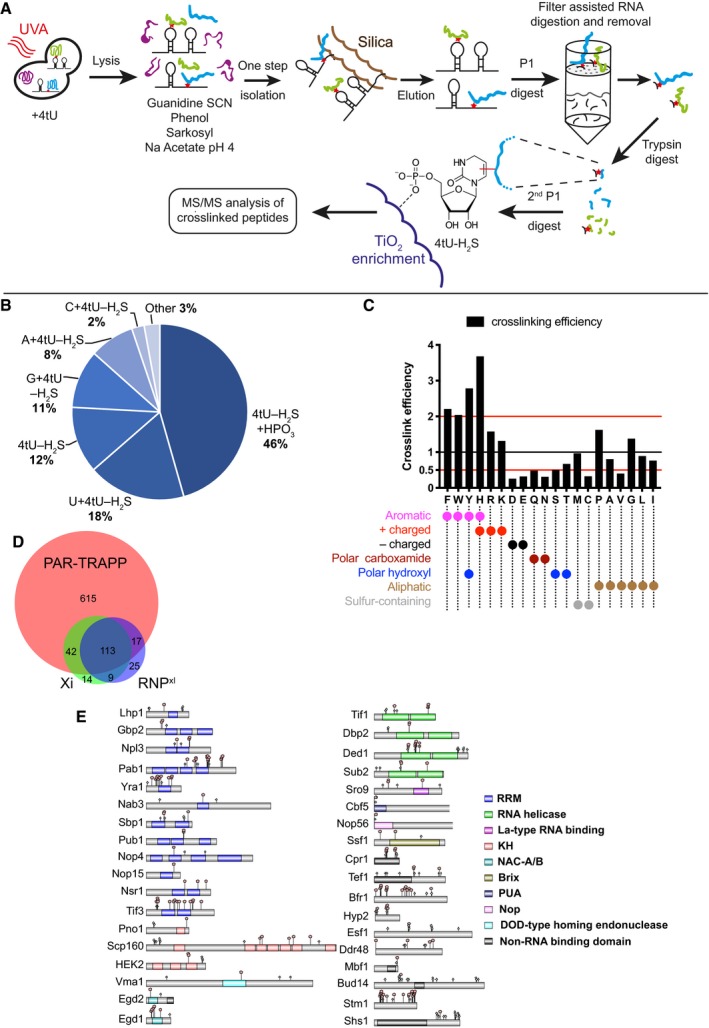
iTRAPP workflow to directly observe crosslinked RNA–peptides species by mass spectrometry. See the main text for details.
Pie chart of RNA species observed crosslinked to peptides by the Xi search engine.
The analysis of amino acids, reported as crosslinked by the Xi search engine. Amino acids are represented by single letter IUPAC codes. Black bars—crosslink efficiency, defined as ratio between the frequency of the crosslinked amino acid and the frequency of the amino acid in all crosslinked peptides.
Venn diagram showing the overlap between proteins identified in PAR‐TRAPP, RNPxl and Xi. Protein groups, reported by RNPxl and Xi, were expanded to single proteins so as to maximize the resulting overlap.
Domain structure of selected proteins, identified as crosslinked by the Xi search engine. Domains (coloured rectangles) and sites of phosphorylation (light green rhombi) from the UniProt database were plotted onto proteins represented by grey rectangles. Crosslink sites, identified by Xi, are indicated with red pentagons. See also Appendix Supplementary Methods.
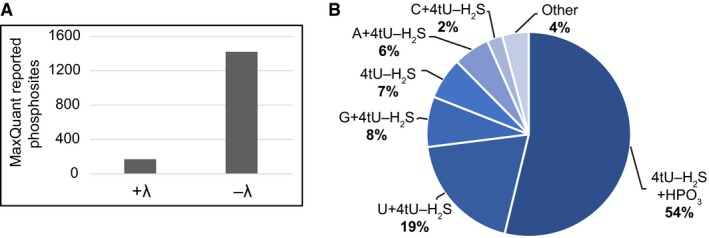
The number of protein phosphorylation sites, reported by MaxQuant software for the λ phosphatase‐treated sample and untreated control, demonstrating that the treatment effectively removed phosphorylation from amino acids.
Pie chart of RNA species observed crosslinked to peptides by the Xi search engine in the sample treated with Lambda phosphatase.
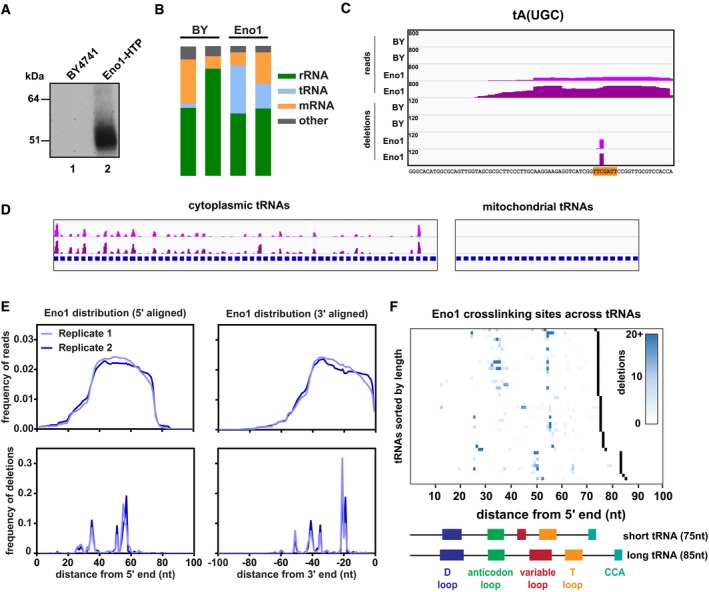
Representative gel showing the recovery of radiolabelled RNA after CRAC purification. Lane 1: Untagged control strain (BY4741). Lane 2: Strain expressing Eno1‐HTP from its endogenous locus.
Bar charts showing the relative distribution of reads amongst different classes of RNA.
The binding of Eno1 to the representative tRNA tA(UGC). The four upper tracks show the distribution of entire reads, while the four lower tracks show putative crosslinking sites (deletions). Tracks are scaled by reads (or deletions) per million, and this value is denoted in the upper left corner of each track. Two independent replicates are shown for the untagged BY control and Eno1‐HTP. The tRNA sequence is shown below with the T‐loop sequence highlighted in orange.
Global view of Eno1 binding to cytoplasmic tRNAs (left) or mitochondrial tRNAs (right). For ease of viewing, tRNAs across the genome were concatenated into a single “chromosome”, with each tRNA gene annotation shown in blue. Two independent replicates are shown.
Metagene plots showing the distribution of reads or deletions summed across all tRNAs. tRNA genes were aligned from either the 5′ end (left) or the 3′ end (right).
Heat map showing the distribution of putative crosslinking sites (deletions) across all Eno1‐bound tRNAs. tRNA genes are sorted by increasing length, and the 3′ end for each gene is denoted in black. The domain structures of a typical short (tH(GUG)) and long (tS(AGA)) tRNA are included for comparison.
References
-
- Avison M (2008) Measuring gene expression. London: Taylor & Francis;
-
- Baltz AG, Munschauer M, Schwanhausser B, Vasile A, Murakawa Y, Schueler M, Youngs N, Penfold‐Brown D, Drew K, Milek M, Wyler E, Bonneau R, Selbach M, Dieterich C, Landthaler M (2012) The mRNA‐bound proteome and its global occupancy profile on protein‐coding transcripts. Mol Cell 46: 674–690 - PubMed
Publication types
MeSH terms
Substances
Grants and funding
LinkOut - more resources
Full Text Sources
Molecular Biology Databases
