. 2019 Jun;31(6):1344-1366.
doi: 10.1105/tpc.18.00778. Epub 2019 Apr 8.

Cytochrome b 5 Is an Obligate Electron Shuttle Protein for Syringyl Lignin Biosynthesis in Arabidopsis

Affiliations

Cytochrome b 5 Is an Obligate Electron Shuttle Protein for Syringyl Lignin Biosynthesis in Arabidopsis

Mingyue Gou et al. Plant Cell. 2019 Jun.

Abstract

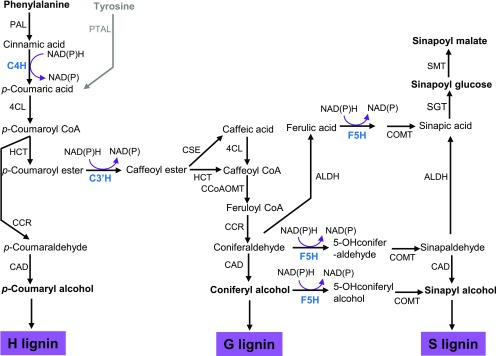
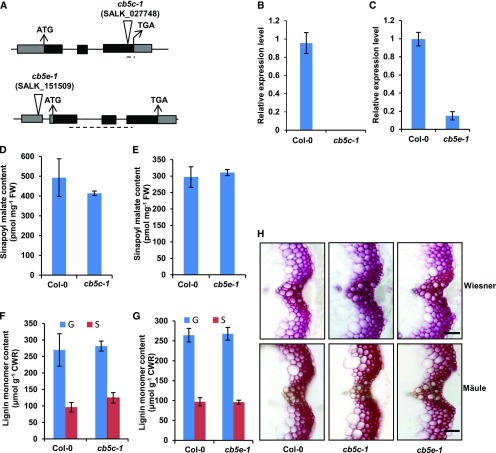
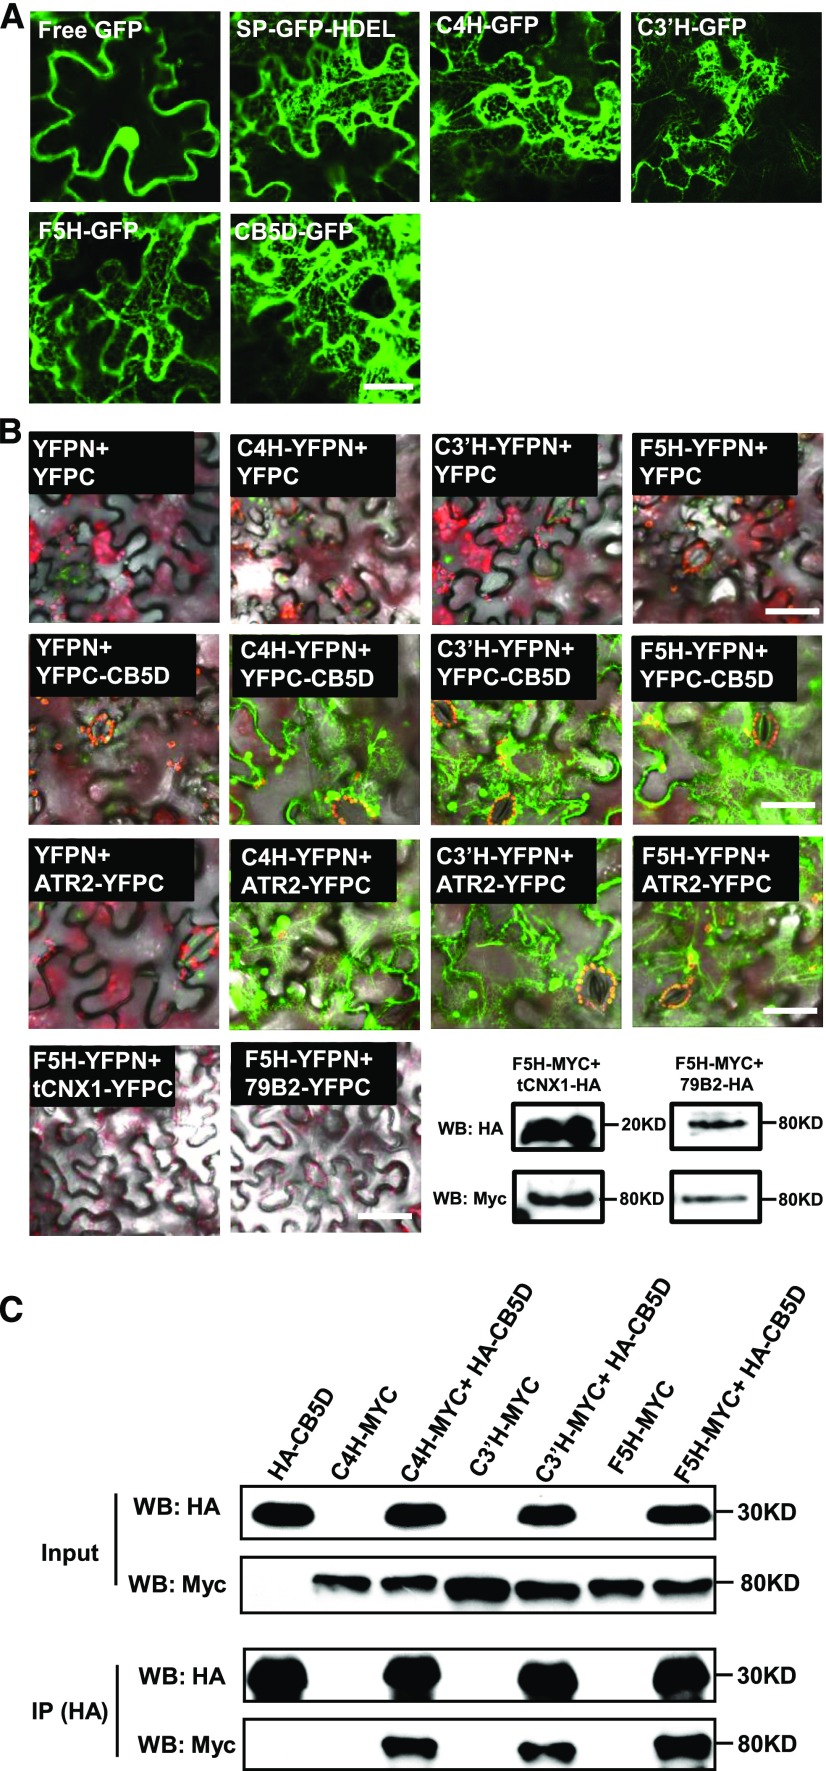
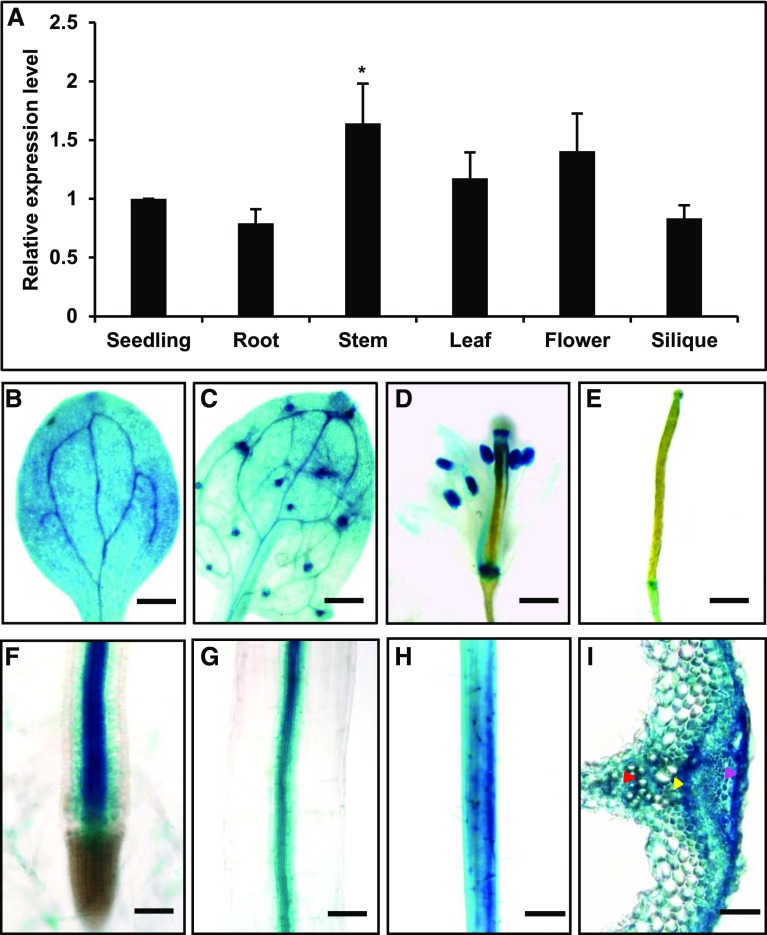
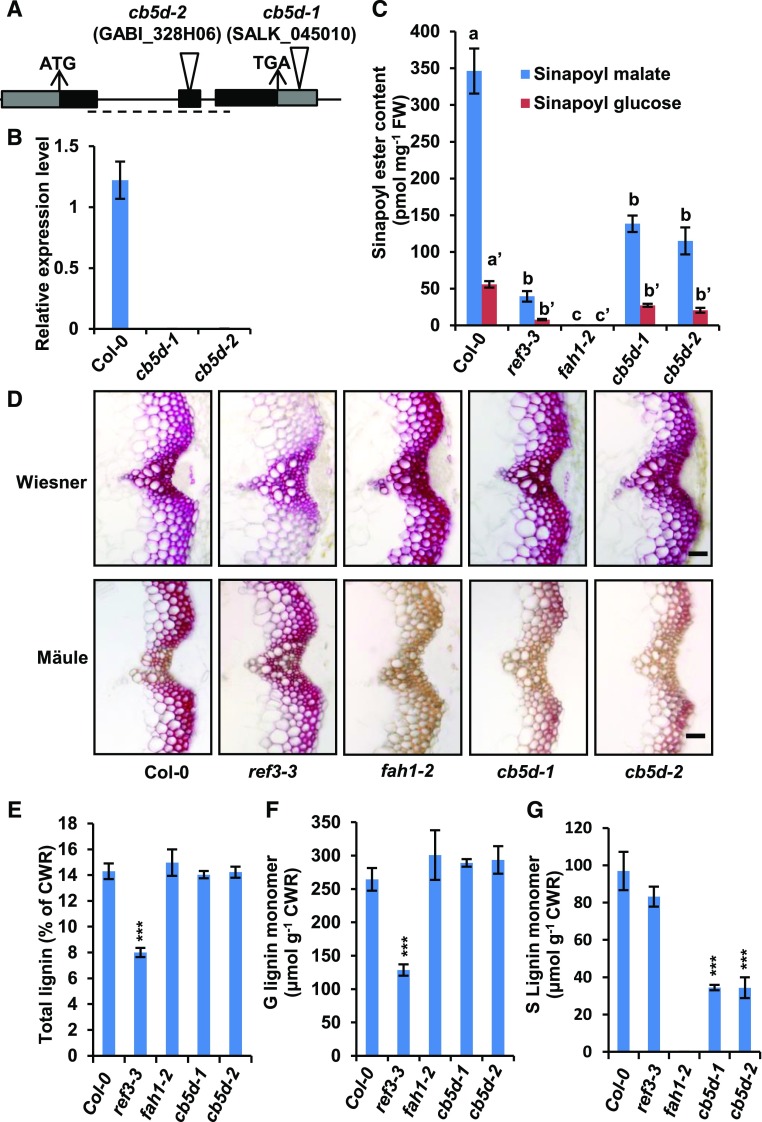
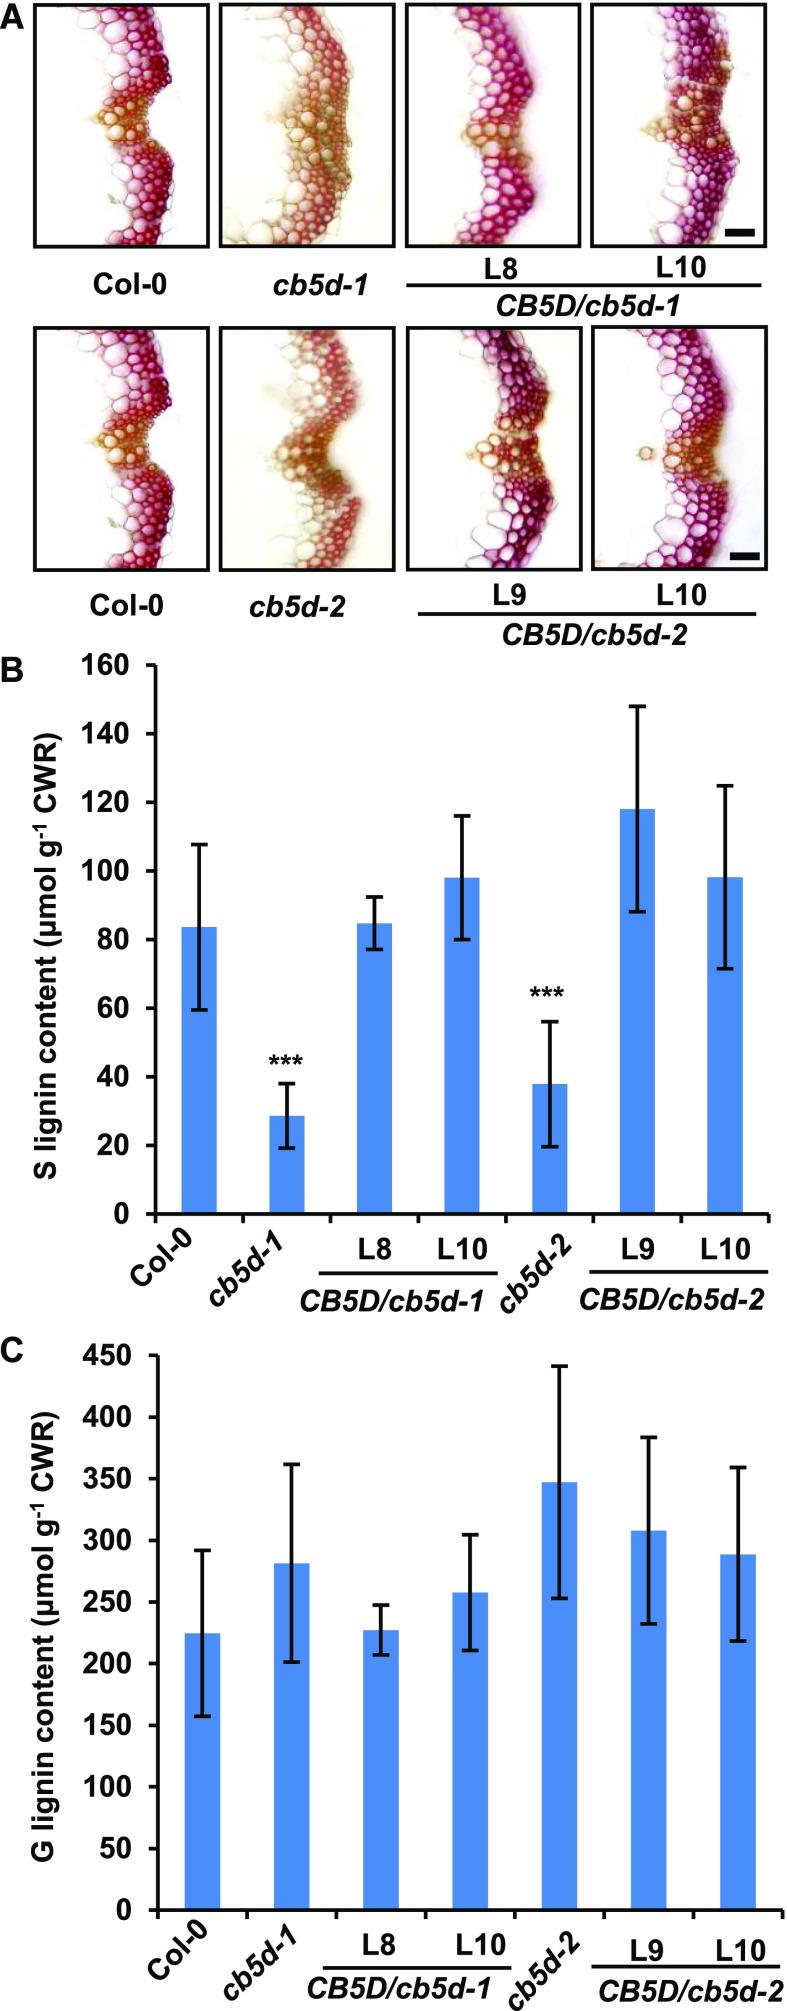
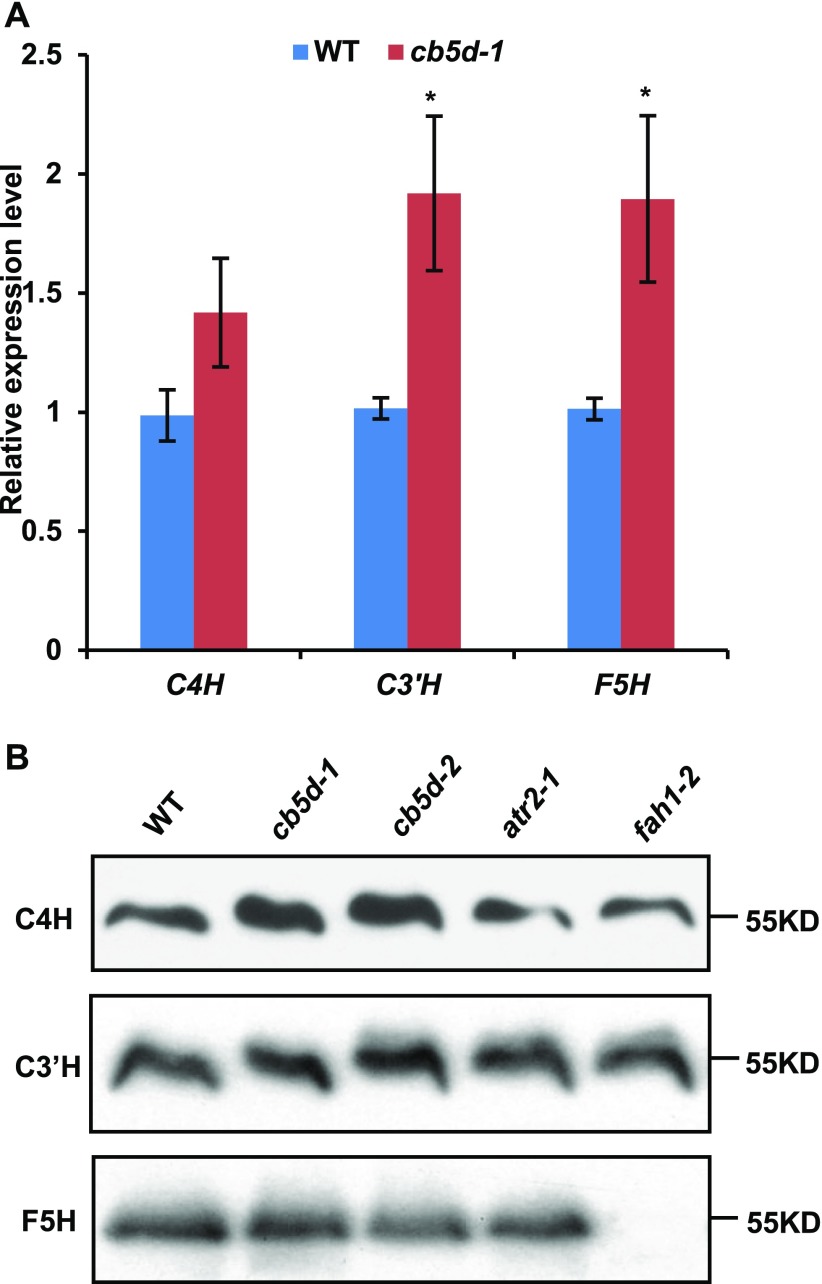
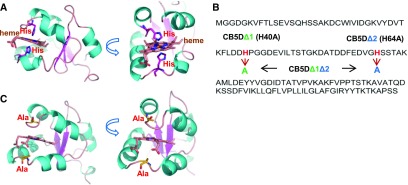
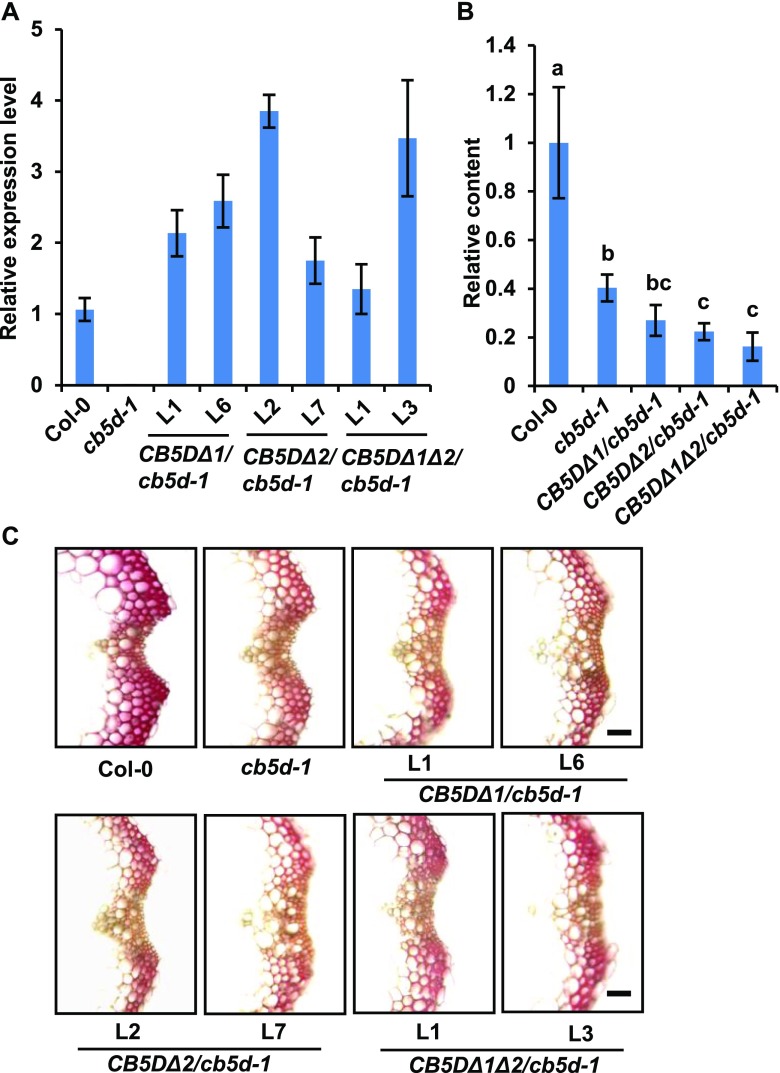
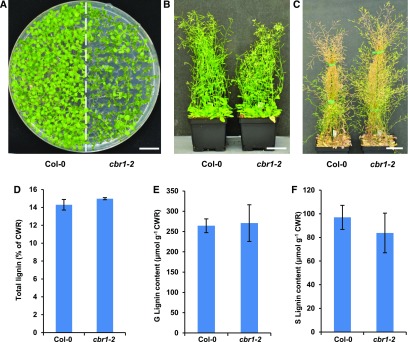
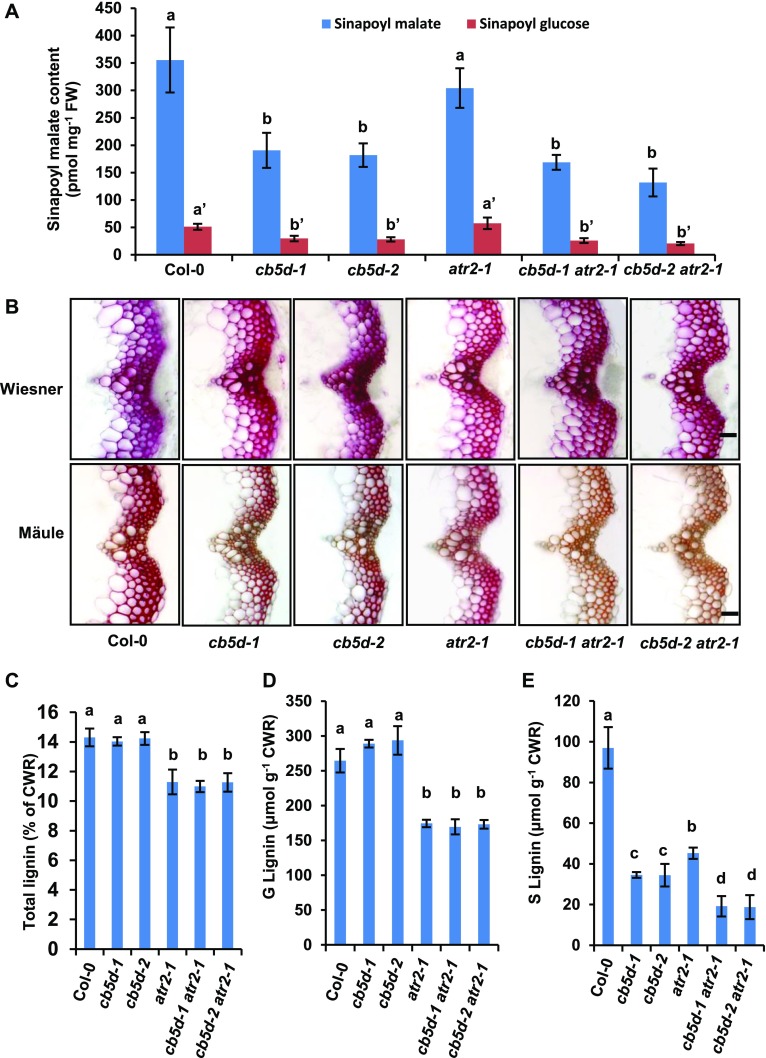
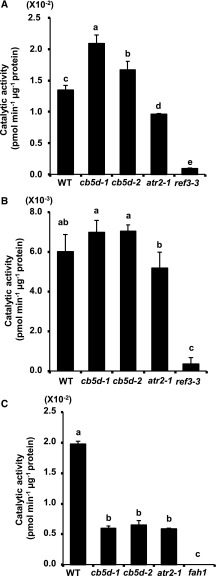
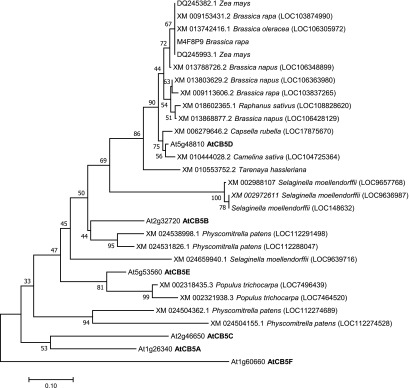
Angiosperms have evolved the metabolic capacity to synthesize p-hydroxyphenyl, guaiacyl (G), and syringyl (S) lignin subunits in their cell walls to better adapt to the harsh terrestrial environment. The structural characteristics of lignin subunits are essentially determined by three cytochrome P450-catalzyed reactions. NADPH-dependent cytochrome P450 oxidoreductase (CPR) is commonly regarded as the electron carrier for P450-catalyzed reactions during monolignol biosynthesis. Here, we show that cytochrome b 5 isoform D (CB5D) is an indispensable electron shuttle protein specific for S-lignin biosynthesis. Arabidopsis (Arabidopsis thaliana) CB5D localizes to the endoplasmic reticulum membrane and physically associates with monolignol P450 enzymes. Disrupting CB5D in Arabidopsis resulted in a >60% reduction in S-lignin subunit levels but no impairment in G-lignin formation compared with the wild type, which sharply contrasts with the impaired G- and S-lignin synthesis observed after disrupting ATR2, encoding Arabidopsis CPR. The defective S-lignin synthesis in cb5d mutants was rescued by the expression of the gene encoding CB5D but not with mutant CB5D devoid of its electron shuttle properties. Disrupting ATR2 suppressed the catalytic activity of both cinnamic acid 4-hydroxylase and ferulate 5-hydroxylase (F5H), but eliminating CB5D specifically depleted the latter's activity. Therefore, CB5D functions as an obligate electron shuttle intermediate that specifically augments F5H-catalyzed reactions, thereby controlling S-lignin biosynthesis.


Figures

Figure 1.
Figure 1.
Simplified Scheme of the Phenylpropanoid-Lignin Biosynthetic Pathway, Illustrating Three P450 Enzyme-Catalyzed Hydroxylation Reactions in Monolignol Biosynthesis. ALDH, aldehyde dehydrogenase; CAD, (hydroxy)cinnamyl alcohol dehydrogenase; CCoAOMT, caffeoyl CoA 3-O-methyltransferase; CCR, cinnamoyl CoA reductase; 4CL, 4-hydroxycinnamoyl CoA ligase; COMT, caffeic acid/5-hydroxyferulic acid 3/5-O-methyltransferase; CSE, caffeoyl shikimate esterase; HCT, hydroxycinnamoyl CoA:shikimate/quinate hydroxycinnamoyltransferase; PAL, phenylalanine ammonia lyase; PTAL, phenylalanine and tyrosine ammonia lyase; SGT, sinapate glucosyltransferase; SMT, sinapoylglucose:malate sinapoyltransferase. Gray letters and arrows indicate that the pathway occurs in grass.
Figure 2.
Figure 2.
Characterization of the cb5c-1 and cb5e-1 Mutants. (A) Diagrams of the T-DNA insertion mutants of CB5C and CB5E. The triangles indicate the T-DNA insertion sites in CB5D and CB5E. The dashed lines indicate the regions used for qRT-PCR analysis of gene expression. (B) and (C) qRT-PCR analysis of the relative expression levels of CB5C and CB5E in Col-0 wild-type and cb5c (B) or cb5e (C) seedlings. Approximately 12 2-week-old seedlings were grouped as one biological replicate for RNA extraction. qRT-PCR was performed with three biological replicates, each with four technical repeats. The data represent means ± sd of three biological replicates. (D) and (E) Sinapoyl malate content in 2-week-old seedlings of the Col-0 wild type and cb5c-1 (D) or the Col-0 wild type and cb5e-1 (E). The data represent means ± sd of three biological repeats; each replicate is composed of 0.5 g fresh weight (FW) of pooled seedlings. (F) and (G) Quantification of thioacidolytic lignin monomers in the cell walls of cb5c-1 (F) and cb5e-1 (G). Inflorescence stems from 12-week-old plants were used in the analysis. Stems from at least six plants were pooled as one biological replicate. The data represent means ± sd of three biological repeats. CWR, cell wall residues. Statistical analysis of the data in (D) to (G) was conducted with two-tailed Student’s t tests. No significant differences were observed between the wild type and mutants. (H) Histochemical observation of lignin in stem cross sections (1 cm from the bottom, 80 µm thick) of 7-week-old Col-0 wild-type, cb5c-1, and cb5e-1 plants with Wiesner staining for total lignin (top panels) and Mӓule staining for S-lignin (bottom panels). Bars = 30 µm.
Figure 3.
Figure 3.
Colocalization and Interaction of Monolignol Biosynthetic P450s and CB5D on the ER Membrane. (A) Fluorescence distribution patterns of C4H-, C3′H-, F5H-, and CB5D-GFP transiently expressed in wild tobacco leaves. Free GFP and SP-GFP-HDEL were used as controls. Bar = 25 µm. (B) Pair-wise BiFC assay of C4H, C3′H, and F5H with CB5D and ATR2. F5H was coexpressed with a truncated ER membrane-localized CNX1 (tCNX1) protein containing its C-terminal transmembrane domain and with another P450 CYP79B2 as the negative controls. The bottom right panel shows immunoblots of the expressed tCNX1-HA with F5H-Myc and CYP79B2-HA with F5H-Myc as negative controls with anti-HA and anti-Myc antibodies. WB indicates immunoblot (protein gel blot). Bars = 50 µm. (C) Co-IP assay of C4H, C3′H, and F5H with CB5D using proteins expressed in the BiFC assay. The proteins were immunoprecipitated (IP) with anti-HA antibody and probed with anti-HA and anti-Myc antibodies.
Figure 4.
Figure 4.
Expression Pattern of CB5D in Planta. (A) qRT-PCR analysis of relative CB5D transcript levels in different tissues of the Col-0 wild type. The roots and leaves from 30-d-old plants, the stems and flowers from ∼40-d-old plants, and the siliques from ∼50-d-old plants were collected. Tissues from at least five individual plants or ∼12 2-week-old seedlings were pooled as one biological replicate. The data represent means ± sd from three biological replicates; each replicate represents the average of three technical repeats. The asterisk indicates a significant difference compared with the seedling samples (Student’s t test; P < 0.05). (B) to (I) GUS staining of different tissues of pCB5D:GUS transgenic plants in the Col-0 wild-type background. (B) Cotyledon. Bar = 500 µm. (C) True leaf. Bar = 300 µm. (D) Flower. Bar = 300 µm. (E) Young silique. Bar = 500 µm. (F) Root. Bar = 150 µm. (G) Hypocotyl. Bar = 75 µm. (H) Stem. Bar = 300 µm. (I) Cross section of stem. The red arrowhead points to xylem cells, the yellow arrowhead points to cambium cells, and the magenta arrowhead points to epidermal cells. Bar = 75 µm.
Figure 5.
Figure 5.
Characterization of cb5d-Related Mutants. (A) Diagram of the T-DNA insertion mutants of CB5D. The triangles indicate the T-DNA insertion sites in CB5D. The dashed line shows the region used for qRT-PCR analysis of CB5D gene expression. (B) qRT-PCR analysis of the relative expression levels of CB5D in the Col-0 wild type, cb5d-1, and cb5d-2. Each of 12 2-week-old seedlings was grouped as one biological replicate for RNA extraction. Three biological replicates, each with four technical repeats, were performed in qRT-PCR analysis. The data represent means ± sd of three biological repeats. (C) Quantification of sinapoyl ester content in 2-week-old seedlings of the indicated genotypes. The data represent means ± sd of four biological repeats; each replicate is composed of 0.5 g of pooled seedlings. Different letters indicate significant differences (P < 0.05; one-way ANOVA, Tukey’s HSD test) between the different genotypes. FW, fresh weight. (D) Histochemical observation of cross sections of 7-week-old stems (1 cm from the bottom, 50 µm thick) of the indicated genotypes with Wiesner staining for total lignin (top panels) and Mӓule staining for S-lignin (bottom panels). Bars = 30 µm. (E) Quantification of total acetyl bromide lignin content in the cell walls of the indicated genotypes. (F) Quantification of thioacidolytic G-lignin monomer in the cell walls of the indicated genotypes. (G) Quantification of thioacidolytic S-lignin monomer in the cell walls of the indicated genotypes. In (E) to (G), the data represent means ± sd of three biological replicates of stems from six fully mature (14-week-old) plants per replicate. CWR, cell wall residues. Asterisks indicate significant differences compared with the seedling samples (Student’s t test; ***, P < 0.001).
Figure 6.
Figure 6.
Complementation of S-Lignin Synthesis in cb5d Mutants by CB5D Expression. (A) Histochemical observation of S-lignin (Mӓule staining) in the Col-0 wild type, cb5d-1, cb5d-2, and two representative T2 transgenic lines of pC4H:CB5D in the cb5d-1 and cb5d-2 homozygous backgrounds. Cross sections of 7-week-old stems (1 cm from the bottom, 50 µm thick) were used. Bars = 30 µm. (B) and (C) Quantification of S-lignin (B) and G-lignin (C) monomer in the cell walls of the indicated genotypes. Stems of 14-week-old Col-0 wild type, cb5d-1, cb5d-2, and two T2 transgenic lines of pC4H:CB5D in the cb5d-1 and cb5d-2 backgrounds were used in the analysis. Stems from at least six plants were pooled as one replicate. The data represent means ± sd of three biological replicates. Asterisks indicate significant differences compared with the Col-0 wild type (two-tailed Student’s t test; ***, P < 0.001). No significant differences were observed for G-lignin in each genotype compared with the Col-0 wild type. CWR, cell wall residues.
Figure 7.
Figure 7.
Transcript Abundance and Protein Levels of Three P450s in cb5d Mutant Lines. (A) qRT-PCR analysis of the relative expression levels of C4H, C3′H, and F5H in the Col-0 wild type and cb5d-1. Two-week-old seedlings were used for RNA extraction. Each of ∼12 seedlings were grouped as a biological replicate. Three biological repeats, each with four technical repeats, were performed in the analysis. The data represent means ± sd of three biological repeats. Asterisks indicate significant differences compared with wild-type samples (Student’s t test; *, P < 0.05). (B) Immunoblots of C4H, C3′H, and F5H protein levels in 2-week-old seedlings of the Col-0 wild type, cb5d-1, cb5d-2, atr2-1, and fah1-2. Equal amounts of microsomal proteins were loaded in each lane.
Figure 8.
Figure 8.
Creation of CB5D Variants. (A) Homology model of AtCB5D based on the crystal structure of human CB5B (PDB ID: 3NER). The bound heme and its interacting His residues are presented as sticks. (B) Diagram of the substitutions (His to Ala) in AtCB5D. Mutants with substitutions of His-40, or His-64, or both with Ala are designated as CB5DΔ1, CB5DΔ2, and CB5DΔ1Δ2, respectively. (C) Homology model of CB5DΔ1Δ2, showing its identical overall structure to the parental protein.
Figure 9.
Figure 9.
Complementation Test Using Genes Encoding Mutant Variants of CB5D. (A) qRT-PCR analysis of gene expression levels in T2 transgenic lines expressing pC4H:CYB5DΔ1, pC4H:CYB5DΔ2, or pC4H:CYB5DΔ1Δ2 in the cb5d-1 background. Two-week-old T2 seedlings were used for RNA extraction. Approximately 12 seedlings were pooled as one biological replicate. The data represent means ± sd of three biological replicates, each with three technical repeats. (B) Relative content of sinapoyl malate in 4-week-old rosette leaves of the Col-0 wild type, cb5d-1, and T1 transgenic lines harboring pC4H:CYB5DΔ in the cb5d-1 background. The data represent means ± sd of all biological replicates and are expressed as relative values compared with the Col-0 wild type. The data for the Col-0 wild type and cb5d-1 were obtained from three independent plants representing three biological replicates; the data for pC4H:CYB5DΔ transgenic plants were obtained from an average of 10 T1 independent transgenic lines per transgene. Different letters indicate significant differences (P < 0.05; one-way ANOVA, Tukey’s HSD test) between the different genotypes. (C) Histochemical observation of S-lignin in the Col-0 wild type, cb5d-1, and two independent T2 transgenic lines of pC4H:CYB5DΔ1, pC4H:CYB5DΔ2, and pC4H:CYB5DΔ1Δ2 in the cb5d-1 background with Mӓule staining. Cross sections of 7-week-old stems (1 cm from the bottom, 50 µm thick) were used. Bars = 30 µm.
Figure 10.
Figure 10.
Characterization of the cbr1-2 Mutant. (A) Growth phenotypes of 2-week-old seedlings of the Col-0 wild type and cbr1-2 on 0.5× Murashige and Skoog plates. Bar = 1 cm. (B) Growth phenotypes of 7-week-old plants of the Col-0 wild type and cbr1-2. Bar = 5 cm. (C) Growth phenotypes of 12-week-old mature plants of the Col-0 wild type and cbr1-2. Bar = 5 cm. (D) Quantification of total acetyl bromide lignin content in the cell walls of 14-week-old plants of the Col-0 wild type and cbr1-2. (E) Quantification of thioacidolytic G-lignin monomer in the cell walls of 14-week-old plants of the Col-0 wild type and cbr1-2. (F) Quantification of thioacidolytic S-lignin monomer in the cell walls of 14-week-old plants of the Col-0 wild type and cbr1-2. Data in (D) to (F) represent means ± sd of three biological replicates of pooled stems from at least six fully mature plants per replicate. There was no significant difference in total lignin or G- or S-lignin monomer contents in cbr1-2 compared with the Col-0 wild type (two-tailed Student’s t test). CWR, cell wall residues.
Figure 11.
Figure 11.
Characterization of CB5D and CPR Mutants. (A) Quantification of sinapoyl ester content in 2-week-old seedlings of the indicated genotypes. The data represent means ± sd of four biological repeats. FW, fresh weight. (B) Histochemical observation of cross sections of 7-week-old stems (1 cm from the bottom, 80 µm thick) of the indicated genotypes with Wiesner staining for total lignin (top panels) and Mӓule staining for S-lignin (bottom panels). Bars = 30 µm. (C) Quantification of total acetyl bromide lignin content in the cell walls of the indicated genotypes. (D) Quantification of thioacidolytic G-lignin monomer in the cell walls of the indicated genotypes. (E) Quantification of thioacidolytic S-lignin monomer in the cell walls of the indicated genotypes. In (C) to (E), the data represent means ± sd of three biological replicates of pooled stems from at least six fully mature plants per replicate. CWR, cell wall residues. In (A) and (C) to (E), different letters indicate significant differences (P < 0.05; one-way ANOVA, Tukey’s HSD test) between the different genotypes.
Figure 12.
Figure 12.
Enzymatic Activity Assay of C4H and F5H in Planta. Microsomes were prepared from 2-week-old seedlings of different genotypes, and P450 protein concentration was monitored by immunoblot analysis using anti-C4H or anti-F5H antibodies, as shown in Figure 7. (A) and (B) C4H activity in the Col-0 wild type, cb5d-1, cb5d-2, atr2-1, and ref3-3 mutant lines in the presence of NADPH (A) or NADH (B) as the reductant. (C) F5H activity in the Col-0 wild type, cb5d-1, cb5d-2, atr2-1, and fah1-2 mutant lines in the presence of NADPH as the reductant. No measurable activity was detected when using NADH as the reducing power. The data represent means ± sd of three biological replicates. Three independent batches of experiments were conducted with the same results. Different letters indicate significant differences (P < 0.05; one-way ANOVA, Tukey’s HSD test) of different plant genotypes.
Figure 13.
Figure 13.
Phylogenetic Relationship of Arabidopsis Cytochrome b5 and Related Putative Homologs (of AtCB5D) across Land Plants. Protein sequences of 6 Arabidopsis CB5 homologs and 29 putative orthologs from different species that were obtained using the AtCB5D sequence as a query via BLAST searches of nucleotide sequences in the National Center for Biotechnology Information, and/or retrieved from the PANTHER classification system database (www.pantherdb.org), were used in the analysis. The sequences were aligned with ClustalW integrated in the MEGA v.7.0 program. The evolutionary history was inferred using the neighbor-joining method. The optimal tree with the sum of branch length = 3.19379392 is shown. The percentages (>50%) of replicate trees in which the associated taxa clustered together in the bootstrap test (1000 replicates) are shown next to the branches. The tree is drawn to scale, with branch lengths in the same units as those of the evolutionary distances used to construct the phylogenetic tree. The evolutionary distances were computed using the Poisson correction method, and the units represent the number of amino acid substitutions per site.
None

Similar articles

Cited by

References

    1. Backes W.L., Kelley R.W. (2003). Organization of multiple cytochrome P450s with NADPH-cytochrome P450 reductase in membranes. Pharmacol. Ther. 98: 221–233. - PubMed
    1. Boerjan W., Ralph J., Baucher M. (2003). Lignin biosynthesis. Annu. Rev. Plant Biol. 54: 519–546. - PubMed
    1. Clough S.J., Bent A.F. (1998). Floral dip: A simplified method for Agrobacterium-mediated transformation of Arabidopsis thaliana. Plant J. 16: 735–743. - PubMed
    1. Cowley A.B., Altuve A., Kuchment O., Terzyan S., Zhang X., Rivera M., Benson D.R. (2002). Toward engineering the stability and hemin-binding properties of microsomal cytochromes b5 into rat outer mitochondrial membrane cytochrome b5: Examining the influence of residues 25 and 71. Biochemistry 41: 11566–11581. - PubMed
    1. Dailey H.A., Strittmatter P. (1979). Modification and identification of cytochrome b5 carboxyl groups involved in protein-protein interaction with cytochrome b5 reductase. J. Biol. Chem. 254: 5388–5396. - PubMed

Publication types

MeSH terms