. 2019 Apr 8;10(1):1600.
doi: 10.1038/s41467-019-09018-y.

Breast cancer quantitative proteome and proteogenomic landscape

Collaborators, Affiliations

Breast cancer quantitative proteome and proteogenomic landscape

Henrik J Johansson et al. Nat Commun. .

Abstract

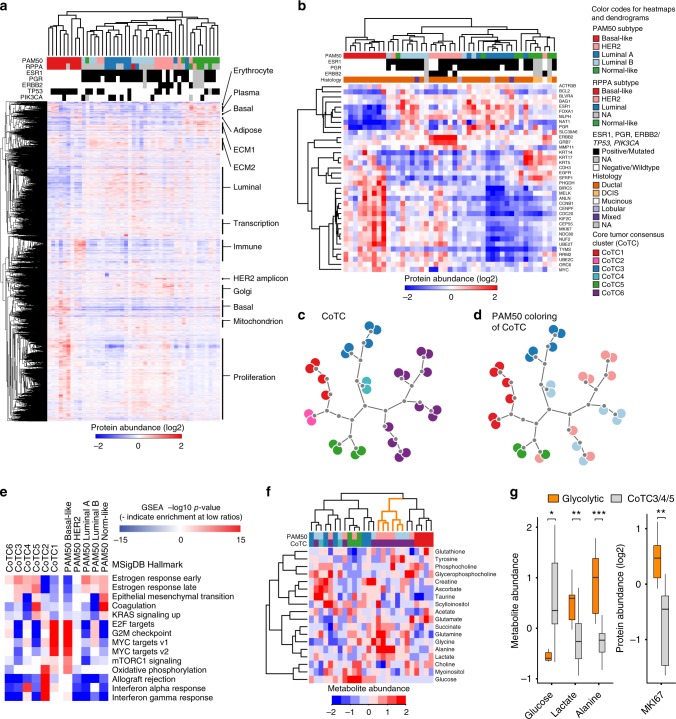
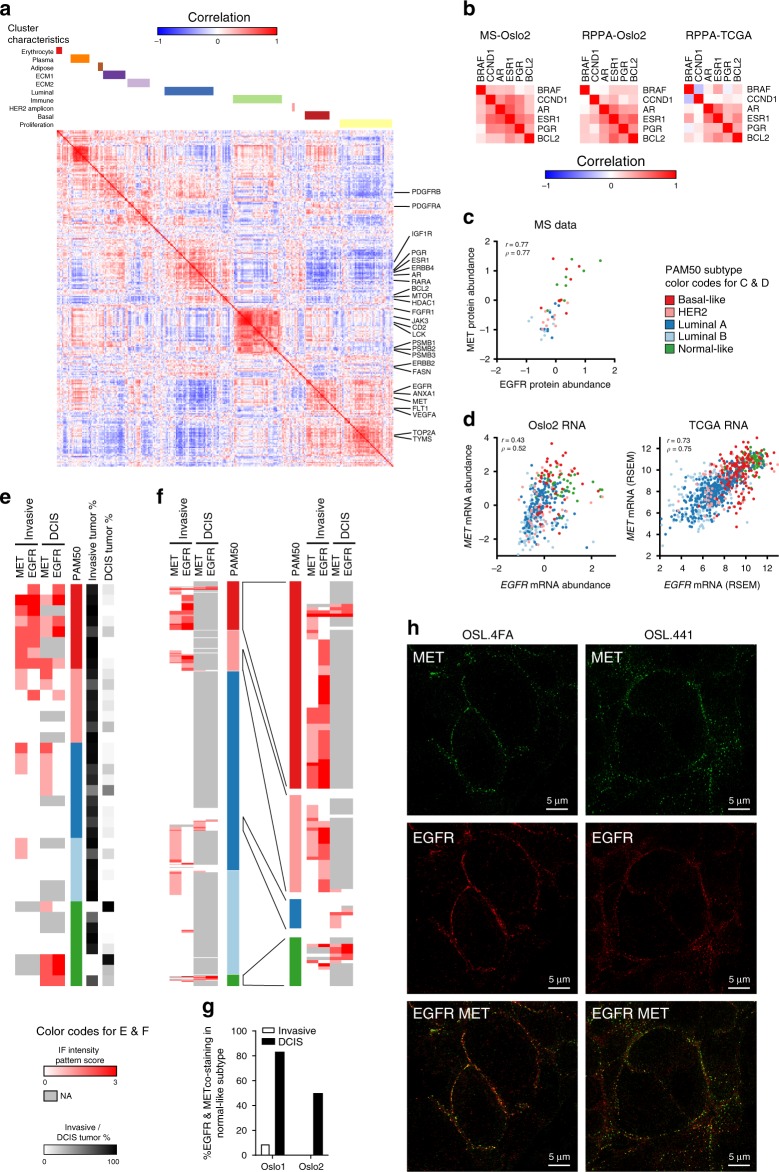
In the preceding decades, molecular characterization has revolutionized breast cancer (BC) research and therapeutic approaches. Presented herein, an unbiased analysis of breast tumor proteomes, inclusive of 9995 proteins quantified across all tumors, for the first time recapitulates BC subtypes. Additionally, poor-prognosis basal-like and luminal B tumors are further subdivided by immune component infiltration, suggesting the current classification is incomplete. Proteome-based networks distinguish functional protein modules for breast tumor groups, with co-expression of EGFR and MET marking ductal carcinoma in situ regions of normal-like tumors and lending to a more accurate classification of this poorly defined subtype. Genes included within prognostic mRNA panels have significantly higher than average mRNA-protein correlations, and gene copy number alterations are dampened at the protein-level; underscoring the value of proteome quantification for prognostication and phenotypic classification. Furthermore, protein products mapping to non-coding genomic regions are identified; highlighting a potential new class of tumor-specific immunotherapeutic targets.


Conflict of interest statement

The authors declare no competing interests.

Figures

Fig. 1
Fig. 1
Proteomics workflow overview. Quantitative proteome and proteogenomics analyses, and additional data levels used for validation and multi-level omics analysis. PSM peptide spectrum match, SAAV single amino acid variant, HiRIEF high-resolution isoelectric focusing, RPPA reverse phase protein array, CNA copy number alteration, SNP single-nucleotide polymorphism, TMA tissue microarray
Fig. 2
Fig. 2
Proteome clustering, relation to PAM50 subtypes and metabolites. a Proteome-driven clustering of proteins mapping to 9995 gene symbols with overlapping quantification in all 45 tumors. Protein cluster characteristics, by GO enrichment analysis, are highlighted to the right (see Supplementary Fig. 2 for details). b Clustering of identified and quantified proteins from the PAM50 panel (n = 37). c Dendrogram visualization of core tumor consensus clusters (CoTC) into six clusters. For details, see Supplementary Methods and Supplementary Fig. 4. d PAM50 subtype assignments for the CoTCs in c. e Ranked gene set enrichment analysis (GSEA) of CoTC and PAM50 subtypes. f Clustering of HR-MAS measured metabolite levels and relation to CoTCs and PAM50 subtypes. Tumors with glycolytic characteristics are indicated in orange. HR-MAS data are not available for CoTC2 tumors. g Levels of glucose and its conversion product lactate and alanine, as well as MKI67 protein abundance in glycolytic tumors compared to other luminal tumors. T-test, *p < 0.05, **p < 0.01, ***p < 0.001. In box plots, center line represents median and the boxed region represents the first to third quartile, whiskers according to Tukey
Fig. 3
Fig. 3
Proteome characteristics associate with tumor grouping. a Protein and RNA levels across tumors for known protein complexes (Supplementary Fig. 7A, B examples of more complexes). Basal indicates basal-like and normal indicates normal-like PAM50 subtype. b Comparison of all pairwise correlations to correlations from known interaction pairs from CORUM database, using quantitative protein and RNA levels across the 45 tumors (see Supplementary Fig. 7C for same analysis using Biogrid interactions). c Breast cancer protein correlation network based on 1447 high-variance proteins using > 0.5 Pearson correlation and KCore > 1 cutoff. Protein groups are defined and color coded based on GO enrichments in Fig. 2a, Supplementary Fig. 2, and 7D, E. d Visualization of average quantification of core tumor proteome consensus clusters (CoTC) in the correlation network. CoTCs are defined in Fig. 2c and Supplementary Fig. 4. Main PAM50 subtype(s) for each CoTC is indicated in parentheses
Fig. 4
Fig. 4
Druggable proteome analysis. a Correlation matrix of all 290 FDA approved drug targets detected and quantified across all 45 tumors. Top panel shows the connection to annotated protein clusters defined in Fig. 2a, Supplementary Fig. 2. Selected BC targets and potential targets, highlighted on the right side. b Correlation matrices, comparing MS data, and antibody-based quantification (RPPA), from Oslo2 (n = 329) and TCGA (n = 892), for correlating luminal drug targets from a identified in all three datasets. c Scatter plot of EGFR and MET protein levels in Oslo2 MS data. d Scatter plot of EGFR and MET mRNA levels in the whole Oslo2 cohort (n = 378) and TCGA (n = 950). Correlation coefficients are indicated as Pearson’s r and Spearman’s ρ in c and d. e Scoring of EGFR and MET IF staining pattern from whole sections of 40 of the Oslo2 tumors analyzed by MS proteomics. Tumors are arranged according to PAM50 subtype and separated by invasive and ductal carcinoma in situ (DCIS) tumor regions. See Supplementary Fig. 9 for staining examples. f Scoring of IF staining pattern from Oslo1 cohort (n = 530) in the same way as in e. g Co-staining of EGFR and MET in the normal-like subtype. Evaluable DCIS and invasive components from e and f are shown. h Super-resolution STED microscopy of EGFR and MET staining in in situ regions of two normal-like tumor
Fig. 5
Fig. 5
RNA–protein correlation analysis. a Correlation between protein and mRNA quantitative values (Spearman) of individual genes. b Distribution of mRNA–protein correlations for selected groups of genes. Gene groups were compared with all correlations using Mann–Whitney U test. For additional gene groups and mRNA–protein correlation analysis considering data distribution, see Supplementary Fig. 10, 11, and Supplementary Data 4. c Ranked mRNA–protein correlations for genes causally associated with cancer (COSMIC) and breast cancer (Nik-Zainal). d Gene ontology and hallmarks enriched at the top or bottom of proteins associated with tumor mRNA–protein correlation. All visualized protein groups have a p-value enrichment below 1E-17 using Mann–Whitney U test. In box plots, center line represents median and the boxed region represents the first to third quartile, whiskers indicate the maximum and minimum values
Fig. 6
Fig. 6
Gene copy number effects on mRNA and protein levels. a, b Venn diagrams displaying CNAs associated with mRNA and/or protein levels for a gains and b losses in cis. See Supplementary Fig. 13 and Supplementary Methods for defining the CNA–mRNA/protein associations. c Scatter plot of CNA correlation to RNA and protein to identify CNA effects attenuated at the protein level. Attenuated proteins (in red) were identified using a Gaussian mixture model. d Boxplot of ubiquitinylation site fold change following bortezomib proteasome inhibition for proteins defined as attenuated in panel c (red) compared with non-attenuated (gray). Wilcoxon test was used on the ubiquitinylation data from Kim et al.. e Genomic distribution of CNAs and CNA effects of gains from a. f MsigDB and chromosome position enrichment analysis of CNA effects on mRNA and protein from a and b. Hypergeometric test. g Overlap of CNA effects to IntClust classifier genes (466 of 619 genes overlapped all three datasets). CNA effects associated with ANOVA as in Curtis et al.
Fig. 7
Fig. 7
Proteogenomics analysis. a Overview of the proteogenomics workflow and additional data levels used for validation. b Curated peptides from novel coding regions. Categories according to genome annotation in the respective loci. Inset shows Manhattan plot of novel peptide distribution across the human genome. c Orthogonal evidence of novel peptides by public domain data, indicated by the presence of black bars in corresponding rows for RNA-seq, and re-analysis of proteomics data on breast tumors. See Supplementary Fig. 14 for details. d Prediction of MHC class I binding and identification in normal tissues from draft proteome data among novel peptides. e High levels of novel peptides from lncRNA lnc-AKAP14–1:3 in one Luminal A (top) tumor and in two tumors (Luminal A and B) for lnc-CXorf36–3:1 (bottom). f Unique and overlapping identifications of curated SAAV peptides from CanProVar and COSMIC databases. g Impact of SNPs (from iCOG array), with corresponding SAAV peptide identification, on protein levels. Impact score is plotted cumulatively for reference allele, hetero and homozygous SNPs. Percentage of impact scores below −2 and above 2 are shown in the inset. See Supplementary Fig. 15B for examples. h Allele-specific protein levels displaying SAAV peptide and matched reference allele peptide quantification cross the 45 tumors. Peptide quantification is categorized into reference allele (Ref), hetero- and homozygous SNPs, based on iCogs data. See Supplementary Fig. 15C for more examples

References

    1. Perou CM, et al. Molecular portraits of human breast tumours. Nature. 2000;406:747–752. doi: 10.1038/35021093. - DOI - PubMed
    1. Senkus E, et al. Primary breast cancer: ESMO Clinical Practice Guidelines for diagnosis, treatment and follow-up. Ann. Oncol. 2015;26(Suppl 5):v8–30. doi: 10.1093/annonc/mdv298. - DOI - PubMed
    1. Coates AS, et al. Tailoring therapies--improving the management of early breast cancer: St Gallen International Expert Consensus on the Primary Therapy of Early Breast Cancer 2015. Ann. Oncol. 2015;26:1533–1546. doi: 10.1093/annonc/mdv221. - DOI - PMC - PubMed
    1. Zhang B, et al. Proteogenomic characterization of human colon and rectal cancer. Nature. 2014;513:382–387. doi: 10.1038/nature13438. - DOI - PMC - PubMed
    1. Mertins P, et al. Proteogenomics connects somatic mutations to signalling in breast cancer. Nature. 2016;534:55–62. doi: 10.1038/nature18003. - DOI - PMC - PubMed

Publication types

MeSH terms