. 2019 Apr 8;10(1):1601.
doi: 10.1038/s41467-019-09138-5.

Adaptive individual variation in phenological responses to perceived predation levels

Affiliations

Adaptive individual variation in phenological responses to perceived predation levels

Robin N Abbey-Lee et al. Nat Commun. .

Erratum in

Abstract

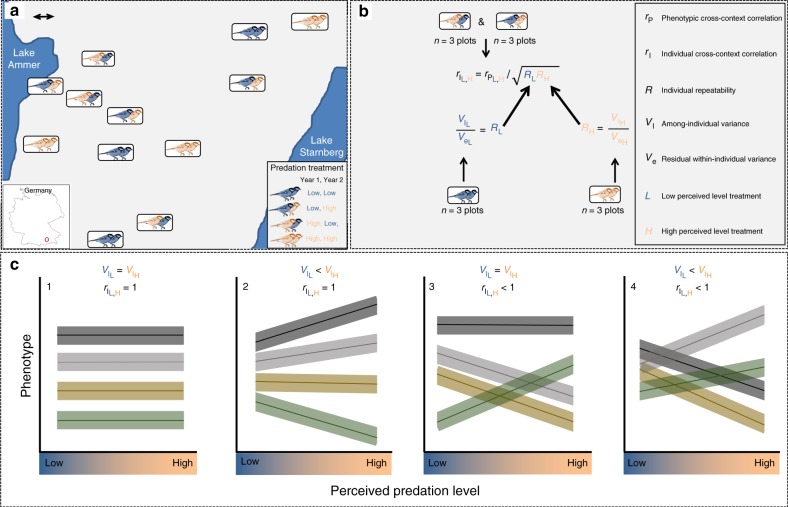
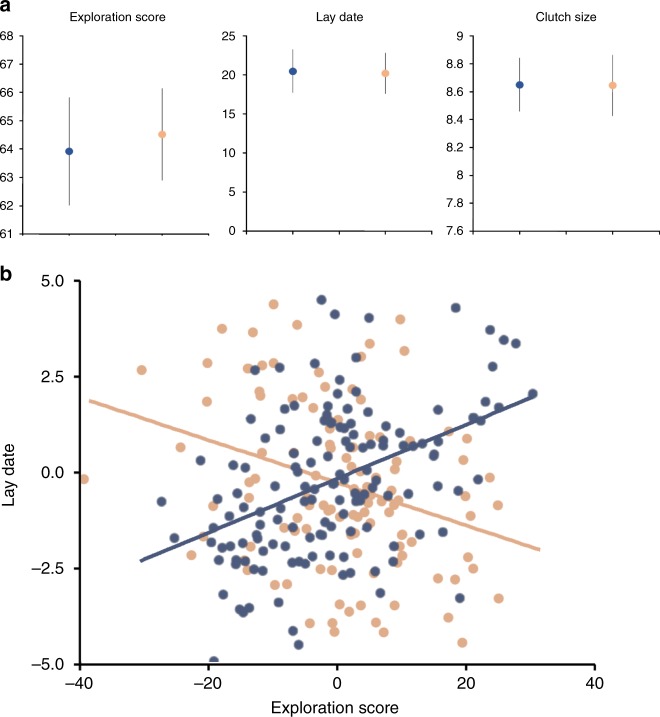
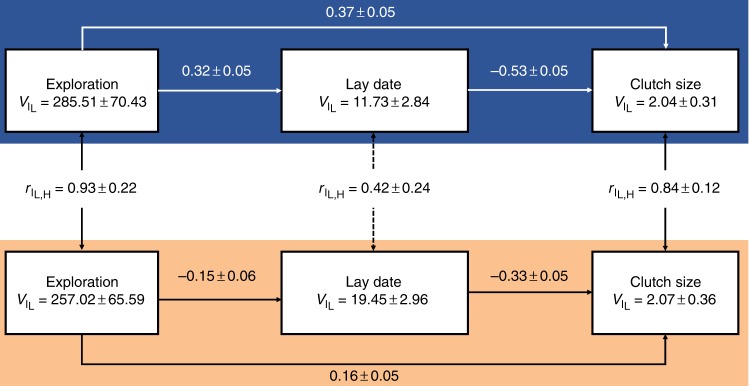
The adaptive evolution of timing of breeding (a component of phenology) in response to environmental change requires individual variation in phenotypic plasticity for selection to act upon. A major question is what processes generate this variation. Here we apply multi-year manipulations of perceived predation levels (PPL) in an avian predator-prey system, identifying phenotypic plasticity in phenology as a key component of alternative behavioral strategies with equal fitness payoffs. We show that under low-PPL, faster (versus slower) exploring birds breed late (versus early); the pattern is reversed under high-PPL, with breeding synchrony decreasing in conjunction. Timing of breeding affects reproductive success, yet behavioral types have equal fitness. The existence of alternative behavioral strategies thus explains variation in phenology and plasticity in reproductive behavior, which has implications for evolution in response to anthropogenic change.


Conflict of interest statement

The authors declare no competing interests.

Figures

Fig. 1
Fig. 1
Experimental design. a Study area of 12 nest box plots (rectangular boxes) situated in Southern Germany. Colored great tit symbols represent each plot’s treatment (blue: low perceived predation level (PPL): orange: high PPL) in the first (left-hand bird) and second (right-hand bird) year of study. Scale bar is 1 km. b The among-individual variance (VI), the residual within-individual variance (Ve), and the cross-year repeatability (R=VIVI+Ve) for timing of breeding (and other traits) were calculable for the low-PPL and high-PPL environment since six plots received the same treatment (3 low, 3 high) across years. The phenotypic cross-context correlation (rPL,H) between a female’s timing of breeding under low versus high PPL was calculated using data from six plots that changed treatment across years. This parameter represents an attenuated estimate of the among-individual cross-context correlation (rIL,H) that our unique partial crossover study design allowed estimating (for details, see Methods). c This in turn enabled us to differentiate between four distinct scenarios describing how individual reaction norms for timing of breeding (and other traits) varied as a function of PPL (detailed in main text). Those scenarios differed in whether treatment-specific among-individual variance was absent (VIL=VIH) versus present (VILVIH) and whether reaction norm crossing was absent (rIL,H=1) versus present (rIL,H<1). Here we illustrate possible scenarios given the assumption that mean breeding date is similar in both contexts, and the variance is either the same or higher under high-PPL
Fig. 2
Fig. 2
Responses to perceived predation level (PPL) manipulations. a Differences in traits depending on PPL exposure. Data are means with error bars representing standard error for each unique combination of treatment group and measured trait (exploration score, lay date, clutch size), illustrating the absence of an effect of treatment on mean values detected by our analyses printed in Table 1. Colored dots represent treatment (blue: low PPL: orange: high PPL). b Relationship between exploration score and lay date depending on PPL exposure. Points are individual’s best linear unbiased predictors for lay date (y axis) and exploration score (x axis). These represent our best estimate of an individual’s average value for the two focal traits corrected for the sample size per individual. Colored dots represent treatment (blue: low PPL: orange: high PPL). Source data are provided as a Source Data file, total sample size is 326 individuals, 172 in low PPL, 154 in high PPL)
Fig. 3
Fig. 3
Path analyses results. Using among-individual correlation matrices to quantify the direct and indirect pathways by which exploratory behavior affected clutch size. Path coefficients (±SE) are printed alongside each hypothesized path (directional arrows) for the low-perceived predation level (PPL) (L: blue) and high-PPL (H: orange) treatment plots separately. Treatment-specific among-individual variances (VI ± SE), and cross-context correlations (rIL,H±SE), are printed for each trait. Source data are provided as a Source Data file, total sample size is 326 individuals (172 in low PPL, 154 in high PPL), and code is provided in Supplementary Data 1

References

    1. Vedder O, Bouwhuis S, Sheldon BC. The contribution of an avian top predator to selection in prey species. J. Anim. Ecol. 2014;83:99–106. - PubMed
    1. Davies, N., Krebs, J. & West, S. An Introduction to Behavioural Ecology. (Wiley-Blackwell, Oxford, 2012).
    1. Gotmark F. Predation by sparrowhawks favours early breeding and small broods in great tits. Oecologia. 2002;130:25–32. - PubMed
    1. Verhulst S, Nilsson JAring. The timing of birds’ breeding seasons: a review of experiments that manipulated timing of breeding. Philos. Trans. R. Soc. B Biol. Sci. 2008;363:399–410. - PMC - PubMed
    1. Ims RA. On the adaptive value of reproductive synchrony as a predator-swamping strategy. Am. Nat. 1990;136:485–498.

Publication types