. 2019 Apr 8;9(1):5790.
doi: 10.1038/s41598-019-42286-8.

Neuroinflammation induced by lipopolysaccharide causes cognitive impairment in mice

Affiliations

Neuroinflammation induced by lipopolysaccharide causes cognitive impairment in mice

Jiayi Zhao et al. Sci Rep. .

Abstract

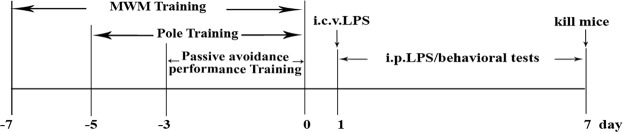
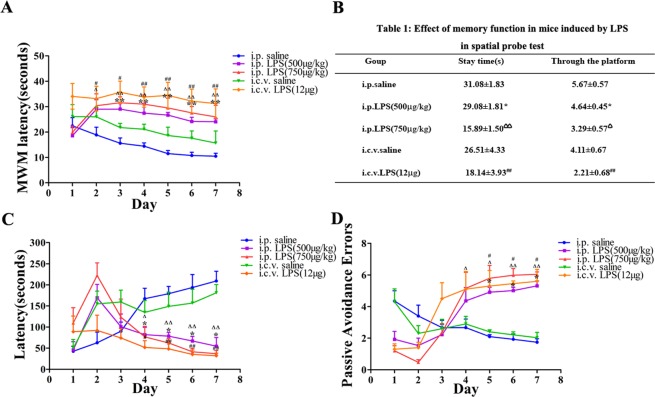
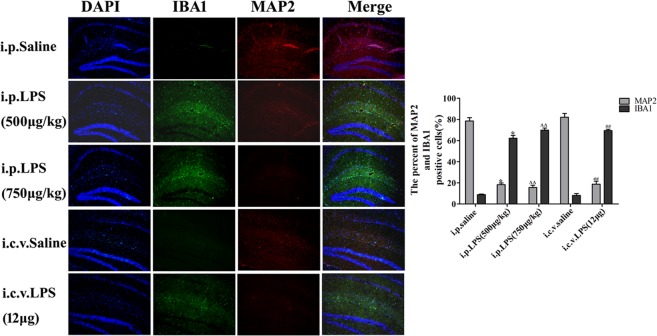
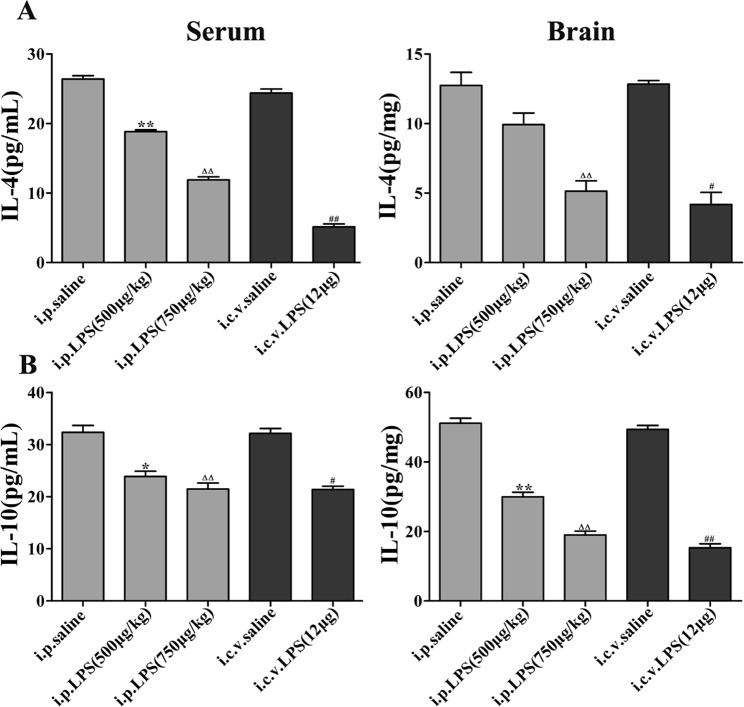
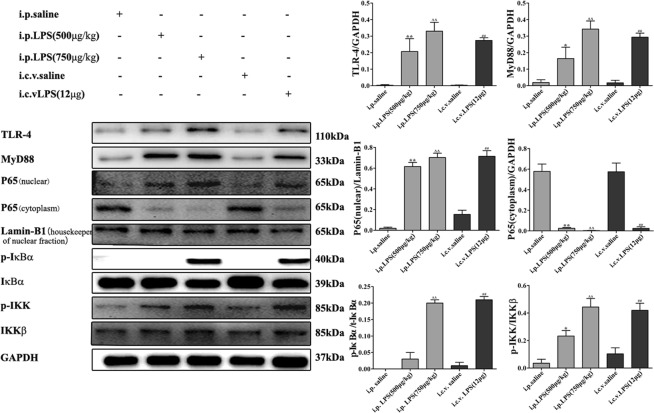
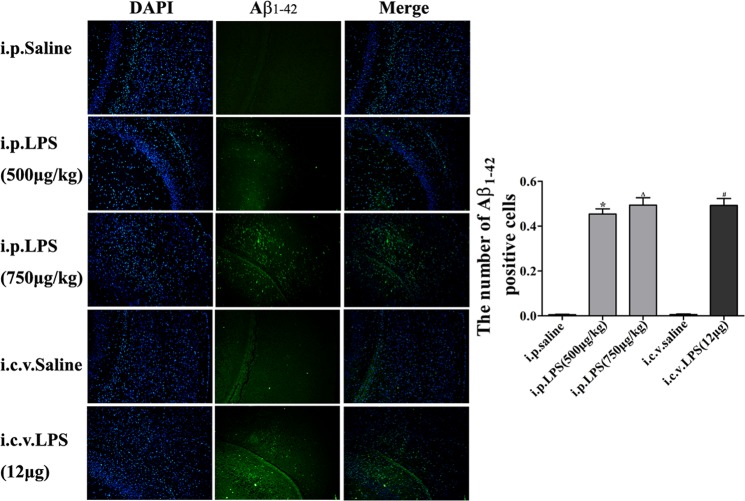
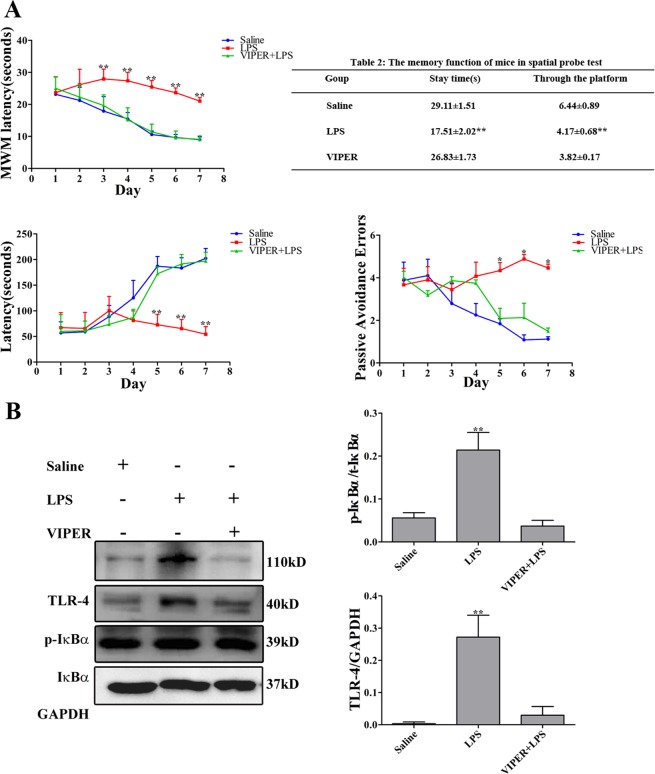
In this study, we investigated lipopolysaccharide (LPS)-induced cognitive impairment and neuroinflammation in C57BL/6J mice by using behavioral tests, immunofluorescence, enzyme-linked immunosorbent assay (ELISA) and Western blot. We found that LPS treatment leads to sickness behavior and cognitive impairment in mice as shown in the Morris water maze and passive avoidance test, and these effects were accompanied by microglia activation (labeled by ionized calcium binding adaptor molecule-1, IBA-1) and neuronal cell loss (labeled by microtubule-associated protein 2, MAP-2) in the hippocampus. The levels of interleukin-4 (IL-4) and interleukin-10 (IL-10) in the serum and brain homogenates were reduced by the LPS treatment, while the levels of tumor necrosis factor-α (TNF-α), interleukin-1β (IL-1β), prostaglandin E2 (PGE2) and nitric oxide (NO) were increased. In addition, LPS promoted the expression of cyclooxygenase-2 (COX-2) and inducible nitric oxide synthase (iNOS) in the brain homogenates. The Western blot analysis showed that the nuclear factor kappa B (NF-κB) signaling pathway was activated in the LPS groups. Furthermore, VIPER, which is a TLR-4-specific inhibitory peptide, prevented the LPS-induced neuroinflammation and cognitive impairment. These data suggest that LPS induced cognitive impairment and neuroinflammation via microglia activation by activating the NF-kB signaling pathway; furthermore, we compared the time points, doses, methods and outcomes of LPS administration between intraperitoneal and intracerebroventricular injections of LPS in LPS-induced neuroinflammation and cognitive impairment, and these data may provide additional insight for researchers performing neuroinflammation research.


Conflict of interest statement

The authors declare no competing interests.

Figures

Figure 1
Figure 1
Illustration of the protocols, including the time line of the experiments and tests.
Figure 2
Figure 2
LPS-induced memory defects in the MWM test and passive avoidance performance test. (A) Mice showed impaired learning and memory function after injections of LPS during the place-navigation test. (B) Mice showed an effect of LPS on memory function during the spatial probe test. C: Latency in the passive avoidance test. D: Error number in the passive avoidance test (n = 10). *P < 0.05, **P < 0.01 LPS-induced (i.p. 500 μg/kg) compared to the i.p. saline group; ΔP < 0.05, ΔΔP < 0.01 LPS-induced (i.p. 750 μg/kg) compared to the i.p. saline group; #P < 0.05, ##P < 0.01, LPS-induced (i.c.v. 12 μg) compared to the i.c.v. saline group.
Figure 3
Figure 3
Motor coordination scores in the LPS-induced mouse model as assessed in mice daily. *P < 0.05, **P < 0.01 LPS (i.p. 500 μg/kg) compared to the i.p. saline group; ΔP < 0.05, ΔΔP < 0.01 LPS (i.p. 750 μg/kg) compared to the i.p. saline group; #P < 0.05, ##P < 0.01, LPS (i.c.v. 12 μg) compared to the i.c.v. saline group.
Figure 4
Figure 4
Expression of MAP-2 and IBA-1 in the LPS-induced mouse model of memory and learning impairment. Immunostaining of IBA-1 (green) and MAP-2 (red) proteins in the hippocampus was performed with specific primary antibodies, quantified images of n = 5 per group. Graph is plotted as the mean + SEM. *P < 0.05, **P < 0.01 LPS (i.p. 500 μg/kg) compared to the i.p. saline group; ΔP < 0.05, ΔΔP < 0.01 LPS (i.p. 750 μg/kg) compared to the i.p. saline group; #P < 0.05, ##P < 0.01, LPS (i.c.v. 12 μg) compared to the i.c.v. saline group.
Figure 5
Figure 5
Expression of proinflammatory cytokines in the LPS-induced mouse model of memory and learning impairment. (AD) The expression of the proinflammatory cytokines IL-1β, TNF-α, PGE2 and NO in serum and brain homogenates. (E) LPS-induced expression of COX-2 and iNOS in the brain; the data were determined by Western blotting. The data are described as the mean ± SEM (n = 10). *P < 0.05, **P < 0.01 LPS (i.p. 500 μg/kg) compared to the i.p. saline group; ΔP < 0.05, ΔΔP < 0.01 LPS (i.p. 750 μg/kg) compared to the i.p. saline group; #P < 0.05, ##P < 0.01, LPS (i.c.v. 12 μg) compared to the i.c.v. saline group.
Figure 6
Figure 6
Expression of anti-inflammatory cytokines in the LPS-induced mouse model of memory and learning impairment. The data are described as the mean ± SEM (n = 10). *P < 0.05, **P < 0.01 LPS (i.p. 500 μg/kg) compared to the i.p. saline group; ΔP < 0.05, ΔΔP < 0.01 LPS (i.p. 750 μg/kg) compared to the i.p. saline group; #P < 0.05, ##P < 0.01, LPS (i.c.v. 12 μg) compared to the i.c.v. saline group.
Figure 7
Figure 7
Effects of different treatments on NF-κB-related proteins in brain homogenates. The data are described as the mean ± SEM (n = 10). *P < 0.05, **P < 0.01 LPS-induced (i.p.500 μg/kg) compared to the i.p. saline group; ΔP < 0.05, ΔΔP < 0.01 LPS-induced (i.p. 750 μg/kg) compared to the i.p. saline group; #P < 0.05, ##P < 0.01, LPS-induced (i.c.v. 12 μg) compared to the i.c.v. saline group.
Figure 8
Figure 8
Effect of LPS on Aβ1–42 accumulation in the hippocampus. Immunostaining of Aβ1–42 (green) in the hippocampus was performed with specific primary antibodies, quantified images of n = 5 per group. Graph is plotted as the mean + SEM. *P < 0.05, **P < 0.01 LPS (i.p. 500 μg/kg) compared to the i.p. saline group; ΔP < 0.05, ΔΔP < 0.01 LPS (i.p. 750 μg/kg) compared to the i.p. saline group; #P < 0.05, ##P < 0.01, LPS (i.c.v. 12 μg) compared to the i.c.v. saline group.
Figure 9
Figure 9
VIPER treatment attenuates cognitive dysfunction and neuroinflammation. (A) Effects of VIPER on LPS-induced memory deficit evaluated by the MWM and passive avoidance performance test. (B,C) VIPER attenuates LPS-induced proinflammatory cytokines and protein accumulation. (n = 10). *P < 0.05, **P < 0.01 LPS-induced (i.p. 750 μg/kg) compared to the i.p. VIPER + LPS group.

References

    1. Allison DJ, Ditor DS. The common inflammatory etiology of depression andcognitive impairment: a therapeutic target. J Neuroinflammation. 2014;11:1–12. doi: 10.1186/s12974-014-0151-1. - DOI - PMC - PubMed
    1. Nguyen MD, Julien JP, Rivest S. Innate immunity: The missing link in neuroprotection and neurodegeneration? Nat Rev Neurosci. 2002;3:216–227. doi: 10.1038/nrn752. - DOI - PubMed
    1. McGeer PL, et al. Reactive microglia are positive for HLA-DR in the substantia nigra of Parkinson’s and Alzheimer’s disease brains. Neurolog. 1988;38:1285–1291. doi: 10.1212/WNL.38.8.1285. - DOI - PubMed
    1. Kiefer R, et al. Transforminggrowth factor-beta 1: a lesion-associated cytokine of the nervous system. Int J Dev Neurosci. 1995;13:331–339. doi: 10.1016/0736-5748(94)00074-D. - DOI - PubMed
    1. Imai F, et al. Neuroprotective effect of exogenous microglia in global brain ischemia. J Cereb Blood Flow Metab. 2007;27:488–500. doi: 10.1038/sj.jcbfm.9600362. - DOI - PubMed

Publication types

MeSH terms