

Yield stability analysis reveals sources of large-scale nitrogen loss from the US Midwest
- PMID: 30962507
- PMCID: PMC6453884
- DOI: 10.1038/s41598-019-42271-1
Yield stability analysis reveals sources of large-scale nitrogen loss from the US Midwest
Abstract
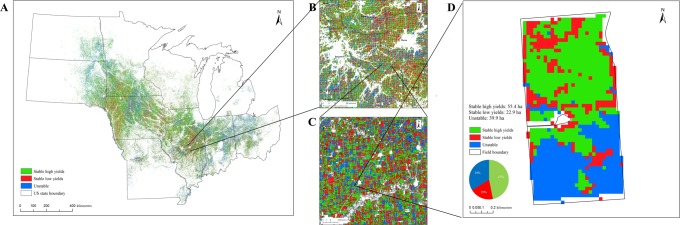
Loss of reactive nitrogen (N) from agricultural fields in the U.S. Midwest is a principal cause of the persistent hypoxic zone in the Gulf of Mexico. We used eight years of high resolution satellite imagery, field boundaries, crop data layers, and yield stability classes to estimate the proportion of N fertilizer removed in harvest (NUE) versus left as surplus N in 8 million corn (Zea mays) fields at subfield resolutions of 30 × 30 m (0.09 ha) across 30 million ha of 10 Midwest states. On average, 26% of subfields in the region could be classified as stable low yield, 28% as unstable (low yield some years, high others), and 46% as stable high yield. NUE varied from 48% in stable low yield areas to 88% in stable high yield areas. We estimate regional average N losses of 1.12 (0.64-1.67) Tg N y-1 from stable and unstable low yield areas, corresponding to USD 485 (267-702) million dollars of fertilizer value, 79 (45-113) TJ of energy, and greenhouse gas emissions of 6.8 (3.4-10.1) MMT CO2 equivalents. Matching N fertilizer rates to crop yield stability classes could reduce regional reactive N losses substantially with no impact on crop yields, thereby enhancing the sustainability of corn-based cropping systems.
Conflict of interest statement
The authors declare no competing interests.
Figures
References
-
- Robertson GP, Vitousek PM. Nitrogen in agriculture: Balancing the cost of an essential resource. Annual Review of Environment and Resources. 2009;34:97–125. doi: 10.1146/annurev.environ.032108.105046. - DOI
-
- Lassaletta L, et al. Nitrogen use in the global food system: past trends and future trajectories of agronomic performance, pollution, trade, and dietary demand. Environmental Research Letters. 2016;11:095007. doi: 10.1088/1748-9326/11/9/095007. - DOI
-
- Mueller ND, et al. Declining spatial efficiency of global cropland nitrogen allocation. Global Biogeochemical Cycles. 2017;31:245–257.
-
- Howarth R, et al. Coupled biogeochemical cycles: eutrophication and hypoxia in temperate estuaries and coastal marine ecosystems. Frontiers in Ecology and the Environment. 2011;9:18–26. doi: 10.1890/100008. - DOI
Publication types
LinkOut - more resources
Full Text Sources
Research Materials
Miscellaneous
