. 2019 May;21(5):579-591.
doi: 10.1038/s41556-019-0305-6. Epub 2019 Apr 8.

ALOX12 is required for p53-mediated tumour suppression through a distinct ferroptosis pathway

Affiliations

ALOX12 is required for p53-mediated tumour suppression through a distinct ferroptosis pathway

Bo Chu et al. Nat Cell Biol. 2019 May.

Abstract

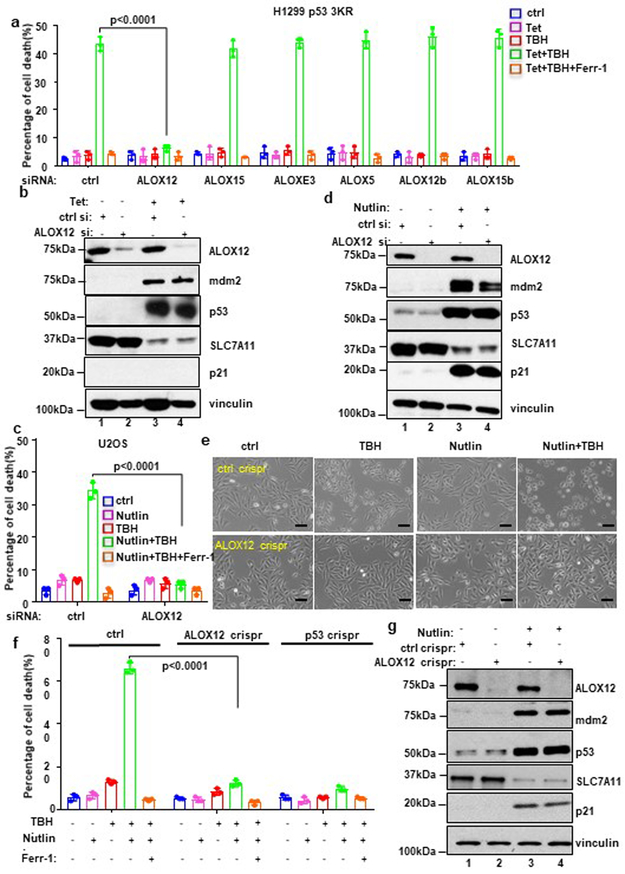
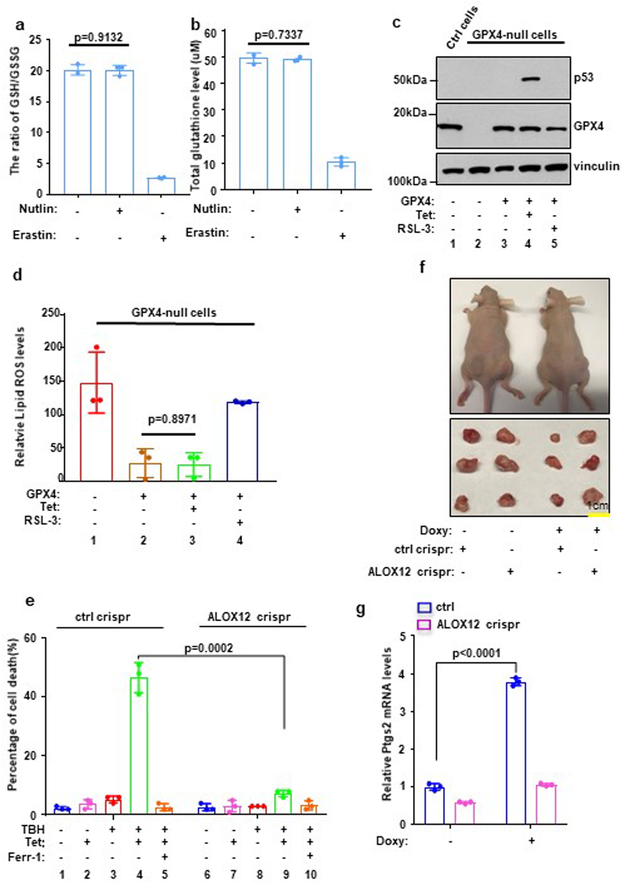
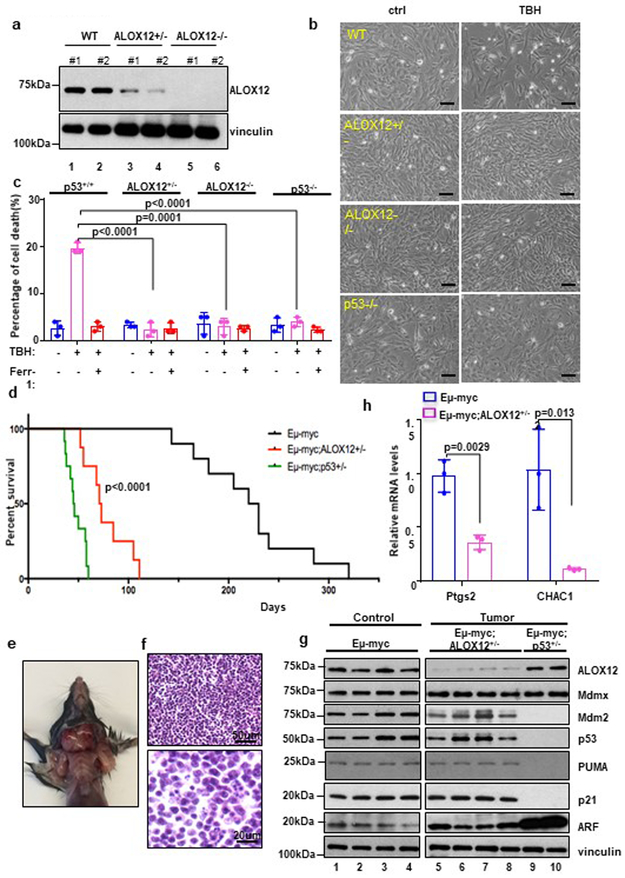
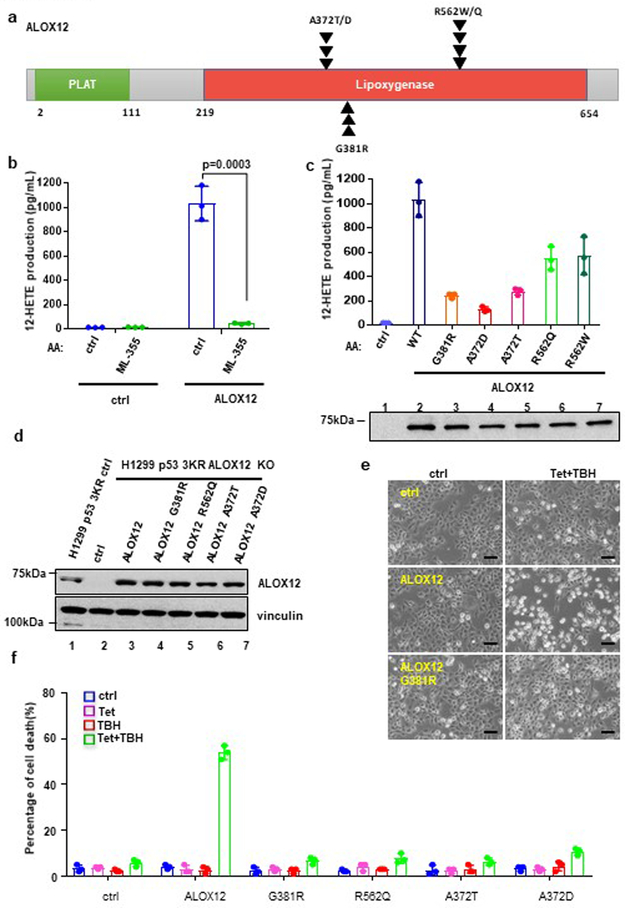
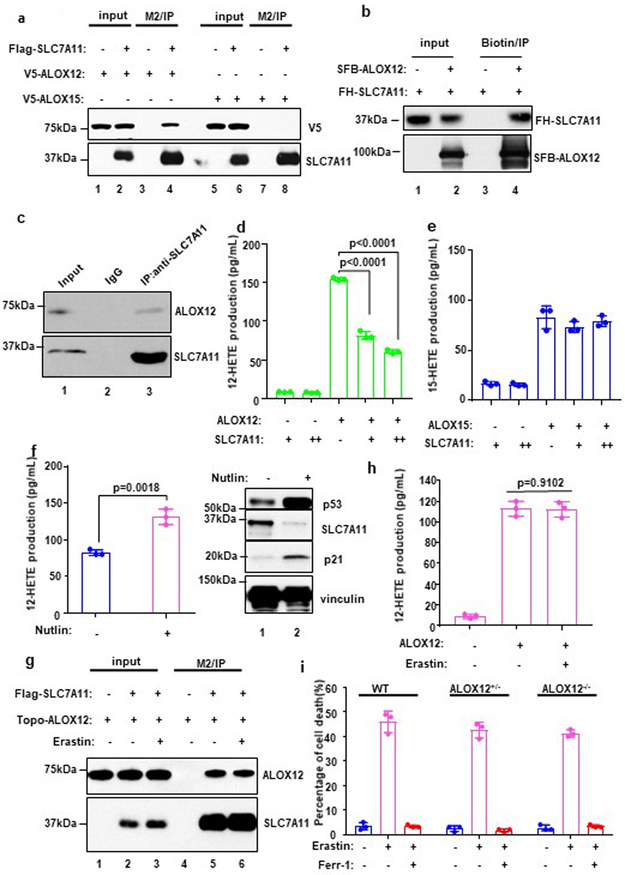
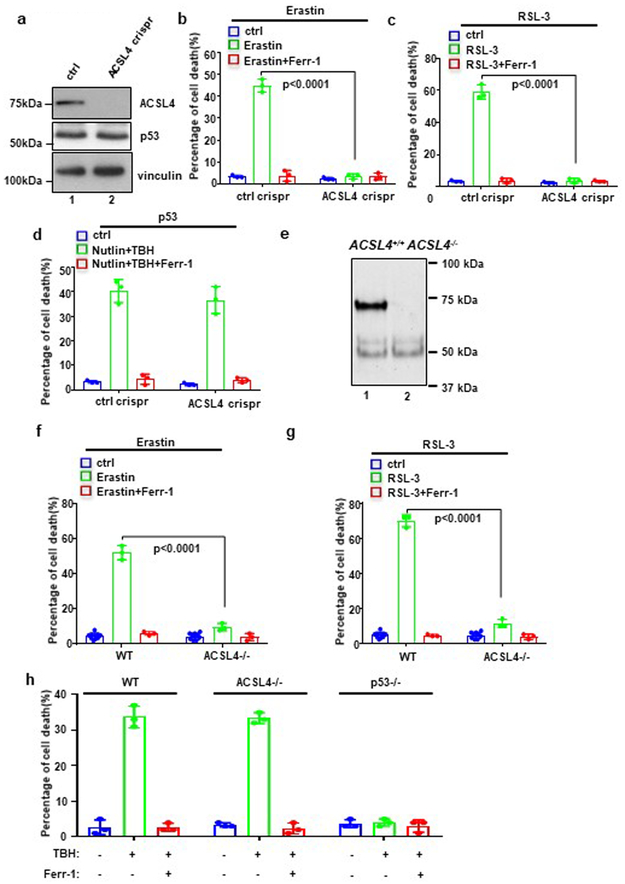
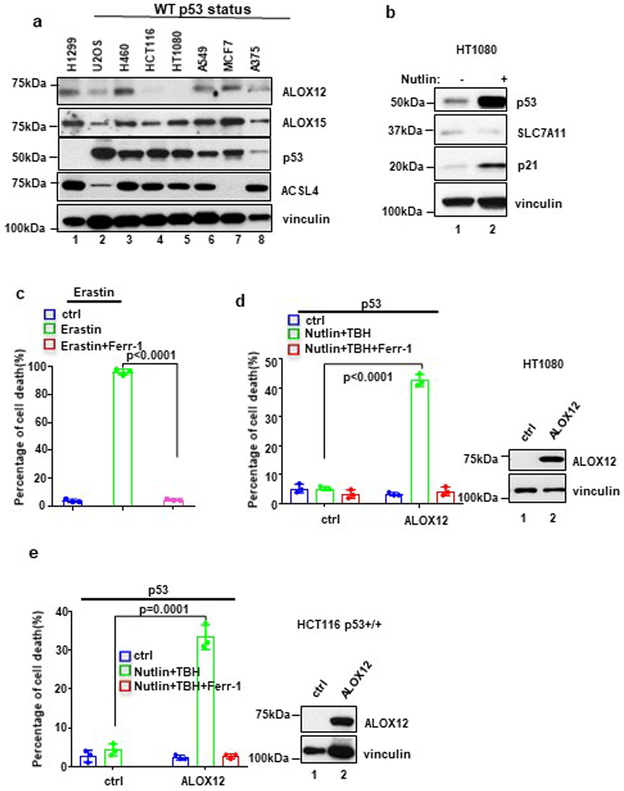
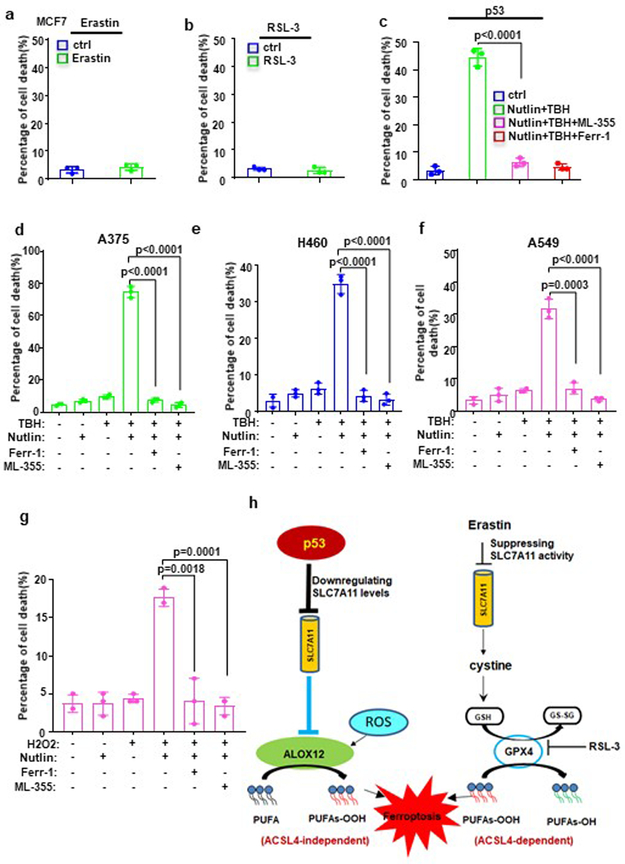
It is well established that ferroptosis is primarily controlled by glutathione peroxidase 4 (GPX4). Surprisingly, we observed that p53 activation modulates ferroptotic responses without apparent effects on GPX4 function. Instead, ALOX12 inactivation diminishes p53-mediated ferroptosis induced by reactive oxygen species stress and abrogates p53-dependent inhibition of tumour growth in xenograft models, suggesting that ALOX12 is critical for p53-mediated ferroptosis. The ALOX12 gene resides on human chromosome 17p13.1, a hotspot of monoallelic deletion in human cancers. Loss of one Alox12 allele is sufficient to accelerate tumorigenesis in Eμ-Myc lymphoma models. Moreover, ALOX12 missense mutations from human cancers abrogate its ability to oxygenate polyunsaturated fatty acids and to induce p53-mediated ferroptosis. Notably, ALOX12 is dispensable for ferroptosis induced by erastin or GPX4 inhibitors; conversely, ACSL4 is required for ferroptosis upon GPX4 inhibition but dispensable for p53-mediated ferroptosis. Thus, our study identifies an ALOX12-mediated, ACSL4-independent ferroptosis pathway that is critical for p53-dependent tumour suppression.


Figures

Figure 1.
Figure 1.. ALOX12 is essential for p53-mediated ferroptosis upon ROS stress.
a) H1299 Tet-on p533KR cells transfected with control siRNA (ctrl) or a pool of ALOX family specific siRNAs pre-incubated with doxycycline (0.5μg/ml; Tet) for 12h, then treated with doxycycline (0.5ug/ml; Tet) and TBH (40uM) as indicated for 8h. Error bars are mean ± s.d., n=3 independent experiments. b) Western blot analysis of H1299 Tet-on p533KR cells transfected with control or ALOX12 siRNA and then treated with doxycycline (0.5μg/ml) as indicated for 24h. The experiments were repeated twice, independently, with similar results. c) U2OS cells transfected with control or ALOX12 siRNA were pre-incubated with Nutlin (10uM) for 12h, then the cells were treated with Nutlin (10uM) and TBH (300uM) as indicated for 8h. Error bars are mean ± s.d., n=3 independent experiments. d) Western blot analysis of U2OS cells transfected with control or ALOX12 siRNA and then treated with Nutlin (10uM) as indicated for 48h. The experiments were repeated twice, independently, with similar results. e) Representative phase-contrast images of U2OS ctrl crispr and ALOX12 crispr cells pre-incubated with Nutlin (10uM) for 12h were treated with TBH (300uM) and Nutlin (10uM) as indicated for 8h. Scale bars, 100μm. The experiments were repeated twice, independently, with similar results. f) U2OS control, ALOX12, and p53 crispr cells pre-incubated with Nutlin (10uM) for 12h were treated with TBH (300uM), Nutlin (10uM), and Ferr-1 (2uM) as indicated for 8h. Error bars are mean ± s.d., n=3 independent experiments. g) Western blot analysis of U2OS control and ALOX12 crispr cells treated with Nutlin (10uM) as indicated for 48h. The experiments were repeated twice, independently, with similar results. All P values (a,c,f) were calculated using two-tailed unpaired Student’s t-test. Detailed statistical tests are described in the Methods. Scanned images of unprocessed blots are shown in Supplementary Fig. 9. Raw data are provided in Supplementary Table 1.
Figure 2.
Figure 2.. ALOX12 is critical for p53-mediated tumor growth suppression.
a) The ratio of reductive GSH to oxidative GSH was measured by GSH/GSSG quantification kit in U2OS cells with or without Nutlin (10uM) or Erastin (10uM) treatment. Error bars are mean ± s.d., n=3 independent experiments. b) Total glutathione levels were measured by GSSG/GSH quantification kit in U2OS cells with or without Nutlin (10uM) or Erastin (10uM) treatment. c) Western blot analysis of H1299 Tet-on p533KR GPX4 crispr cells transfected with GPX4 expression vectors. The experiments were repeated twice, independently, with similar results. d) Quantification of lipid peroxidation levels from Fig. S2d is shown in H1299 Tet-on p533KR control or ALOX12 crispr clones pre-incubated with doxycycline (0.5μg/ml) were treated with doxycycline (0.5μg/ml), and RSL-3 (1uM) as indicated for 8h. Error bars are mean ± s.d., n=3 independent experiments. e) H1299 Tet-on p533KR control or ALOX12 crispr clones pre-incubated with doxycycline (0.5ug/ml) were treated with doxycycline (0.5ug/ml) and TBH (60uM) as indicated for 8h. Error bars are mean ± s.d., n=3 independent experiments. f) Xenograft tumors from H1299 Tet-on p533KR control and ALOX12 crispr cells fed with regular or doxycycline-containing chow (625mg kg−1) as indicated (see methods). The experiments were repeated twice, independently, with similar results. g) Q-PCR of PTGS2 from tumors harvested in f; Error bars are mean ± s.d., n=3 independent experiments. All P values (a,d,e,g) were calculated using two-tailed unpaired Student’s t-test. Detailed statistical tests are described in the Methods. Scanned images of unprocessed blots are shown in Supplementary Fig. 9. Raw data are provided in Supplementary Table 1.
Figure 3.
Figure 3.. Loss of one ALOX12 allele is sufficient to accelerate tumorigenesis in Eμ-Myc lymphoma models.
a) Western blot analysis of wild-type (WT), ALOX12+/−, and ALOX12−/− MEFs. Two representative MEF cell lines for each genotype shown. The experiments were repeated twice, independently, with similar results. b) Representative phase-contrast images of WT, ALOX12+/−, ALOX12−/−, and p53−/− MEFs treated with TBH (80uM) as indicated for 12h. Scale bars, 100μm. The experiments were repeated three times, independently, with similar results. c) WT, ALOX12+/−, ALOX12−/−, and p53−/− MEFs treated with TBH (80uM) as shown in b. Error bars are mean ± s.d., n=3 independent experiments. d) Kaplan-Meier survival curves of Eμ-myc (n=10 independent mice), Eμ-myc; ALOX12+/− (n=8 independent mice), and Eμ-myc; p53+/− (n=12 independent mice). P value (Eμ-myc versus Eμ-myc; ALOX12+/− background) was calculated using log-rank Mantel-Cox test. e) Representative image of an early onset lymphoma in a 45 day-old Eμ-myc; ALOX12+/− mouse. The experiments were repeated three times, independently, with similar results. f) Representative H&E of a high grade diffuse B-cell lymphoma developed from Eμ-myc; ALOX12+/− mouse (Upper panel scale bars, 50μm; Lower panel scale bars, 20μm). The experiments were repeated three times, independently, with similar results. g) Western blot analysis of Eμ-myc control samples and tumor samples from Eμ-myc; ALOX12+/− and Eμ-myc; p53+/− mice. The experiments were repeated twice, independently, with similar results. h) Q-PCR of PTGS2 from tumors harvested from of Eμ-myc control samples (n=3 independent samples) and tumor samples (n=3 independent samples) from Eμ-myc; ALOX12+/− mice. Error bars are mean ± s.d., n=3 independent experiments and P values(c,h) were calculated using two-tailed unpaired Student’s t-test. Detailed statistical tests are described in the Methods. Scanned images of unprocessed blots are shown in Supplementary Fig. 9. Raw data are provided in Supplementary Table 1.
Figure 4.
Figure 4.. ALOX12 missense mutations from human cancers abrogate ALOX12 enzymatic activity and p53-mediated ferroptosis.
a) Schematic diagram of ALOX12 with frequent tumor mutations identified in the Lipoxygenase domain identified from the COSMIC database. b) An in vitro catalytic activity assay of ALOX12 was measured by detecting 12-HETE levels (lipoxygenase activity) by ELISA. Highly purified ALOX12 was incubated with arachidonic acid and ML-355 (ALOX12 inhibitor) as indicated (see methods). Error bars are mean ± s.d., n=3 independent experiments. c) An in vitro catalytic activity assay of ALOX12, as described in b, using indicated ALOX12 tumor mutants as shown in a. Western blot analysis of highly purified ALOX12 proteins (lower panel). The Western blot experiments were repeated twice, independently, with similar results. Error bars are mean ± s.d., n=3 independent experiments. d) Western blot analysis of H1299 Tet-on p533KR ALOX12 crispr cells transfected with control and ALOX12 WT or mutant vectors as indicated. The experiments were repeated twice, independently, with similar results. e) Representative phase-contrast images of H1299 Tet-on p533KR ALOX12 crispr cells transfected with control, ALOX12, or mutant ALOX12 G381R vectors. Cells were pre-incubated with doxycycline (0.5μg/ml) for 12h, then treated with doxycycline (0.5μg/ml) and TBH (60uM) as indicated for 8h. Scale bars, 100μm. The experiments were repeated twice, independently, with similar results. f) The cell death of H1299 Tet-on p533KR ALOX12 crispr cells transfected with control or ALOX12 vectors as indicated, from e is shown. Error bars are mean ± s.d., n=3 independent experiments. All P values (b,c,f) were calculated using two-tailed unpaired Student’s t-test. Detailed statistical tests are described in the Methods. Scanned images of unprocessed blots are shown in Supplementary Fig. 9. Raw data are provided in Supplementary Table 1.
Figure 5.
Figure 5.. Mechanistic insight into p53-mediated activation of ALOX12
a) Western blot analysis of the interaction among SLC7A11, ALOX12 and ALOX15. 293T cells were co-transfected with indicated constructs, and the extract was analyzed by Co-IP assays. The experiments were repeated twice, independently, with similar results. b) In vitro binding assay between purified SLC7A11 and ALOX12. The experiments were repeated twice, independently, with similar results. c) Western blot analysis of endogenous interaction between SLC7A11 and ALOX12 in H1299 cells. The experiments were repeated twice, independently, with similar results. d) An in vivo catalytic activity assay of ALOX12 was measured by detecting 12-HETE levels (lipoxygenase activity) by ELISA. U2OS cells were co-transfected with SLC7A11 and ALOX12. Error bars are mean ± s.d., n=3 independent experiments. e) An in vivo catalytic activity assay of ALOX15 was measured by detecting 12-HETE levels (lipoxygenase activity) by ELISA. U2OS cells were co-transfected with SLC7A11 and ALOX15. Error bars are mean ± s.d., n=3 independent experiments. f) An in vivo catalytic activity assay of ALOX12 was measured by detecting 12-HETE levels (lipoxygenase activity) by ELISA. U2OS cells were transfected with ALOX12 upon Nutlin (10uM) treatment or not. Western blot analysis of U2OS cells with or without Nutlin treatment. Error bars are mean ± s.d., n=3 independent experiments. The Western blot experiments were repeated twice, independently, with similar results. g) Western blot analysis of the interaction between SLC7A11 and ALOX12 with or without Erastin (5uM) treatment. The experiments were repeated twice, independently, with similar results. h) An in vivo catalytic activity assay of ALOX12 was measured by detecting 12-HETE levels (lipoxygenase activity) by ELISA. U2OS cells were transfected with ALOX12 with or without Erastin (5uM) treatment. Error bars are mean ± s.d., n=3 independent experiments. i) WT, ALOX12+/−, ALOX12−/− MEFs were treated with Erastin (10uM) and Ferr-1 (2uM) for 12h. Error bars are mean ± s.d., n=3 independent experiments. All P values (d,e,f,h,i) were calculated using two-tailed unpaired Student’s t-test. Detailed statistical tests are described in the Methods. Scanned images of unprocessed blots are shown in Supplementary Fig. 9. Raw data are provided in Supplementary Table 1.
Figure 6.
Figure 6.. p53-mediated ferroptosis is ALOX12-dependent but ACSL4-independent.
a) Western blot analysis of U2OS ctrl crispr and ACSL4 crispr cells. The experiments were repeated twice, independently, with similar results. b) U2OS control, ACSL4 crispr cells treated with Erastin (20uM) and Ferr-1 (2uM) as indicated for 12h. Error bars are mean ± s.d., n=3 independent experiments. c) U2OS control, ACSL4 crispr cells treated with RSL (4uM) and Ferr-1 (2uM) as indicated for 12h. Error bars are mean ± s.d., n=3 independent experiments. d) U2OS control, ACSL4 crispr cells pre-incubated with Nutlin (10uM) for 12h were treated with TBH (300uM), Nutlin (10uM) and Ferr-1 (2uM) as indicated for 12h. Error bars are mean ± s.d., n=3 independent experiments. e) Western blot analysis of WT and ACSL4−/− MEFs. The experiments were repeated twice, independently, with similar results. f) WT, ACSL4−/− MEFs treated with Erastin (10uM) and Ferr-1 (2uM) as indicated for 9h. Quantification of cell death is shown; Error bars are mean ± s.d., n=3 independent experiments except ctrl n=9. g) WT, ACSL4−/− MEFs treated with RSL-3 (1uM) and Ferr-1 (2uM) as indicated for 9h. Quantification of cell death is shown; Error bars are mean ± s.d., n=3 independent experiments except ctrl n=9. h) WT, ACSL4−/− MEFs pre-incubated with Nutlin (10uM) for 12h were treated with TBH (80uM) and Ferr-1 (2uM) as indicated for 9h. Quantification of cell death is shown; Error bars are mean ± s.d., n=3 independent experiments. All P values (b,c,d,f,g,h) were calculated using two-tailed unpaired Student’s t-test. Detailed statistical tests are described in the Methods. Scanned images of unprocessed blots are shown in Supplementary Fig. 9. Raw data are provided in Supplementary Table 1.
Figure 7.
Figure 7.. Mechanistic insight into p53-mediated ferroptosis.
a) Western blot analysis of a panel of cancer cell lines. The experiments were repeated twice, independently, with similar results. b) Western blot analysis of HT1080 cells with or without Nutlin (10uM) treatment. The experiments were repeated twice, independently, with similar results. c) HT1080 cells treated with Erastin (10uM) and Ferr-1 (2uM) treatment for 8h. Quantification of cell death is shown. Error bars are mean ± s.d., n=3 independent experiments. d) HT1080 cells transfected with ALOX12 were pre-incubated with Nutlin (10uM) for 12h, then treated with TBH (200uM), Nutlin (10uM) and Ferr-1 (2uM) for 8h. Quantification of cell death is shown. Western blot analysis of HT1080 cells transfected with ALOX12. Error bars are mean ± s.d., n=3 independent experiments. The Western blot experiments were repeated twice, independently, with similar results. e) HCT116 p53+/+ cells were pre-incubated with Nutlin (10uM) for 12h, then treated with Nutlin (10uM), TBH (200uM), and Ferr-1 (2uM) as indicated for 12h. Quantification of cell death is shown. Western blot analysis of HCT116 p53+/+ cells transfected with ALOX12. Error bars are mean ± s.d., n=3 independent experiments. All P values (c,d,e) were calculated using two-tailed unpaired Student’s t-test. Detailed statistical tests are described in the Methods. The Western blot experiments were repeated twice, independently, with similar results. Scanned images of unprocessed blots are shown in Supplementary Fig. 9. Raw data are provided in Supplementary Table 1.
Figure 8.
Figure 8.. ALOX12 in regulating p53-mediated ferroptosis in human cancer lines
a) MCF7 cells treated with Erastin (20uM) and Ferr-1 (2uM) as indicated for 12h. Error bars are mean ± s.d., n=3 independent experiments. b) MCF7 cells treated with RSL (4uM) and Ferr-1 (2uM) as indicated for 12h. Error bars are mean ± s.d., n=3 independent experiments. c) MCF7 cells pre-incubated with Nutlin (10uM) for 12h were treated with TBH (100uM), Nutlin (10uM) and Ferr-1 (2uM) as indicated for 12h. Error bars are mean ± s.d., n=3 independent experiments. d) A375 cells pre-incubated with Nutlin (10uM) for 12h were treated with TBH (150uM), Nutlin (10uM), ML-355 (4uM) and Ferr-1 (2uM) as indicated for 8h. Quantification of cell death is shown. Error bars are mean ± s.d., n=3 independent experiments. e) H460 cells pre-incubated with Nutlin (10uM) for 12h were treated with TBH (300uM), Nutlin (10uM), ML-355 (4uM) and Ferr-1 (2uM) as indicated for 8h. Quantification of cell death is shown. Error bars are mean ± s.d., n=3 independent experiments. f) A549 cells pre-incubated with Nutlin (10uM) for 12h were treated with TBH (150uM), Nutlin (10uM), ML-355 (4uM) and Ferr-1 (2uM) as indicated for 8h. Quantification of cell death is shown. Error bars are mean ± s.d., n=3 independent experiments. g) U2OS cells pre-incubated with Nutlin (10uM) for 12h were treated with Nutlin (10uM), H2O2 (100uM), Ferr-1 (2uM), and ML-355 (4uM) as indicated for 48h. The percentage of cell death is shown. Error bars are mean ± s.d., n=3 independent experiments. h) A model of p53-mediated ferroptosis compared to Erastin-induced ferroptosis. All P values (a,b,c,d,e,f,g)were calculated using two-tailed unpaired Student’s t-test. Detailed statistical tests are described in the Methods. Raw data are provided in Supplementary Table 1.

References

    1. Kastenhuber ER & Lowe SW Putting p53 in Context. Cell 170, 1062–1078 (2017). - PMC - PubMed
    1. Jennis M et al. (2016). An African-specific polymorphism in the TP53 gene impairs p53 tumor suppressor function in a mouse model. Genes & development 30, 918–930. - PMC - PubMed
    1. Jiang L et al. Ferroptosis as a p53-mediated activity during tumour suppression. Nature 520, 57–62, doi:10.1038/nature14344 (2015). - DOI - PMC - PubMed
    1. Gao M, Monian P, Quadri N, Ramasamy R & Jiang X Glutaminolysis and Transferrin Regulate Ferroptosis. Molecular cell 59, 298–308, doi:10.1016/j.molcel.2015.06.011 (2015). - DOI - PMC - PubMed
    1. Wang SJ et al. Acetylation Is Crucial for p53-Mediated Ferroptosis and Tumor Suppression. Cell Rep 17, 366–373, doi:10.1016/j.celrep.2016.09.022 (2016). - DOI - PMC - PubMed

Publication types

Substances