. 2019 May;21(5):592-602.
doi: 10.1038/s41556-019-0307-4. Epub 2019 Apr 8.

A complex containing lysine-acetylated actin inhibits the formin INF2

Affiliations

A complex containing lysine-acetylated actin inhibits the formin INF2

Mu A et al. Nat Cell Biol. 2019 May.

Abstract

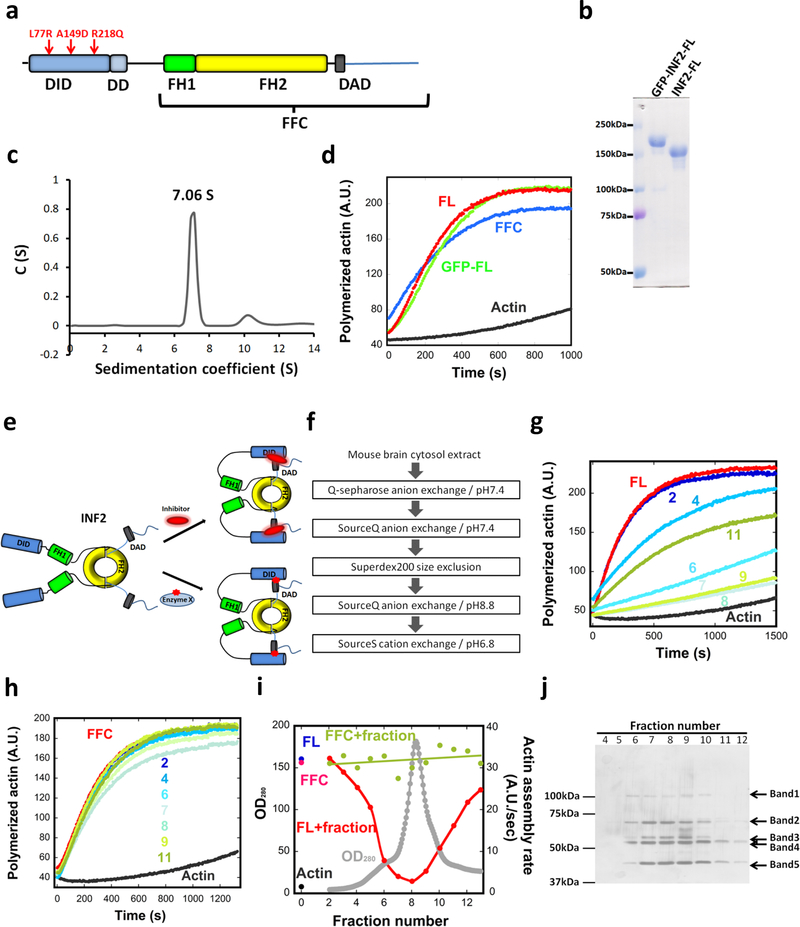
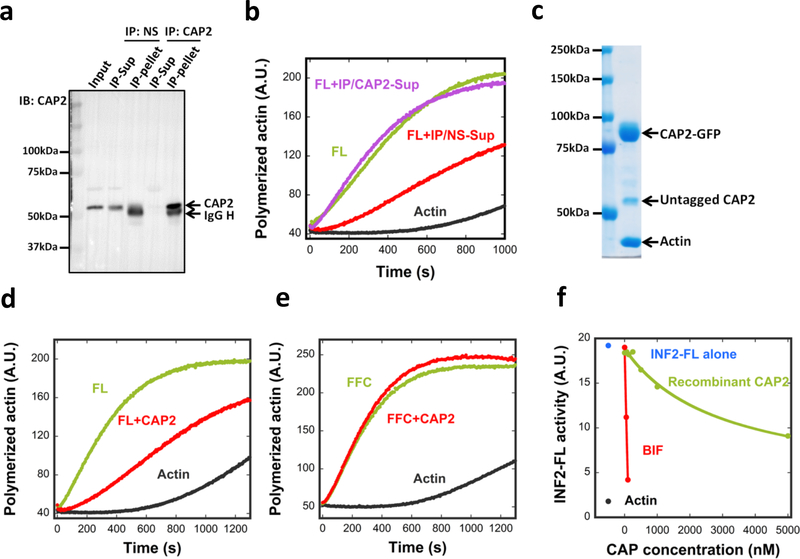
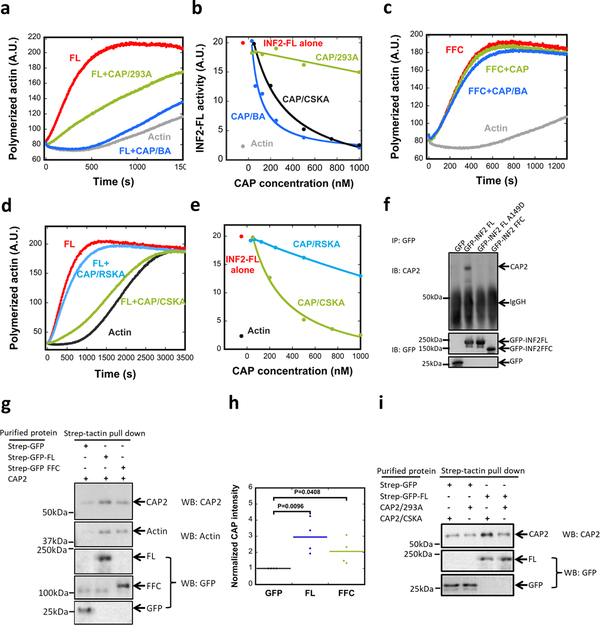
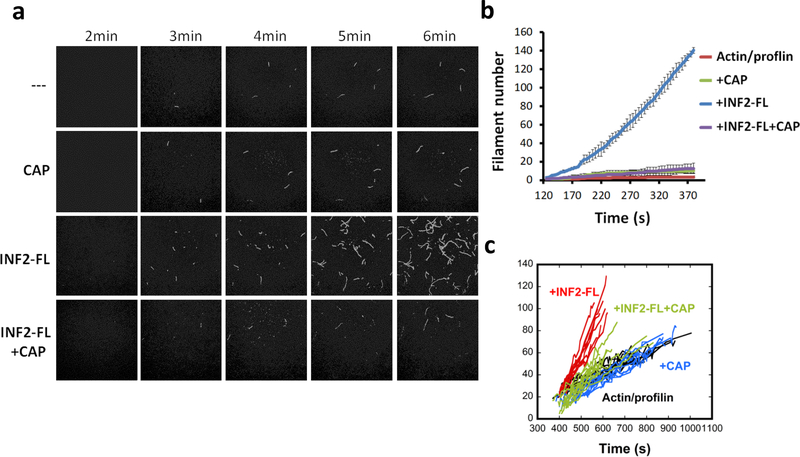
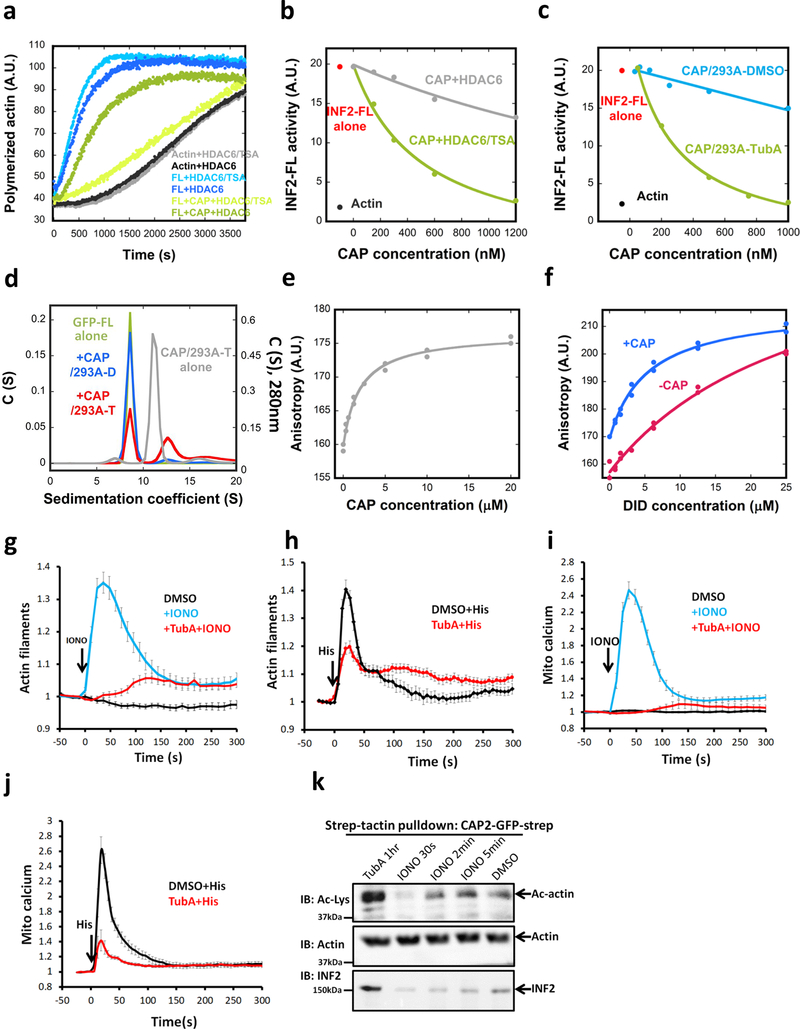
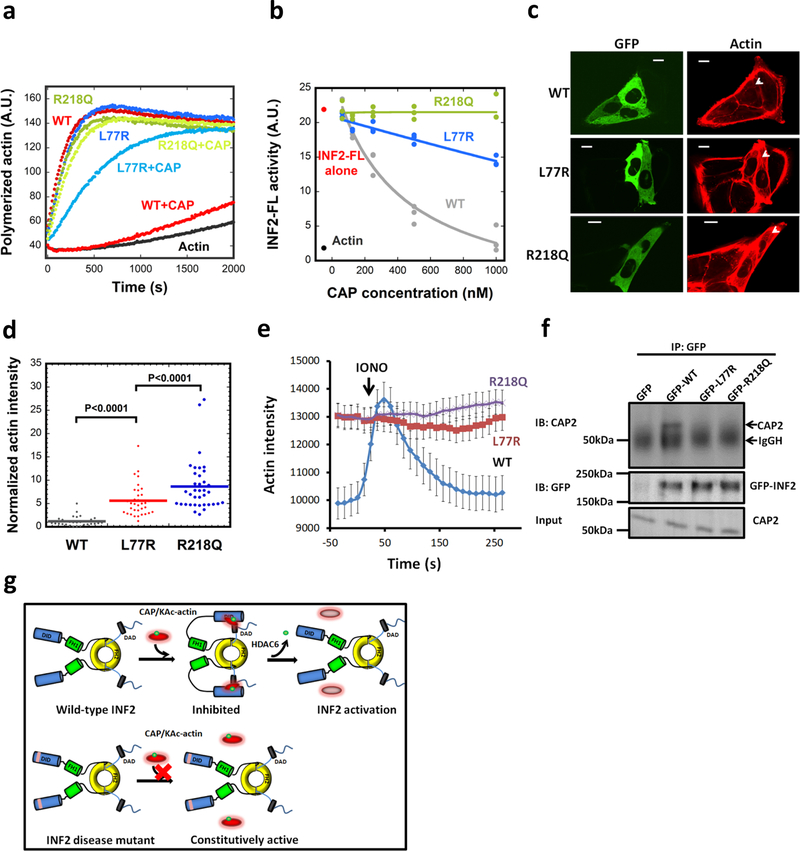
Inverted formin 2 (INF2) is a member of the formin family of actin assembly factors. Dominant missense mutations in INF2 are linked to two diseases: focal segmental glomerulosclerosis, a kidney disease, and Charcot-Marie-Tooth disease, a neuropathy. All of the disease mutations map to the autoinhibitory diaphanous inhibitory domain. Interestingly, purified INF2 is not autoinhibited, suggesting the existence of other cellular inhibitors. Here, we purified an INF2 inhibitor from mouse brain tissue, and identified it as a complex of lysine-acetylated actin (KAc-actin) and cyclase-associated protein (CAP). Inhibition of INF2 by CAP-KAc-actin is dependent on the INF2 diaphanous inhibitory domain (DID). Treatment of CAP-KAc-actin-inhibited INF2 with histone deacetylase 6 releases INF2 inhibition, whereas inhibitors of histone deacetylase 6 block the activation of cellular INF2. Disease-associated INF2 mutants are poorly inhibited by CAP-KAc-actin, suggesting that focal segmental glomerulosclerosis and Charcot-Marie-Tooth disease result from reduced CAP-KAc-actin binding. These findings reveal a role for KAc-actin in the regulation of an actin assembly factor by a mechanism that we call facilitated autoinhibition.


Conflict of interest statement

COMPETING INTERESTS STATEMENT

The authors declare that they have no financial and non-financial competing interests.

Figures

Figure 1.
Figure 1.. Constitutive activity of purified INF2, and inhibition by a brain factor.
(a) Schematic diagram of human INF2-nonCAAX (1240 residues). The A149D mutation disrupts DID/DAD interaction. The R218Q and L77R link to FGSG and CMTD, respectively. Domain boundaries: DID, 32–261; DD, 263–342; FH1, 421–520; FH2, 554–940; DAD, 971–1000. FFC construct: 469–1240. (b) Coomassie-stained SDS-PAGE of purified human INF2-nonCAAX, with and without the GFP-Strep tag. Experiment performed five times with similar results. (c) Sedimentation velocity analytical ultracentrifugation of INF2-nonCAAX (3.8 μM). Mass: 270.3 kDa (sedimentation), 134.6 kDa (sequence). Experiment performed once. (d) Pyrene actin polymerization assay (2μM actin) using 20nM INF2 (with or without GFP-Strep) or INF2 FFC. Experiment performed six times with similar results. (e) Schematic of two possible mechanisms for facilitated autoinhibition of INF2. Upper: direct inhibitor binding. Lower: INF2 post-translational modification (red star). (f) Flow chart of chromatography steps for inhibitor purification. (g) and (h) Representative pyrene-actin assays (2μM actin) containing 20nM INF2-FL (g) or 20nM INF2-FFC (h) with or without indicated BIF fractions (fractions 2–11, from Fig. 2i). Experiment performed once. (i) Graph showing protein elution profile from the final SourceS column (OD280 nm, gray) as well as activities of 20 nM INF2-FL (red) or FFC (green) in pyrene-actin assays on addition of the eluted fraction. Activity of INF2-FL alone (blue), INF2 FFC alone (magenta) and actin alone (black) shown on left side. Experiment performed once. (j) Silver stained SDS-PAGE of indicated fractions from figure 2i. Bands identified as follows: Band1, Exportin1/7; Band 2, VATA and HSP7C; Band 3, CAP1, CAP2, VATB2; Band 4, CAP1, CAP2, VATA; and Band 5, actin. Experiment performed once.
Figure 2.
Figure 2.. CAP/actin is an INF2 inhibitor.
Immuno-depletion of CAP2. An INF2-inhibiting fraction from mouse brain (Fraction 38–40 pool from SourceQ#1 (Fig. S2a)) was incubated with either a nonspecific AB (NS) or anti-CAP2 AB followed by precipitation using Protein A beads. CAP2 protein in input, supernatant and pellet detected by western blot. AB heavy chain, IgG H. Experiment performed once. (b) Pyrene-actin polymerization assay (2μM actin monomer, 5% pyrene) testing inhibitory activity of immune-depleted supernatants on 20nM INF2-FL. IP/NS-Sup: non-specific antibody supernatant. IP/CAP2-Sup: anti-CAP2 supernatant. Experiment performed once in triplicate. (c) Coomassie stained SDS-PAGE of co-expressed CAP1-GFP/CAP2-GFP purified from HEK293 cells. Experiment performed 24 times with similar results. (d) and (e) Pyrene-actin polymerization assay (2μM actin monomer, 5% pyrene) testing effect of co-expressed CAP1/2 (5 μM, untagged) on 20nM INF2-FL (d) or on 20nM INF2 FFC (e). Experiment performed five times with similar results. (f) Comparing inhibitory activities of recombinant CAP (green) and CAP in BIF (red) on INF2-FL (20nM) in pyrene-actin assays. Assembly rate of actin alone (black) and with INF2-FL (blue) also shown. CAP concentration in BIF determined as described in Methods. Experiment performed five times with similar results for recombinant CAP, and once for BIF.
Figure 3.
Figure 3.. Actin-dependent differences in INF2 inhibition by CAP/actin.
(a) Pyrene-actin polymerization assay (2μM actin monomer, 5% pyrene) containing 20nM GFP-INF2-FL in the presence or absence of 5μM purified CAP2-GFP (CAP/293A) or 250nM CAP2-GFP exchanged with brain actin (CAP/BA). Experiment conducted once in triplicate. (b) Concentration dependence of INF2 activity inhibition by CAP/293A, CAP/BA, or by CAP exchanged with chicken muscle actin (CAP/CSKA). Experiment conducted once in triplicate. (c) Pyrene-actin polymerization assay (2μM actin monomer, 5% pyrene) containing 20nM GFP-INF2 FFC in the presence or absence of 250nM CAP/293A or CAP/BA. Experiment conducted once in triplicate. (d) Pyrene-actin polymerization assay (2μM actin monomer, 5% pyrene) containing 20nM GFP-INF2 full-length in the presence or absence of 1μM CAP/CSKA or CAP/RSKA (rabbit muscle actin). Experiment conducted three (CAP/CSKA) or four times (CAP/RSKA) in triplicate. (e) Concentration dependence of INF2 inhibition by recombinant CAP2 exchanged with CAP/CSKA or CAP/RSKA. Experiment conducted once in triplicate. (f) Co-immunoprecipitation assay of endogenous CAP2 with transfected GFP-fusion proteins: GFP alone, GFP-INF2-FL, GFP-INF2FL A149D mutant, and GFP-INF2-FFC. Top panel: anti-CAP2 western on precipitated samples. Bottom panel: anti-GFP western on same samples. Experiment conducted two times. (g) Strep-tactin pull-downs performed with 1μM bead-bound strep-tagged GFP (control), strep-tagged GFP-INF2 full-length, or strep-tagged GFP-INF2 FFC. These were mixed with 2μM untagged CAP exchanged with chicken muscle actin (CAP/CSKA). Bound samples were analyzed by immunoblotting with anti-CAP2, anti-actin and anti-GFP. Experiment conducted three times. (h) Quantification of bound CAP2 from pull-downs as in Fig. 3g. CAP2 intensity from immunoblots normalized to strep-GFP pulldown. Bars, mean. Error bars, S.E.M. (n = 4 experiments). P values, one-sided student’s t-test. (i) Strep-tactin pull-downs performed with 1μM bead-bound strep-tagged GFP (control), or strep-tagged GFP-INF2 full-length. These were mixed with 2μM untagged CAP exchanged with chicken muscle actin (CAP/CSKA) or w/o exchange (CAP/293A). Bound samples analyzed by immunoblotting with anti-CAP2 and anti-GFP. Experiment conducted two times.
Figure 4.
Figure 4.. CAP inhibits INF2 mediated nucleation observed by TIRF microscopy.
Time-lapse TIRF microscopy images showing actin polymerization (1μM actin monomer, 10% TAMRA-actin) containing 3μM profilin in the presence or absence of 1nM INF2-FL and 50nM CAP2 exchanged with CSKA. (b) Quantification of filament number over time for TIRF assays. Three microscope fields analyzed for INF2 FL, and five fields for other conditions. Centre value represents mean and error bars are standard error of the mean. (c) Measurement of filament length over time for TIRF assays. 10 filaments for each condition.
Figure 5.
Figure 5.. Acetylation-induced regulation of INF2 biochemically and in cells.
Pyrene actin polymerization assay (2μM actin monomer) containing 20nM GFP-INF2-FL in the presence or absence of 1μM CSKA-exchanged CAP2 (CAP2/CSKA) after pre-incubation with either HDAC6/TSA (HDAC6 with its inhibitor, TSA) or HDAC6 alone. Experiment conducted twice in triplicate. (b) Concentration dependence of CAP2/CSKA inhibition of INF2-FL after pre-treatment with HDAC6/TSA or HDAC6 alone. Experiment conducted twice. (c) Concentration dependence of INF2 inhibition by CAP2/293A purified from cells pretreated with DMSO or 50μM Tubastatin A for 1hr prior to lysis and purification. Experiment conducted four times. (d) Sedimentation velocity analytical ultracentrifugation of GFP-INF2-FL (1.8μM), with or w/o 18μM CAP2/293A-D or CAP2/293A-T. Mass of GFP-INF2-FL: 325.2 kDa (from sedimentation), 161.3 kDa (from sequence). Left axis: 490 nm (GFP-INF2), right axis, 280 nm (CAP). Experiment conducted once. (e) Fluorescence anisotropy for CAP2/293A-T binding by INF2-Cterm (100 nM). Experiment conducted once. (f) Fluorescence anisotropy for INF2-Nterm binding to INF2-Cterm (100 nM) in presence or absence of CAP2/293-T (20 μM). Additional values at 48 μM INF2-Nterm, not present on graph but accounted for in the fit curves, are 217 for -CAP and 211 for +CAP. Experiment conducted once. (g) Ionomycin-induced changes in actin filaments in U2OS cells pretreated with either DMSO or 50μM TubA. Mean and S.E.M. shown. N = 40, 38 and 48 independent cells for DMSO, IONO, and IONO+TubA, repectively. (h) Histamine-induced changes on actin filaments in U2OS cells pretreated with either DMSO or 50μM TubA. Mean and S.E.M. shown. N = 15 independent cells for both conditions. (i) Ionomycin-induced changes on mitochondrial calcium levels in U2OS cells pretreated with either DMSO or 50μM TubA. Mean and S.E.M. shown. N = 29, 28, and 22 independent cells for DMSO, IONO, and IONO+TubA, respectively. (j) Histamine-induced changes on mitochondrial calcium in U2OS cells pretreated with either DMSO or 50μM TubA. Mean and S.E.M. shown. N = 15 independent cells for both conditions. (k) Strep-tactin pull-downs performed with cell lysates of U2OS cells overexpressing CAP2-GFP-2xStrep. Cells treated identically prior to lysis. CAP2-GFP was isolated, and CAP2-bound actin and probed by western using anti-actin and anti-Ac-Lys antibodies. Experiment conducted once.
Figure 6.
Figure 6.. INF2 disease mutants display decreased regulation by CAP/actin.
(a) Pyrene-actin polymerization assay (2μM actin monomer, 5% pyrene) containing 20nM GFP-INF2 wildtype (WT) or mutants (FSGS mutant R218Q, CMTD mutant L77R) in presence or absence of 1μM CAP2/CSKA. Experiment conducted two times in triplicate. (b) Concentration dependence of CAP2/293A-T inhibition of INF2-FL and disease mutants, in pyrene-actin assays conducted as in panel a. Experiment conducted once (1000 nM CAP points conducted twice) in triplicate. (c) Representative GFP and TRITC-phalloidin confocal microscopy images showing cytosolic actin polymerization by exogenously expressed GFP-INF2 constructs (WT, L77R, or R218Q) in INF2-KO U2OS cells. Cells were fixed and stained with TRITC-phalloidin to label actin filaments. Images are maximum intensity projections of three confocal imaging planes in the middle z region of the cell. Bar, 10 μm. (d) Normalized fluorescence intensity of TRITC-phalloidin was quantified from images similar to (c). Lines represent mean (WT: n=31 cells, mean=1.19, STD=1.02; L77R: n=34 cells, mean=5.60, STD=3.40; R218Q: n=37 cells, mean=8.63, STD=5.47). p values determined by one-sided student’s t-test. (e) Time course of ionomycin-induced changes in actin filaments in INF2-KO U2OS cells expressing GFP-fusions of INF2 WT or the indicated mutants along with mApple-Ftractin. Mean and S.E.M. shown. N = 34, 35, and 33 cells for WT, L77R and R218Q, respectively. (f) Co-immunoprecipitation assay of endogenous CAP2 with transfected GFP-fusion proteins: GFP alone, GFP-INF2-FL, GFP-INF2FL L77R mutant, and GFP-INF2FL R218Q mutant. Top panel: anti-CAP2 western on precipitated samples (IgGH, IgG heavy chain from the IP). Middle panel: anti-GFP western showing GFP-INF2 in precipitated samples. Bottom panel: anti-CAP2 western of input samples. Experiment conducted once. (g) Schematic model of INF2 facilitated autoinhibition by CAP/KAc-actin, and activation by HDAC6-mediated actin de-acetylation. INF2 mutants linked with FSGS and CMTD are defective in CAP/KAc-actin binding, leading to constitutive activity.

Comment in

Similar articles

Cited by

References

    1. Pufall MA & Graves BJ Autoinhibitory domains: modular effectors of cellular regulation. Annu Rev Cell Dev Biol 18, 421–462 (2002). - PubMed
    1. Torres E & Rosen MK Contingent phosphorylation/dephosphorylation provides a mechanism of molecular memory in WASP. Mol Cell 11, 1215–1227 (2003). - PubMed
    1. Campellone KG & Welch MD A nucleator arms race: cellular control of actin assembly. Nature Reviews Molecular Cell Biology 11, 237–251 (2010). - PMC - PubMed
    1. Goode BL & Eck MJ Mechanism and Function of Formins in Control of Actin Assembly. Annu Rev Biochem (2007). - PubMed
    1. Higgs HN Formin proteins: a domain-based approach. Trends Biochem Sci 30, 342–353 (2005). - PubMed

Publication types

MeSH terms