. 2019 May;20(5):637-651.
doi: 10.1038/s41590-019-0347-8. Epub 2019 Apr 8.

Transcriptome networks identify mechanisms of viral and nonviral asthma exacerbations in children

Affiliations

Transcriptome networks identify mechanisms of viral and nonviral asthma exacerbations in children

Matthew C Altman et al. Nat Immunol. 2019 May.

Abstract

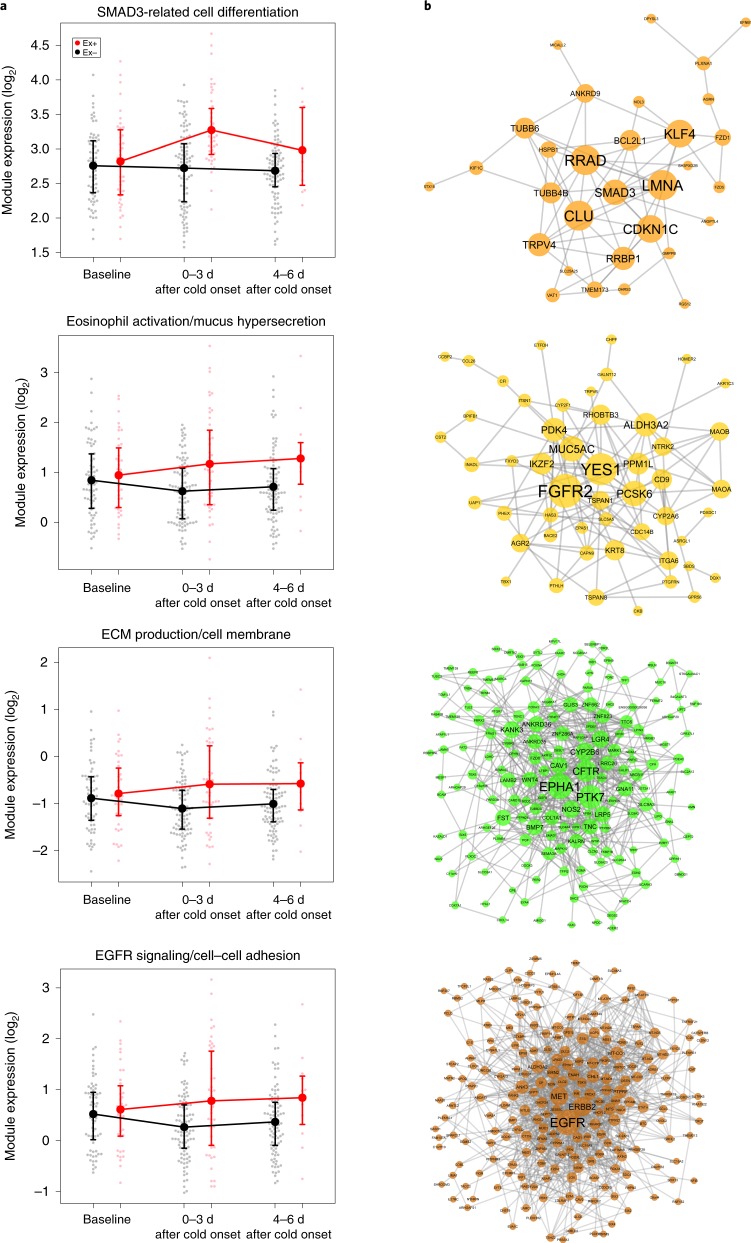
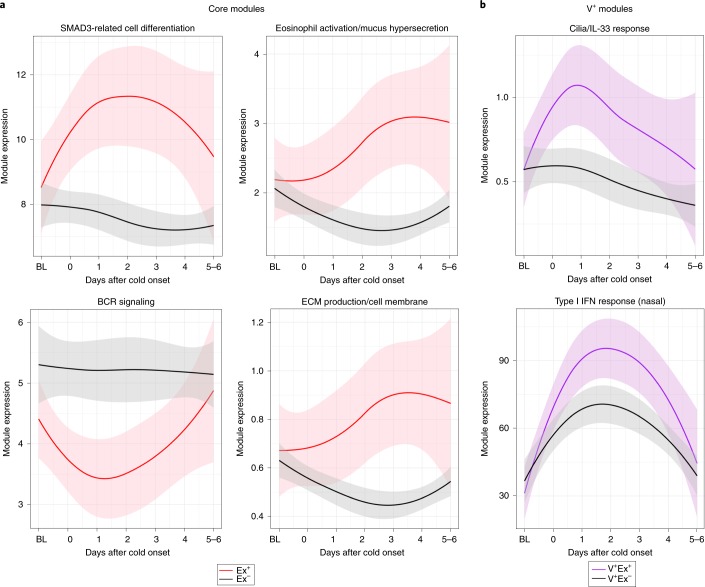
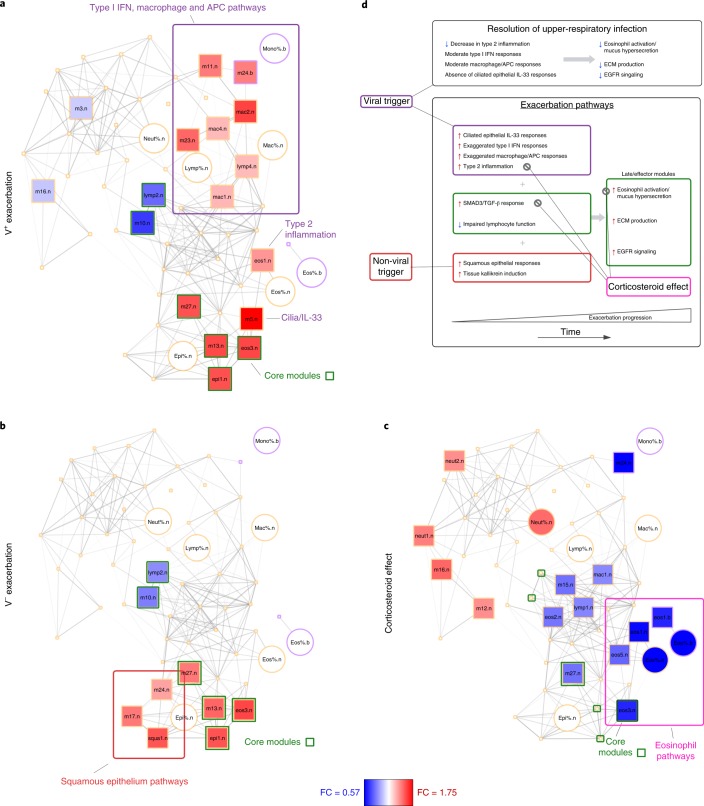
Respiratory infections are common precursors to asthma exacerbations in children, but molecular immune responses that determine whether and how an infection causes an exacerbation are poorly understood. By using systems-scale network analysis, we identify repertoires of cellular transcriptional pathways that lead to and underlie distinct patterns of asthma exacerbation. Specifically, in both virus-associated and nonviral exacerbations, we demonstrate a set of core exacerbation modules, among which epithelial-associated SMAD3 signaling is upregulated and lymphocyte response pathways are downregulated early in exacerbation, followed by later upregulation of effector pathways including epidermal growth factor receptor signaling, extracellular matrix production, mucus hypersecretion, and eosinophil activation. We show an additional set of multiple inflammatory cell pathways involved in virus-associated exacerbations, in contrast to squamous cell pathways associated with nonviral exacerbations. Our work introduces an in vivo molecular platform to investigate, in a clinical setting, both the mechanisms of disease pathogenesis and therapeutic targets to modify exacerbations.


Conflict of interest statement

M.A.G. reports consulting fees from the American Academy of Allergy, Asthma, and Immunology and the American Academy of Pediatrics. A.H.L. reports consulting fees from Merck Sharp & Dohme and reports data-monitoring committee membership for an asthma study conducted by GlaxoSmithKline. R.S.G. reports employment as a special government employee with the Center for Biologics Evaluation and Research and consulting fees from the Consulting Massachusetts Medical Society. G.T.O. reports consulting fees from AstraZeneca and reports a grant from Janssen Pharmaceuticals paid to his employing institution. J.A.P. reports provision of study drugs from GlaxoSmithKline, Teva, Merck, Boehringer-Ingelheim, and Genentech/Novartis for research studies outside of the scope of the submitted work. C.M.K. reports consulting fees from GlaxoSmithKline. E.M.Z. reports consulting fees from Wayne State University. S.J.T. reports consulting fees from Novartis, grants from PCORI, the Fight for Children Foundation, EJF Philanthropies, and NIH/NHLBI, and royalties from Uptodate. M.K. reports consulting fees from Novartis. L.B.B. reports consulting fees from Aerocrine, GlaxoSmithKline, Genentech/Novartis, Merck, Cephalon, DBV Technologies, Teva, Boehringer-Ingelheim, AstraZeneca, WebMD/Medscape, Sanofi, Vectura, and Circassia. J.E.G. reports consulting fees from Janssen, Regeneron, and PReP Biosciences and travel expenses from Boehringer-Ingelheim. W.W.B. reports consulting fees from Boston Scientific, ICON, Novartis, GlaxoSmithKline, Genentech, Roche, Boehringer-Ingelheim, Sanofi Genzyme, AstraZeneca, Teva, 3M, PrEPBiopharm, Circassia, Regeneron, Peptinnovate, and Elsevier. D.J.J. reports consulting fees from Novartis, GlaxoSmithKline, Boehringer-Ingelheim, Pfizer, Commense, and Vectura and a grant from NIH/NHLBI. M.C.A., D.C.B., E.W., B.S., B.J., G.K.K.H., C.C.J., A.B., S.M.S., S.P., P.J.G., L.M.W., and A.T. have nothing to disclose.

Figures

Fig. 1
Fig. 1. Study design and primary and secondary endpoints.
208 children with exacerbation-prone asthma were enrolled according to the inclusion criteria. All participants had baseline samples collected and were prospectively monitored for the onset of cold symptoms (events) during a 6-month period. 106 of the 208 participants came in during one or more events and had sufficient samples collected for analysis. Events were grouped as exacerbations (Ex+) or not exacerbations (Ex), depending on whether the event led to clinical symptoms that resulted in systemic corticosteroid use within 10 d of event onset or resolved without treatment with systemic corticosteroids. The primary endpoint compared Ex+ events (n = 47) to Ex events (n = 107). On the basis of nasal virus PCR results, events were further classified as virus associated (V+) or nonviral (V). The secondary endpoint compared V+Ex+ (n = 33), VEx+ (n = 14), V+Ex (n = 69), and VEx (n = 38) events.
Fig. 2
Fig. 2. Pulmonary function declines during colds that lead to an exacerbation.
Pulmonary function measured by FEV1 predicted (%) and FEV1/FVC ratio was similar at baseline in participants in the Ex+ (red) and Ex (black) event groups and showed a significant decline during reported cold symptoms in Ex+ events but not in Ex events. Data are shown as the mean, interquartile range, and all data points. P values for comparison of the Ex+ and Ex groups are as follows: FEV1 predicted (%) at 0–3 d, P = 4.7 × 10–6; FEV1 predicted (%) at 4–6 d, P = 7.1 × 10–8; FEV1/FVC at 0–3 d, P = 2.3 × 10–5; FEV1/FVC at 4–6 d, P = 4.6 × 10–3. The number of measurements represented for each group and time point is as follows: Ex+ at baseline, n = 43; Ex+ at 0–3 d, n = 45; Ex+ at 4–6 d, n = 42; Ex at baseline, n = 82; Ex at 0–3 d, n = 103; Ex at 4–6 d, n = 97. 19 participants who had one Ex+ and one Ex event have the same measurement shown for Ex+ at baseline and Ex at baseline. All measurements shown are otherwise biologically independent. Comparisons were performed by using a generalized linear mixed model with a random effect for participant to account for correlation between values from the same participant.
Fig. 3
Fig. 3. Four core exacerbation modules are upregulated in cold events that lead to exacerbations.
a, Expression levels for the four most significantly different nasal gene expression modules that had increased expression in Ex+ events as compared to Ex events. FDR values from top to bottom are 2.0 × 10–7, 1.9 × 10–5, 1.9 × 10–5, and 5.6 × 10–5. Expression levels represent the log base 2 of the geometric mean for normalized expression of all genes within the module. Shown are group mean values, interquartile range, and all data points. Sample sizes are as follows: Ex+ at baseline, n = 38; Ex+ at 0–3 d, n = 44; Ex+ at 4–6 d, n = 11; Ex at baseline, n = 68; Ex at 0–3 d, n = 97; Ex at 4–6 d, n = 95. 18 participants who had one Ex+ and one Ex event have the same measurement shown for Ex+ at baseline and Ex at baseline. All measurements shown are otherwise biologically independent. Comparisons were performed by using a weighted linear model and empirical Bayes method, including terms for exacerbation status, cell percentages, presence or absence of virus, visit, and library sequencing depth with a random effect included for participant. b, Gene–gene associations for each of the four modules demonstrate significant interaction networks centered around key genes. Genes are represented as circular nodes, and known gene–gene interactions from STRING are shown as connecting edges. The size of each node is proportional to the number of interactions. The networks are drawn as force-directed graphs, meaning that genes toward the center have the greatest centrality within the network. STRING enrichment P values from top to bottom are 1.3 × 10–4, 9.3 × 10–6, 7.1 × 10–13, and <1.0 × 10–16.
Fig. 4
Fig. 4. Longitudinal dynamics of module expression show patterns of sequential module activation.
a, Among the core exacerbation modules, expression in the epithelial-associated ‘SMAD3-related cell differentiation’ module peaked early in the Ex+ group (FDR = 4.7 × 10–5) while expression in the ‘BCR signaling’ (FDR = 1.0 × 10–3) and ‘lymphocyte proliferation’ (FDR = 4.7 × 10–5; data not shown) modules nadired early. Expression in the ‘eosinophil activation/mucus hypersecretion’ (FDR = 1.3 × 10–3), ‘ECM production/cell membrane’ (FDR = 2.1 × 10–3), and ‘EGFR signaling/cell–cell adhesion’ (FDR = 4.0 × 10–3; data not shown) modules increased over time in the Ex+ group. Sample sizes are as follows: Ex+, n = 92; Ex, n = 244; biologically independent samples. b, In V+Ex+ events, expression of genes in the ‘cilia/IL-33 response’ module is an early and specific event, with expression peaking in the first day and decreasing over time in V+Ex events (FDR = 5.9 × 10–3). The nasal ‘type I IFN response’ (FDR = 0.19) and ‘HSPs/stress response’ (FDR = 9.6 × 10–3) modules and macrophage-associated ‘chemoattraction/cytotoxicity’ (FDR = 0.19) and ‘APP’ (FDR = 0.12) modules all had higher peak expression and area under the curve values in V+Ex+ events. The nasal ‘type I IFN response’ module is shown as a representative example for these modules, all of which exhibited similar dynamics. For nasal data, sample sizes were as follows: V+Ex+, n = 67; V+Ex, n = 157; biologically independent samples. For blood data, sample sizes were as follows: V+Ex+, n = 64; V+Ex, n = 147; biologically independent samples. Longitudinal data are plotted with a 95% confidence interval (shaded region) estimated by local second-degree polynomial regression. To assess significance, a linear model was fit with a B-spline basis for a polynomial spline with degree 2 for days after cold onset and ANOVA was run to determine whether exacerbation status was significant.
Fig. 5
Fig. 5. The ratio of expression for the ‘type 2 inflammation’ and ‘type I IFN response’ modules predicts exacerbation risk.
a, Kaplan–Meier analysis demonstrates that the ratio of expression in the nasal ‘type 2 inflammation’ module to expression in the nasal ‘type I IFN response’ module at the baseline healthy visit is predictive of the time to a participant’s next asthma exacerbation. Individuals in the highest quartile for this expression ratio (quartile 1; n = 23) had a significantly shorter time to exacerbation than individuals in the lower three quartiles (quartiles 2–4; n = 69) (P = 2.6 × 10–4; the lower three quartiles were not statistically different from one another), and they had >50% risk of an exacerbation in the first 30 d after the baseline visit. b, In comparison, Kaplan–Meier analysis demonstrates that baseline FEV1 predicted (%) does not significantly predict time to the next exacerbation, when individuals are split into those with FEV1 predicted <80% (n = 21) and those with FEV1 predicted ≥80% (n = 82) (P = 0.11). The same is true when individuals are split into quartiles according to FEV1 predicted (P = 0.3; data not shown). All samples shown are biologically independent. Shaded regions represent 1 s.d. log confidence intervals. Plus symbols represent censored observations.
Fig. 6
Fig. 6. Systemic corticosteroids affect only a subset of exacerbation modules.
a, Among the core exacerbation modules, ‘eosinophil activation/mucus hypersecretion’ and ‘SMAD3-related cell differentiation’ showed decreased expression after systemic corticosteroids were started (post-CS) in comparison to expression levels before systemic corticosteroids were started (pre-CS) (FDR = 4.6 × 10–2 and FDR = 7.1 × 10–2, respectively). Sample sizes were as follows: Ex+ at baseline, n = 38; Ex+ at 0–3 d, n = 44; Ex+ pre-CS at 4–6 d, n = 11; Ex+ post-CS at 4–6 d, n = 27; Ex at baseline, n = 68; Ex at 0–3 d, n = 97; Ex at 4–6 d, n = 95. b, Among the V+Ex+ exacerbation modules, ‘APP’ (FDR = 5.0 × 10–2) and ‘type 2 inflammation’ (FDR = 5.1 × 10–3) showed decreased expression after systemic corticosteroids were started. Sample sizes were as follows: V+Ex+ at baseline, n = 38; V+Ex+ at 0–3 d, n = 31; V+Ex+ pre-CS at 4–6 d, n = 7; V+Ex+ post-CS at 4–6 d, n = 19; V+Ex at baseline, n = 68; V+Ex at 0–3 d, n = 61; V+Ex at 4–6 d, n = 59. 18 participants who had one Ex+ and one Ex event have the same measurement shown for Ex+ at baseline and Ex at baseline. All measurements shown are otherwise biologically independent. Comparisons were performed by using a weighted linear model and empirical Bayes method, including terms for status (Ex, Ex+ pre-CS, and Ex+ post-CS), cell percentages, presence or absence of virus, visit, and library sequencing depth with a random effect included for participant. Contrasts were tested for status within and across visits. The term for presence or absence of virus was removed in the analysis limited to V+ events.
Fig. 7
Fig. 7. Network overview of modular expression patterns demonstrates co-associated biological pathways.
a, The signal for V+Ex+ events includes a cluster of the core exacerbation modules (outlined in green squares), as well as a cluster of the type I IFN, macrophage-associated, and APC-related modules (dark purple box), the ‘cilia/IL-33 response’ module, and the ‘type 2 inflammation’ module (dark purple labels). b, The signal for VEx+ events also includes a cluster of the core exacerbation modules as well as a cluster of the squamous-associated modules (dark orange box). c, The signal from corticosteroid treatment affects multiple areas of the network, most notably resulting in a marked decrease in clustered nasal and blood eosinophil cell percentages and module expression (magenta box). The bipartite network in each panel demonstrates the co-associations among nasal (light orange) and blood (light purple) modules (squares) and cell percentages (circles). Edges represent significant positive Pearson correlations >0.5, and darker edges indicate higher correlations. Nodes are clustered according to their interconnectedness. For each comparison, significant differences in module expression and cell percentages are colored red (increased) or blue (decreased), with color intensity corresponding to fold change. Modules whose expression was not significantly different (FDR ≥ 0.07) are shown as points rather than squares to simplify the diagram. d, The diagram summarizes the main results of our analysis, showing the key pathways observed related to viral and nonviral exacerbation events. Shown in two green boxes are the annotated molecular functions of the core exacerbation modules, related to upregulation of respiratory epithelium, squamous, and eosinophil responses and downregulation of lymphocyte responses, common to both viral and nonviral cold events that progress to an asthma exacerbation. These are separated into early-response pathways (left) and late/effector pathways (right) on the basis of the results of the longitudinal analysis. Shown in the dark purple box is the distinct set of respiratory epithelium– and inflammatory cell–associated pathways observed only in virus-associated exacerbations. Shown in the dark orange box are the predominantly squamous cell–associated pathways observed only in nonviral exacerbations. The pathways affected by systemic corticosteroid use are labeled. The contrasting responses observed in resolution of a viral upper-respiratory infection are shown at the top.

Similar articles

Cited by

References

    1. Johnston SL, et al. Community study of role of viral infections in exacerbations of asthma in 9–11 year old children. BMJ. 1995;310:1225–1229. doi: 10.1136/bmj.310.6989.1225. - DOI - PMC - PubMed
    1. Busse WW, Lemanske RF, Jr, Gern JE. Role of viral respiratory infections in asthma and asthma exacerbations. Lancet. 2010;376:826–834. doi: 10.1016/S0140-6736(10)61380-3. - DOI - PMC - PubMed
    1. Olenec JP, et al. Weekly monitoring of children with asthma for infections and illness during common cold seasons. J. Allergy Clin. Immunol. 2010;125:1001–1006. doi: 10.1016/j.jaci.2010.01.059. - DOI - PMC - PubMed
    1. Busse WW, et al. Randomized trial of omalizumab (anti-IgE) for asthma in inner-city children. N. Engl. J. Med. 2011;364:1005–1015. doi: 10.1056/NEJMoa1009705. - DOI - PMC - PubMed
    1. Pavord ID, et al. Mepolizumab for severe eosinophilic asthma (DREAM): a multicentre, double-blind, placebo-controlled trial. Lancet. 2012;380:651–659. doi: 10.1016/S0140-6736(12)60988-X. - DOI - PubMed

Publication types

MeSH terms