. 2019 Jun;3(6):576-586.
doi: 10.1038/s41562-019-0562-1. Epub 2019 Apr 8.

Genetics and the geography of health, behaviour and attainment

Affiliations

Genetics and the geography of health, behaviour and attainment

Daniel W Belsky et al. Nat Hum Behav. 2019 Jun.

Abstract

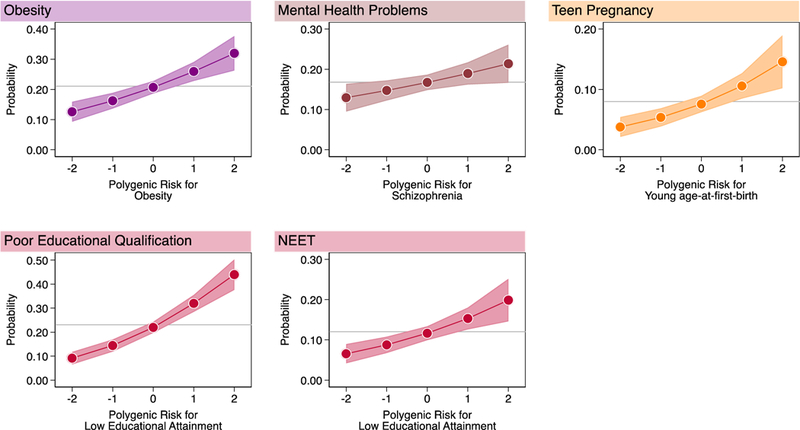
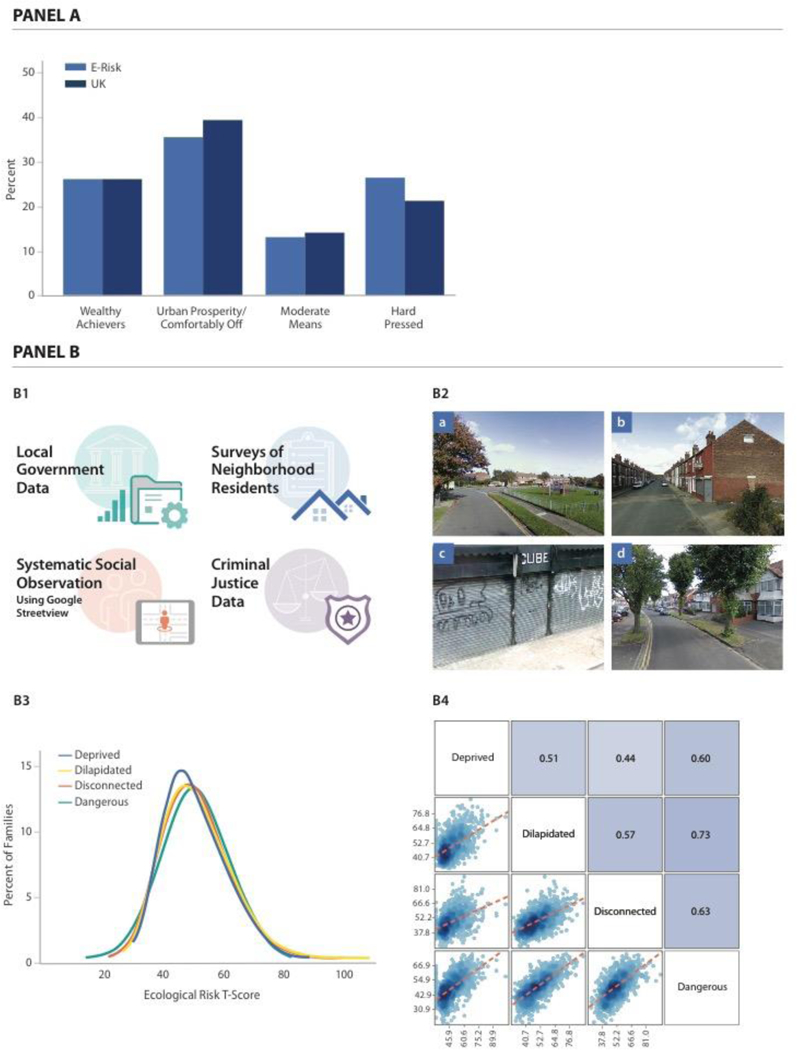
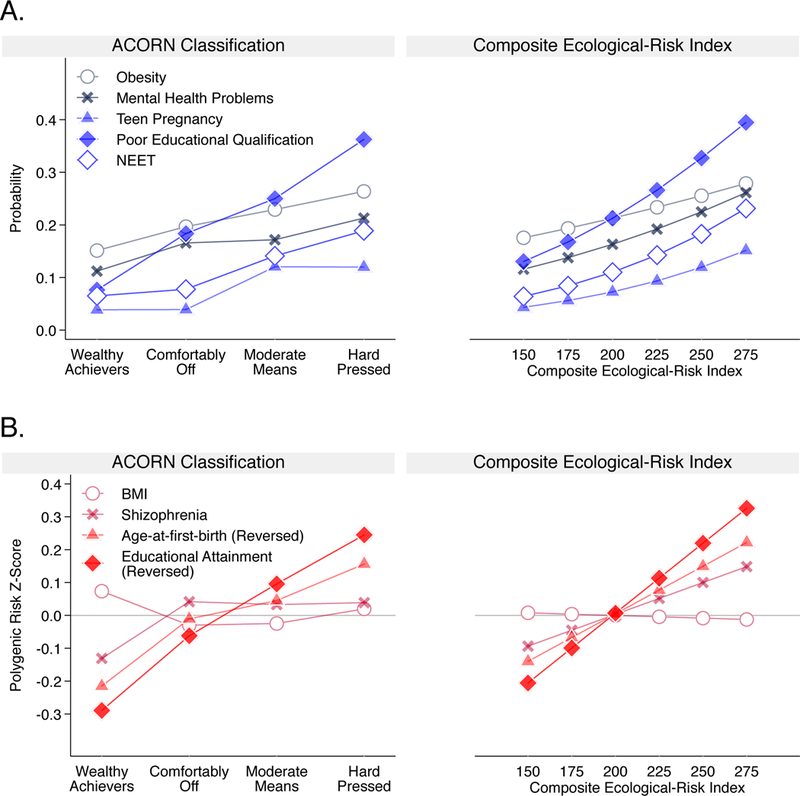
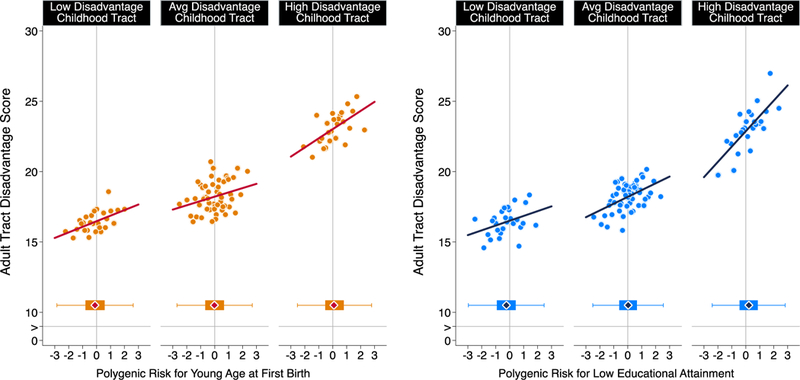
Young people's life chances can be predicted by characteristics of their neighbourhood1. Children growing up in disadvantaged neighbourhoods exhibit worse physical and mental health and suffer poorer educational and economic outcomes than children growing up in advantaged neighbourhoods. Increasing recognition that aspects of social inequalities tend, in fact, to be geographical inequalities2-5 is stimulating research and focusing policy interest on the role of place in shaping health, behaviour and social outcomes. Where neighbourhood effects are causal, neighbourhood-level interventions can be effective. Where neighbourhood effects reflect selection of families with different characteristics into different neighbourhoods, interventions should instead target families or individuals directly. To test how selection may affect different neighbourhood-linked problems, we linked neighbourhood data with genetic, health and social outcome data for >7,000 European-descent UK and US young people in the E-Risk and Add Health studies. We tested selection/concentration of genetic risks for obesity, schizophrenia, teen pregnancy and poor educational outcomes in high-risk neighbourhoods, including genetic analysis of neighbourhood mobility. Findings argue against genetic selection/concentration as an explanation for neighbourhood gradients in obesity and mental health problems. By contrast, modest genetic selection/concentration was evident for teen pregnancy and poor educational outcomes, suggesting that neighbourhood effects for these outcomes should be interpreted with care.


Figures

Figure 1.
Figure 1.. Children with higher genetic risk had more health and social problems by age 18 years.
Graphs show fitted probabilities of each health and social problem across the distribution of polygenic risk. Models were adjusted for sex. Gray lines intersecting the Y-axis show the frequency of the health or social problem in E-Risk. Shaded areas around the fitted slopes show 95% Confidence intervals. Probability of obesity is graphed against polygenic risk for obesity (RR=1.26 [1.14–1.38], n=1,837); probability of mental-health problems is graphed against polygenic risk for schizophrenia (RR=1.13 [1.02–1.26], n=1,863); probability of teen pregnancy is graphed against polygenic risk for young age-at-first-birth 1.40 [1.19–1.64], n=1,825); probabilities of poor educational qualification and NEET (Not in Education, Employment, or Training) status are graphed against polygenic risk for low educational attainment (poor educational qualification RR=1.47 [1.34–1.60], n=1,860; NEET RR 1.32 [1.15–1.52], n=1,863) (Supplementary Table 1). Effect-sizes are reported for a 1-SD increase in polygenic risk.
Figure 2.
Figure 2.. Quantification of E-Risk families’ neighborhood disadvantage using ACORN and a composite Ecological-Risk Index.
Panel A of the Figure shows distributions of ACORN (“A Classification of Residential Neighborhoods”) classifications for E-Risk families at the time of the age-12 interview (n=1,008 families with genetic data, light blue bars) and the corresponding distribution for the United Kingdom obtained from http://doc.ukdataservice.ac.uk/doc/6069/mrdoc/pdf/6069 acorn userguide.pdf (dark blue bars). Panel B of the Figure contains 4 cells. Cell B1 depicts the four sources of data used for ecological-risk assessment: from top to bottom, these are geodemographic data from local governments, official crime data, Google Street View Systematic Social Observation (SSO), and resident surveys. Image created by Motsavage Design. Cell B2 shows images illustrating (a) Well-kept neighborhood; visible play area for children; roads and sidewalks in good condition. (b) Evidence of graffiti; poorly kept sidewalk and trash container; sidewalks in fair condition. (c) Deprived residential area; vacant lot in poor condition; heavy amount of litter; sidewalks and road in poor condition. (d) Comfortably-off residential area; roads and sidewalks in good conditions; no signs of litter, graffiti or other signs of disorder. Images: Google Street View. Cell B3 shows distributions of four ecological-risk measures derived from these data: economic deprivation, physical dilapidation, social disconnectedness, and danger. Values of the ecological-risk measures are expressed as T scores (M=50, SD=10) (n=987 families with genetic data). Cell B4 shows a matrix of the ecological-risk measures illustrating their correlation with one another (see Supplementary Table 2). Matrix cells below and to the left of measures show scatterplots of their association. Matrix cells above and to the right of measures show their correlation expressed as Pearson’s r (n=973 families with genetic data and data on all four ecological risk measures).
Figure 3.
Figure 3.. Neighborhood gradients in obesity, mental health problems, teen pregnancy, poor educational qualifications, and NEET status, and in genetic risk for these phenotypes.
Panel A shows the neighborhood risk gradient for each health and social problem. The y-axis shows the probability of having a given problem at varying levels of neighborhood risk. The left-side graph plots probabilities by ACORN Classification (n=1,857). The right-side graph plots predicted probabilities for a series of values of the composite Ecological-Risk Index (n=1,822). Effect-sizes (in terms of relative risk [95% CI]) associated with a 1-category increase in disadvantage defined by ACORN and with a 1-standard deviation increase in disadvantage defined by the Ecological-Risk Index, respectively, were: obesity (RR=1.20 [1.10–1.31], / 1.15 [1.03–1.29]); mental health problems (RR=1.19 [1.08–1.31]/ 1.30 [1.14–1.47]); having a teen pregnancy (RR=1.56 [1.34– 1.83]/ 1.55 [1.30–1.85]); poor educational qualifications (RR=1.53 [1.40–1.67]/ 1.47 [1.33–1.62]) and NEET (RR=1.52 [1.33–1.74]/ 1.59 [1.36–1.85]) (Supplementary Table 3). Panel B shows the neighborhood risk gradient for each polygenic score. The y-axis shows polygenic risk on a Z-score scale (M=0, SD=1) at varying levels of neighborhood risk. The left-side graph plots polygenic risk by ACORN Classification (n=1,441). The right-side graph plots polygenic risk for a series of values of the composite Ecological-Risk Index (n=1,414). Effect-sizes (in terms of Pearson r correlation [95% CI]) with disadvantage defined by ACORN and by the Ecological-Risk Index, respectively, were: body-mass index polygenic score (r=−0.01 [−0.07, 0.04] / −0.01 [−0.08, 0.07]); schizophrenia polygenic score (r=0.04 [−0.01, 0.10] / 0.08 [0.01, 0.15]); age-at-first-birth polygenic score (r=0.12 [0.06–0.17] / 0.12 [0.04, 0.19]); educational-attainment polygenic score (r=0.18 [0.12, 0.23] / 0.17 [0.09, 0.25]) (Supplementary Table 4). Sample sizes in Panel B are smaller than sample sizes in Panel A because polygenic score analysis shown in Panel B included only one member of each monozygotic twin pair.
Figure 4.
Figure 4.. Age-at-first-birth and education polygenic score association with neighborhood mobility in the Add Health Study.
The figure plots polygenic risk associations with adult neighborhood disadvantage at the Census tract level for Add Health Participants who grew up in low-, middle-, and high-disadvantage Census tracts (n=5,325). For the figure, low-, middle-, and high-disadvantage Census tracts were defined as the bottom quartile, middle 50%, and top quartiles of the childhood tract disadvantage score distribution. The individual graphs show binned scatterplots in which each plotted point reflects average X- and Y- coordinates for a “bin” of 50 Add Health participants. The regression lines are plotted from the raw data. The box-and-whisker plots at the bottom of the graphs show the distribution of polygenic risk for each childhood-neighborhood-disadvantage category. The blue diamond in the middle of the box shows the median; the box shows the interquartile range; and the whiskers show upper and lower bounds defined by the 25th percentile minus 1.5x the interquartile range and the 75th percentile plus 1.5x the interquartile range, respectively. The vertical line intersecting the X-axis shows the cohort average polygenic risk. The figure illustrates three findings. First, adult participants tended to live in Census tracts with similar levels of disadvantage to the ones where they grew up. Second, children’s polygenic risks and their neighborhood disadvantage were correlated; the box plots show polygenic risk tended to be lower for participants who grew up in low-disadvantage tracts and higher for participants who grew up in high disadvantage tracts. Third, across strata of childhood neighborhood disadvantage, children at higher polygenic risk tended to move to more disadvantaged Census tracts no matter where they grew up.

References

    1. Woods LM et al. Geographical variation in life expectancy at birth in England and Wales is largely explained by deprivation. J. Epidemiol. Community Health 59, 115–120 (2005). - PMC - PubMed
    1. Chetty R, Stepner M, Abraham S & et al. THe association between income and life expectancy in the united states, 2001–2014. JAMA (2016). doi:10.1001/jama.2016.4226 - DOI - PMC - PubMed
    1. Luo Z-C et al. Disparities in birth outcomes by neighborhood income: temporal trends in rural and urban areas, british columbia. Epidemiol. Camb. Mass 15, 679–686 (2004). - PubMed
    1. Sampson RJ Urban sustainability in an age of enduring inequalities: Advancing theory and ecometrics for the 21st-century city. Proc. Natl. Acad. Sci. 201614433 (2017). doi:10.1073/pnas.1614433114 - DOI - PMC - PubMed
    1. Newton JN et al. Changes in health in England, with analysis by English regions and areas of deprivation, 1990–2013: a systematic analysis for the Global Burden of Disease Study 2013. The Lancet 386, 2257–2274 (2015). - PMC - PubMed

Publication types

MeSH terms