. 2019 May;3(5):513-525.
doi: 10.1038/s41562-019-0566-x. Epub 2019 Apr 8.

Genomic structural equation modelling provides insights into the multivariate genetic architecture of complex traits

Affiliations

Genomic structural equation modelling provides insights into the multivariate genetic architecture of complex traits

Andrew D Grotzinger et al. Nat Hum Behav. 2019 May.

Abstract

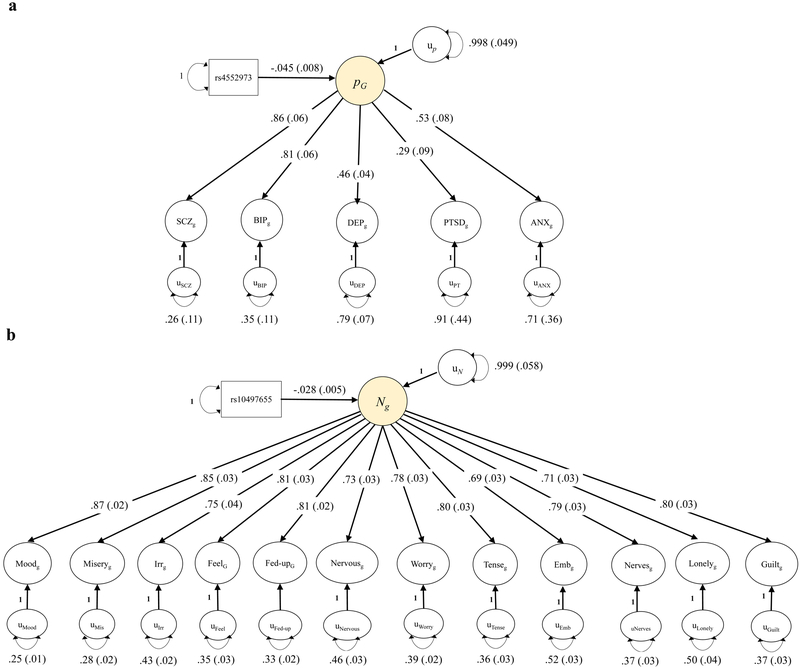
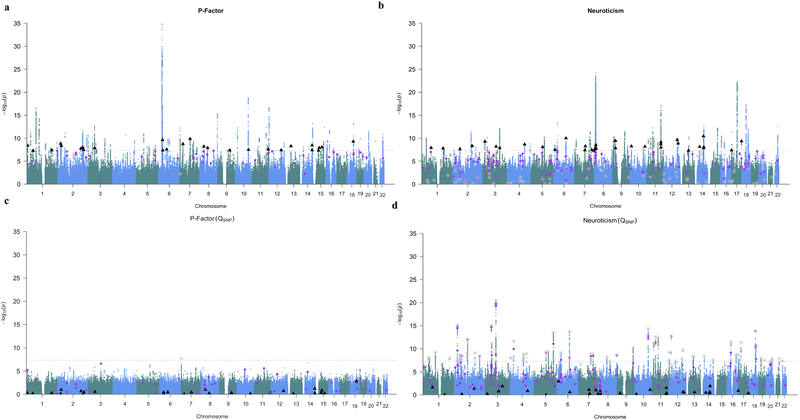
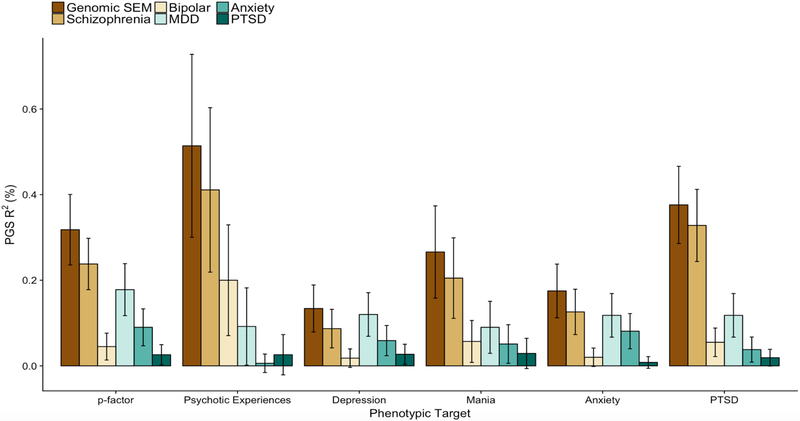
Genetic correlations estimated from genome-wide association studies (GWASs) reveal pervasive pleiotropy across a wide variety of phenotypes. We introduce genomic structural equation modelling (genomic SEM): a multivariate method for analysing the joint genetic architecture of complex traits. Genomic SEM synthesizes genetic correlations and single-nucleotide polymorphism heritabilities inferred from GWAS summary statistics of individual traits from samples with varying and unknown degrees of overlap. Genomic SEM can be used to model multivariate genetic associations among phenotypes, identify variants with effects on general dimensions of cross-trait liability, calculate more predictive polygenic scores and identify loci that cause divergence between traits. We demonstrate several applications of genomic SEM, including a joint analysis of summary statistics from five psychiatric traits. We identify 27 independent single-nucleotide polymorphisms not previously identified in the contributing univariate GWASs. Polygenic scores from genomic SEM consistently outperform those from univariate GWASs. Genomic SEM is flexible and open ended, and allows for continuous innovation in multivariate genetic analysis.


Conflict of interest statement

Competing Interests

The authors declare no competing interests.

Figures

Figure 1.
Figure 1.. Genomic SEM solutions for p-factor and neuroticism factor models with SNP effect.
Standardized results from using Genomic SEM (with WLS estimation) to construct a genetically defined p-factor of psychopathology (panel a) and a genetic neuroticism factor (panel b) with a lead independent SNP predicting the factors. SEs are shown in parentheses. For a model that was standardized with respect to the outcomes only, the effect of the SNP was −.093 (SE = .017; SNP variance = .252) for the p-factor, and for neuroticism the SNP effect was −.042 (SE = .007, SNP variance = .432); this can be interpreted as the expected standard deviation unit difference in the latent factor per effect allele. SCZ = schizophrenia; BIP = bipolar disorder; DEP = major depressive disorder; PTSD = post-traumatic stress disorder; ANX = anxiety. Irr = irritability; Feel = sensitivity/hurt feelings; fed-up = fed-up feelings; emb = worry too long after embarrassment.
Figure 2.
Figure 2.. Manhattan plots of unique, independent hits from Genomic SEM.
Genomic SEM (with WLS estimation) was used to conduct multivariate GWASs of the p-factor (panels a and c) and neuroticism (panels b and d). Manhattan plots are shown for SNP effects (top panels) and for QSNP (bottom panels). The gray dashed line marks the threshold for genome-wide significance (p < 5 × 10⁻⁸). In all four panels, black triangles denote independent hits for SNP effects from the GWAS of the general factor that were not in LD with independent hits for the univariate GWAS or hits for QSNP. In all four panels, purple diamonds denote independent hits for the SNP effects from univariate GWASs that were not in LD with independent hits from the GWAS of the general factor. Grey stars denote independent hits for QSNP.
Figure 3.
Figure 3.. Out-of-sample prediction using Genomic SEM based and univariate based polygenic scores for psychiatric traits.
Polygenic scores (PGSs) were constructed using the same set of SNPs for all predictors. R2 (%) on the y-axis indicates the percentage of variance (possible range: 0-100) explained in the outcome unique of covariates. The summary statistics for Genomic SEM were estimated using WLS. The Genomic SEM-based PGS was derived from a model estimating SNP effects on a common “p”-factor, constructed from SCZ, BIP, MDD, PTSD, and ANX (as in Fig. 1a.). In order to prevent bias, the Genomic SEM summary statistics were produced using SCZ and MDD GWAS summary statistics that did not include UKB participants. Error bars indicate 95% confidence intervals estimated using the delta method. Phenotypes were constructed for European participants in the UKB for five symptom domains and for a general p factor spanning all five symptom domains.

Similar articles

Cited by

References

    1. Lee SH et al. Genetic relationship between five psychiatric disorders estimated from genome-wide SNPs. Nature Genetics 45, 984 (2013). - PMC - PubMed
    1. Bush WS, Oetjens MT & Crawford DC Unravelling the human genome–phenome relationship using phenome-wide association studies. Nature Reviews Genetics 17, 129 (2016). - PubMed
    1. Yang J, Lee SH, Goddard ME & Visscher PM GCTA: a tool for genome-wide complex trait analysis. The American Journal of Human Genetics 88, 76–82 (2011). - PMC - PubMed
    1. Consortium ReproGen et al. An atlas of genetic correlations across human diseases and traits. Nature Genetics 47, 1236–1241 (2015). - PMC - PubMed
    1. Barban N et al. Genome-wide analysis identifies 12 loci influencing human reproductive behavior. Nature Genetics 48, 1462–1472 (2016). - PMC - PubMed

Publication types

MeSH terms