

doi: 10.1038/s41592-019-0367-1.
Epub 2019 Apr 8.
cisTopic: cis-regulatory topic modeling on single-cell ATAC-seq data
Affiliations
- PMID: 30962623
- PMCID: PMC6517279
- DOI: 10.1038/s41592-019-0367-1
Item in Clipboard
cisTopic: cis-regulatory topic modeling on single-cell ATAC-seq data
Nat Methods.
2019 May.
Abstract
We present cisTopic, a probabilistic framework used to simultaneously discover coaccessible enhancers and stable cell states from sparse single-cell epigenomics data ( http://github.com/aertslab/cistopic ). Using a compendium of single-cell ATAC-seq datasets from differentiating hematopoietic cells, brain and transcription factor perturbations, we demonstrate that topic modeling can be exploited for robust identification of cell types, enhancers and relevant transcription factors. cisTopic provides insight into the mechanisms underlying regulatory heterogeneity in cell populations.
Conflict of interest statement
The authors declare that no competing interests exist.
Figures
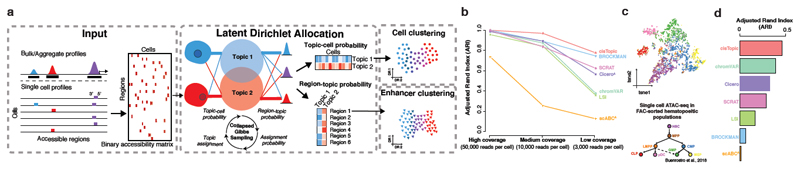
a. The input for cisTopic is an accessibility matrix, which can be provided by the user or can be created from single-cell BAM files and candidate regulatory regions. Modelling with LDA is performed using a collapsed Gibbs sampler for the estimation of the region-topic and the topic-cell probability distributions. During this process, each region in each cell is iteratively assigned to a topic, based on the contribution of that topic to the cell and the contribution of that region (across the data set) to that topic. The resulting probability distributions can be used for cell clustering (topic-cell) and region clustering (region-topic). b. Adjusted Rand Index for current scATAC-seq analysis methods using 650 single-cell profiles simulated from bulk ATAC-seq data from hematopoietic populations. Three data sets were simulated, using different read depth to assess the robustness of the methods. cisTopic has the highest ARI value even at low coverage. c.
cisTopic cell-tSNE (based on the topic contributions to each of the 2,755 cells) colored by the FAC-sorted population of origin as annotated by Buenrostro et al.. d. Adjusted Rand Index for current scATAC-seq analysis methods using 2,755 single-cell profiles from FAC-sorted populations in the hematopoietic system from Buenrostro et al.. e. Example of 4 of the 17 topics found by the analysis of FAC-sorted populations from the hematopoietic system. Top: t-SNE based on topic-cell distributions colored by the normalized topic contribution in each cell. Middle: tSNE based on the region-topic distributions colored by the topic normalized region score. Bottom: Top enriched motifs in each topic with Normalized Enrichment Score (NES). (A) scABC and Cicero were run with minor adaptations compared to the original workflow, see Methods for details.
a.
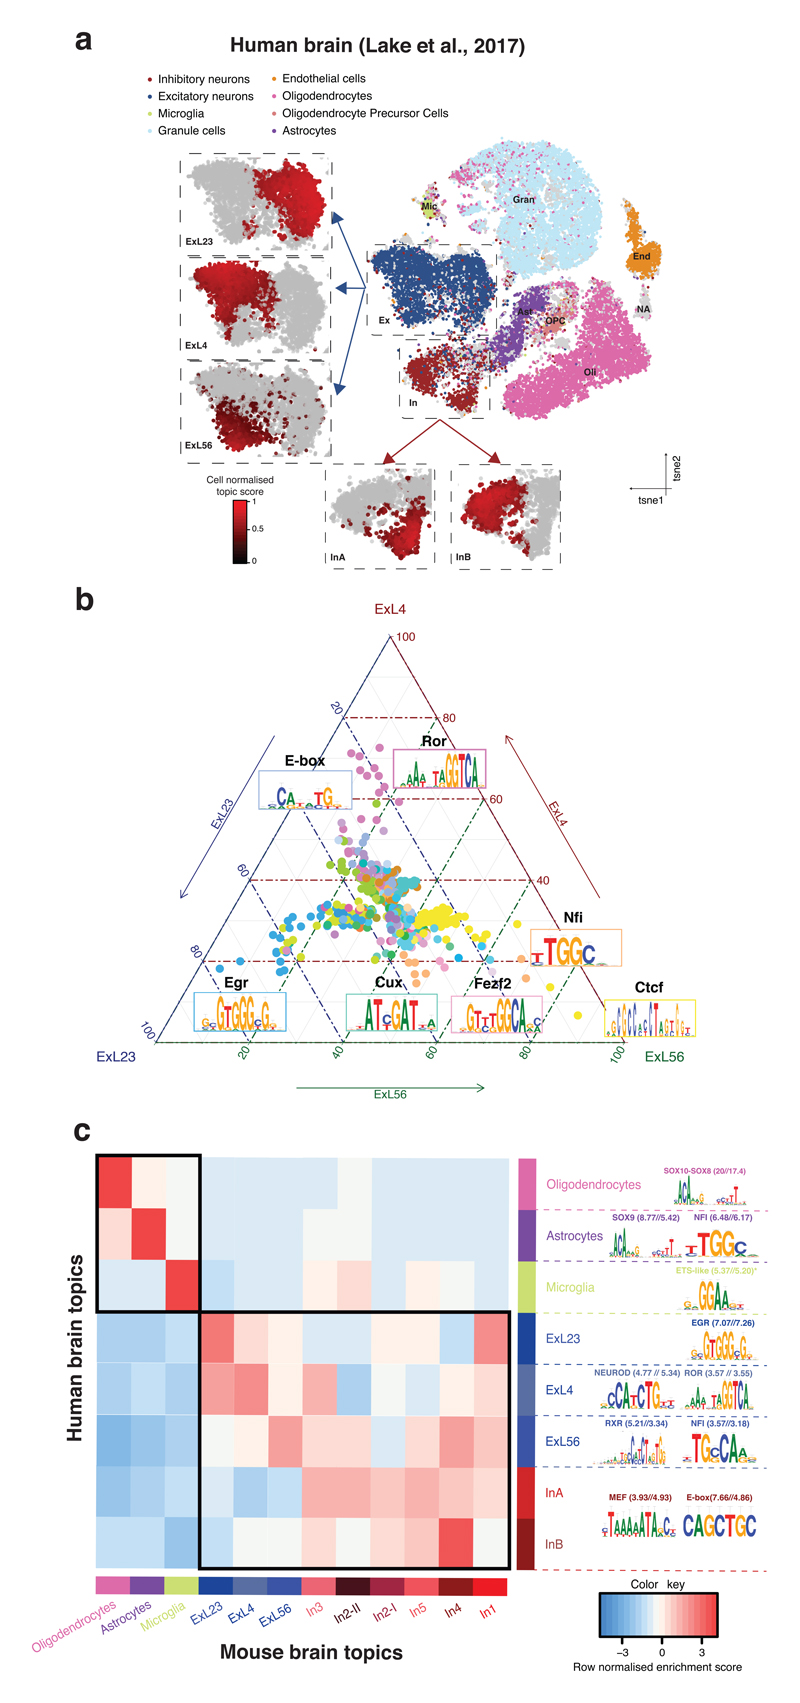
cisTopic tSNE based on topic-cell contributions from the analysis of the human brain data set (34,520 cells). cisTopic identifies the main cell types and subpopulations of interneurons (InA and InB) and excitatory neurons (ExL23, ExL4 and ExL56). The insets show cell-type specific topic enrichment scores. b.
cisTopic tSNE based on topic-cell contributions from the analysis of the mouse brain data set (3,034 cells). cisTopic identifies subpopulations of interneurons previously unannotated (in grey) and excitatory neurons (Dentate Gyrus, ExL23, ExL4 and ExL56; insets). The insets show cell-type specific topic enrichment scores. c. Ternary plot based on the mean Cis-Regulatory Module (CRM) scores per region set (i.e. topic) for differentially enriched motifs between the layer-specific topics. Each corner represents a layer-specific topic, dots represent enriched motifs and axes represent scaled CRM scores for each topic. The colors of the dots are used to indicate which motifs belong to the same transcription factor (based on STAMP clustering). d. Enrichment of human topics ('lifted over' to mm10) in the mouse topics.
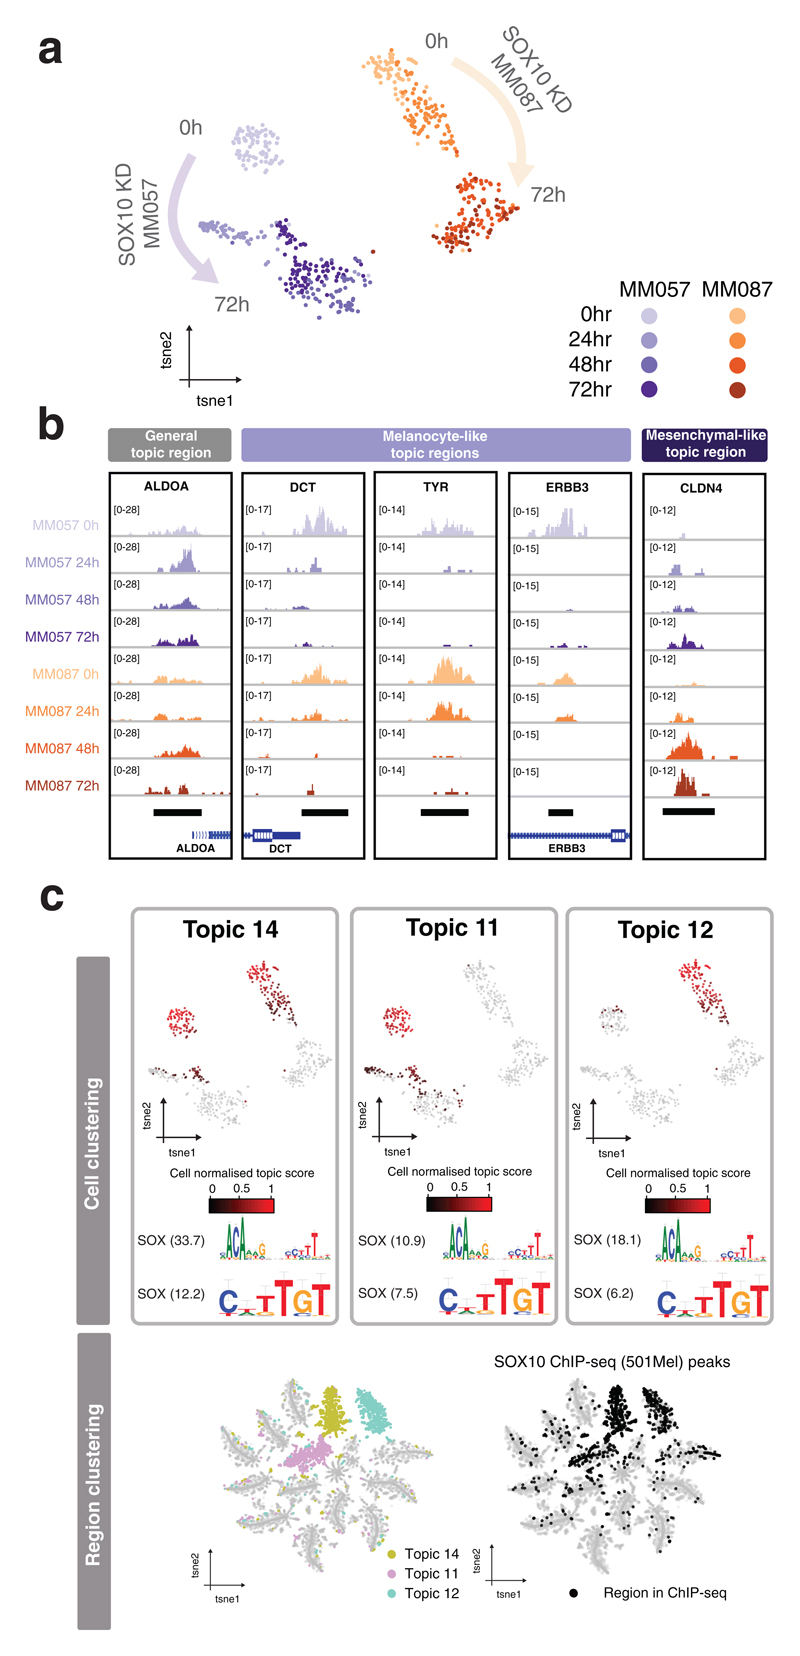
a. scATAC-seq was performed with the Fluidigm C1 on two melanocyte-like melanoma lines (MM057 and MM087) during SOX10 KD at four different timepoints (0, 24, 48 and 72 hours post-SOX10 KD). b. tSNE-representation (598 cells) generated by cisTopic using the topic-cell distributions. c. Aggregated scATAC-seq profiles of single cells per condition on a region of a general topic, four melanocyte-like topic regions (topic 14) that are known SOX10 target genes and a mesenchymal-like topic region. d. cisTopic identified three regulatory topics (topic 14, 11 and 12) enriched for SOX10 binding sites that loose accessibility during SOX10 KD. Left: Cell-tSNE colored by normalized topic score, together with motifs enriched in these topic regions (NES scores are mentioned). Right: Region-tSNE colored by topic normalized region scores and overlap with SOX10 ChIP-seq peaks.
Comment in
-
Stein Aerts.Nat Methods. 2019 May;16(5):355. doi: 10.1038/s41592-019-0397-8. Nat Methods. 2019. PMID: 30971811 No abstract available.
References
Publication types
MeSH terms
Grants and funding
LinkOut - more resources
Full Text Sources
Other Literature Sources
Molecular Biology Databases
