. 2019 May;22(5):729-740.
doi: 10.1038/s41593-019-0370-y. Epub 2019 Apr 8.

Control of tumor-associated macrophages and T cells in glioblastoma via AHR and CD39

Affiliations

Control of tumor-associated macrophages and T cells in glioblastoma via AHR and CD39

Maisa C Takenaka et al. Nat Neurosci. 2019 May.

Erratum in

  • Author Correction: Control of tumor-associated macrophages and T cells in glioblastoma via AHR and CD39.
    Takenaka MC, Gabriely G, Rothhammer V, Mascanfroni ID, Wheeler MA, Chao CC, Gutiérrez-Vázquez C, Kenison J, Tjon EC, Barroso A, Vandeventer T, de Lima KA, Rothweiler S, Mayo L, Ghannam S, Zandee S, Healy L, Sherr D, Farez MF, Prat A, Antel J, Reardon DA, Zhang H, Robson SC, Getz G, Weiner HL, Quintana FJ. Takenaka MC, et al. Nat Neurosci. 2019 Sep;22(9):1533. doi: 10.1038/s41593-019-0446-8. Nat Neurosci. 2019. PMID: 31197266 Free PMC article.

Abstract

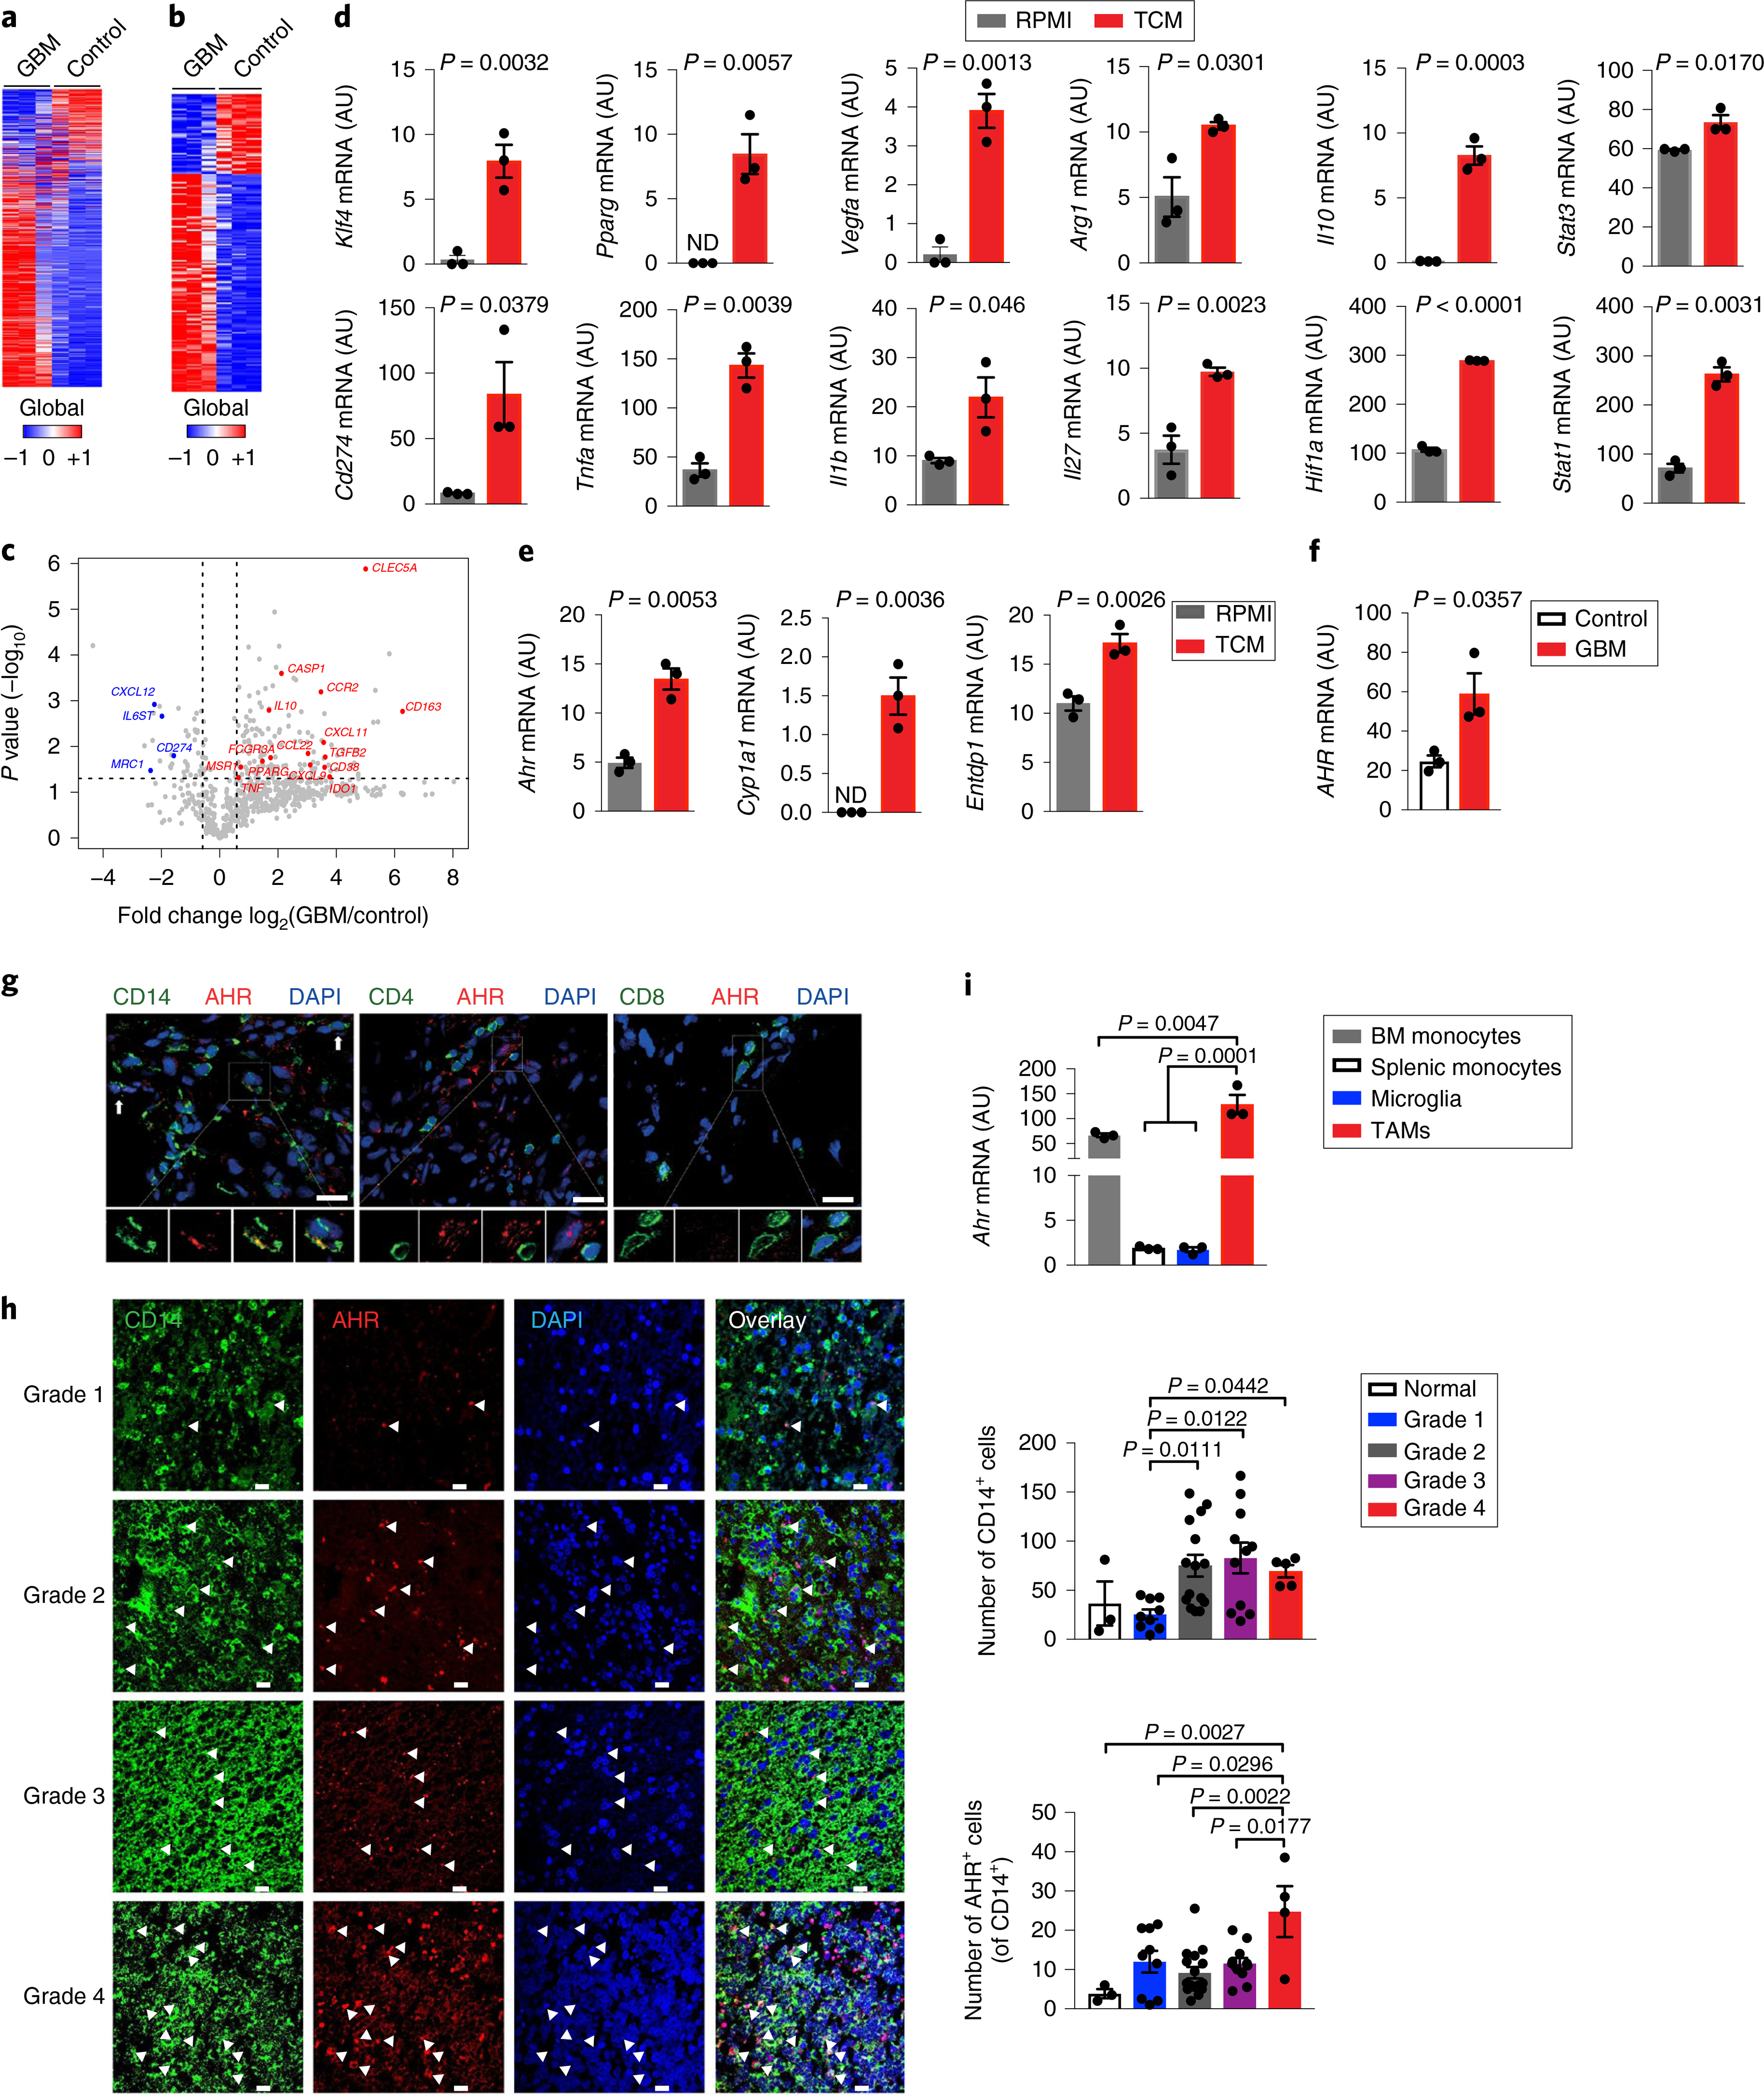
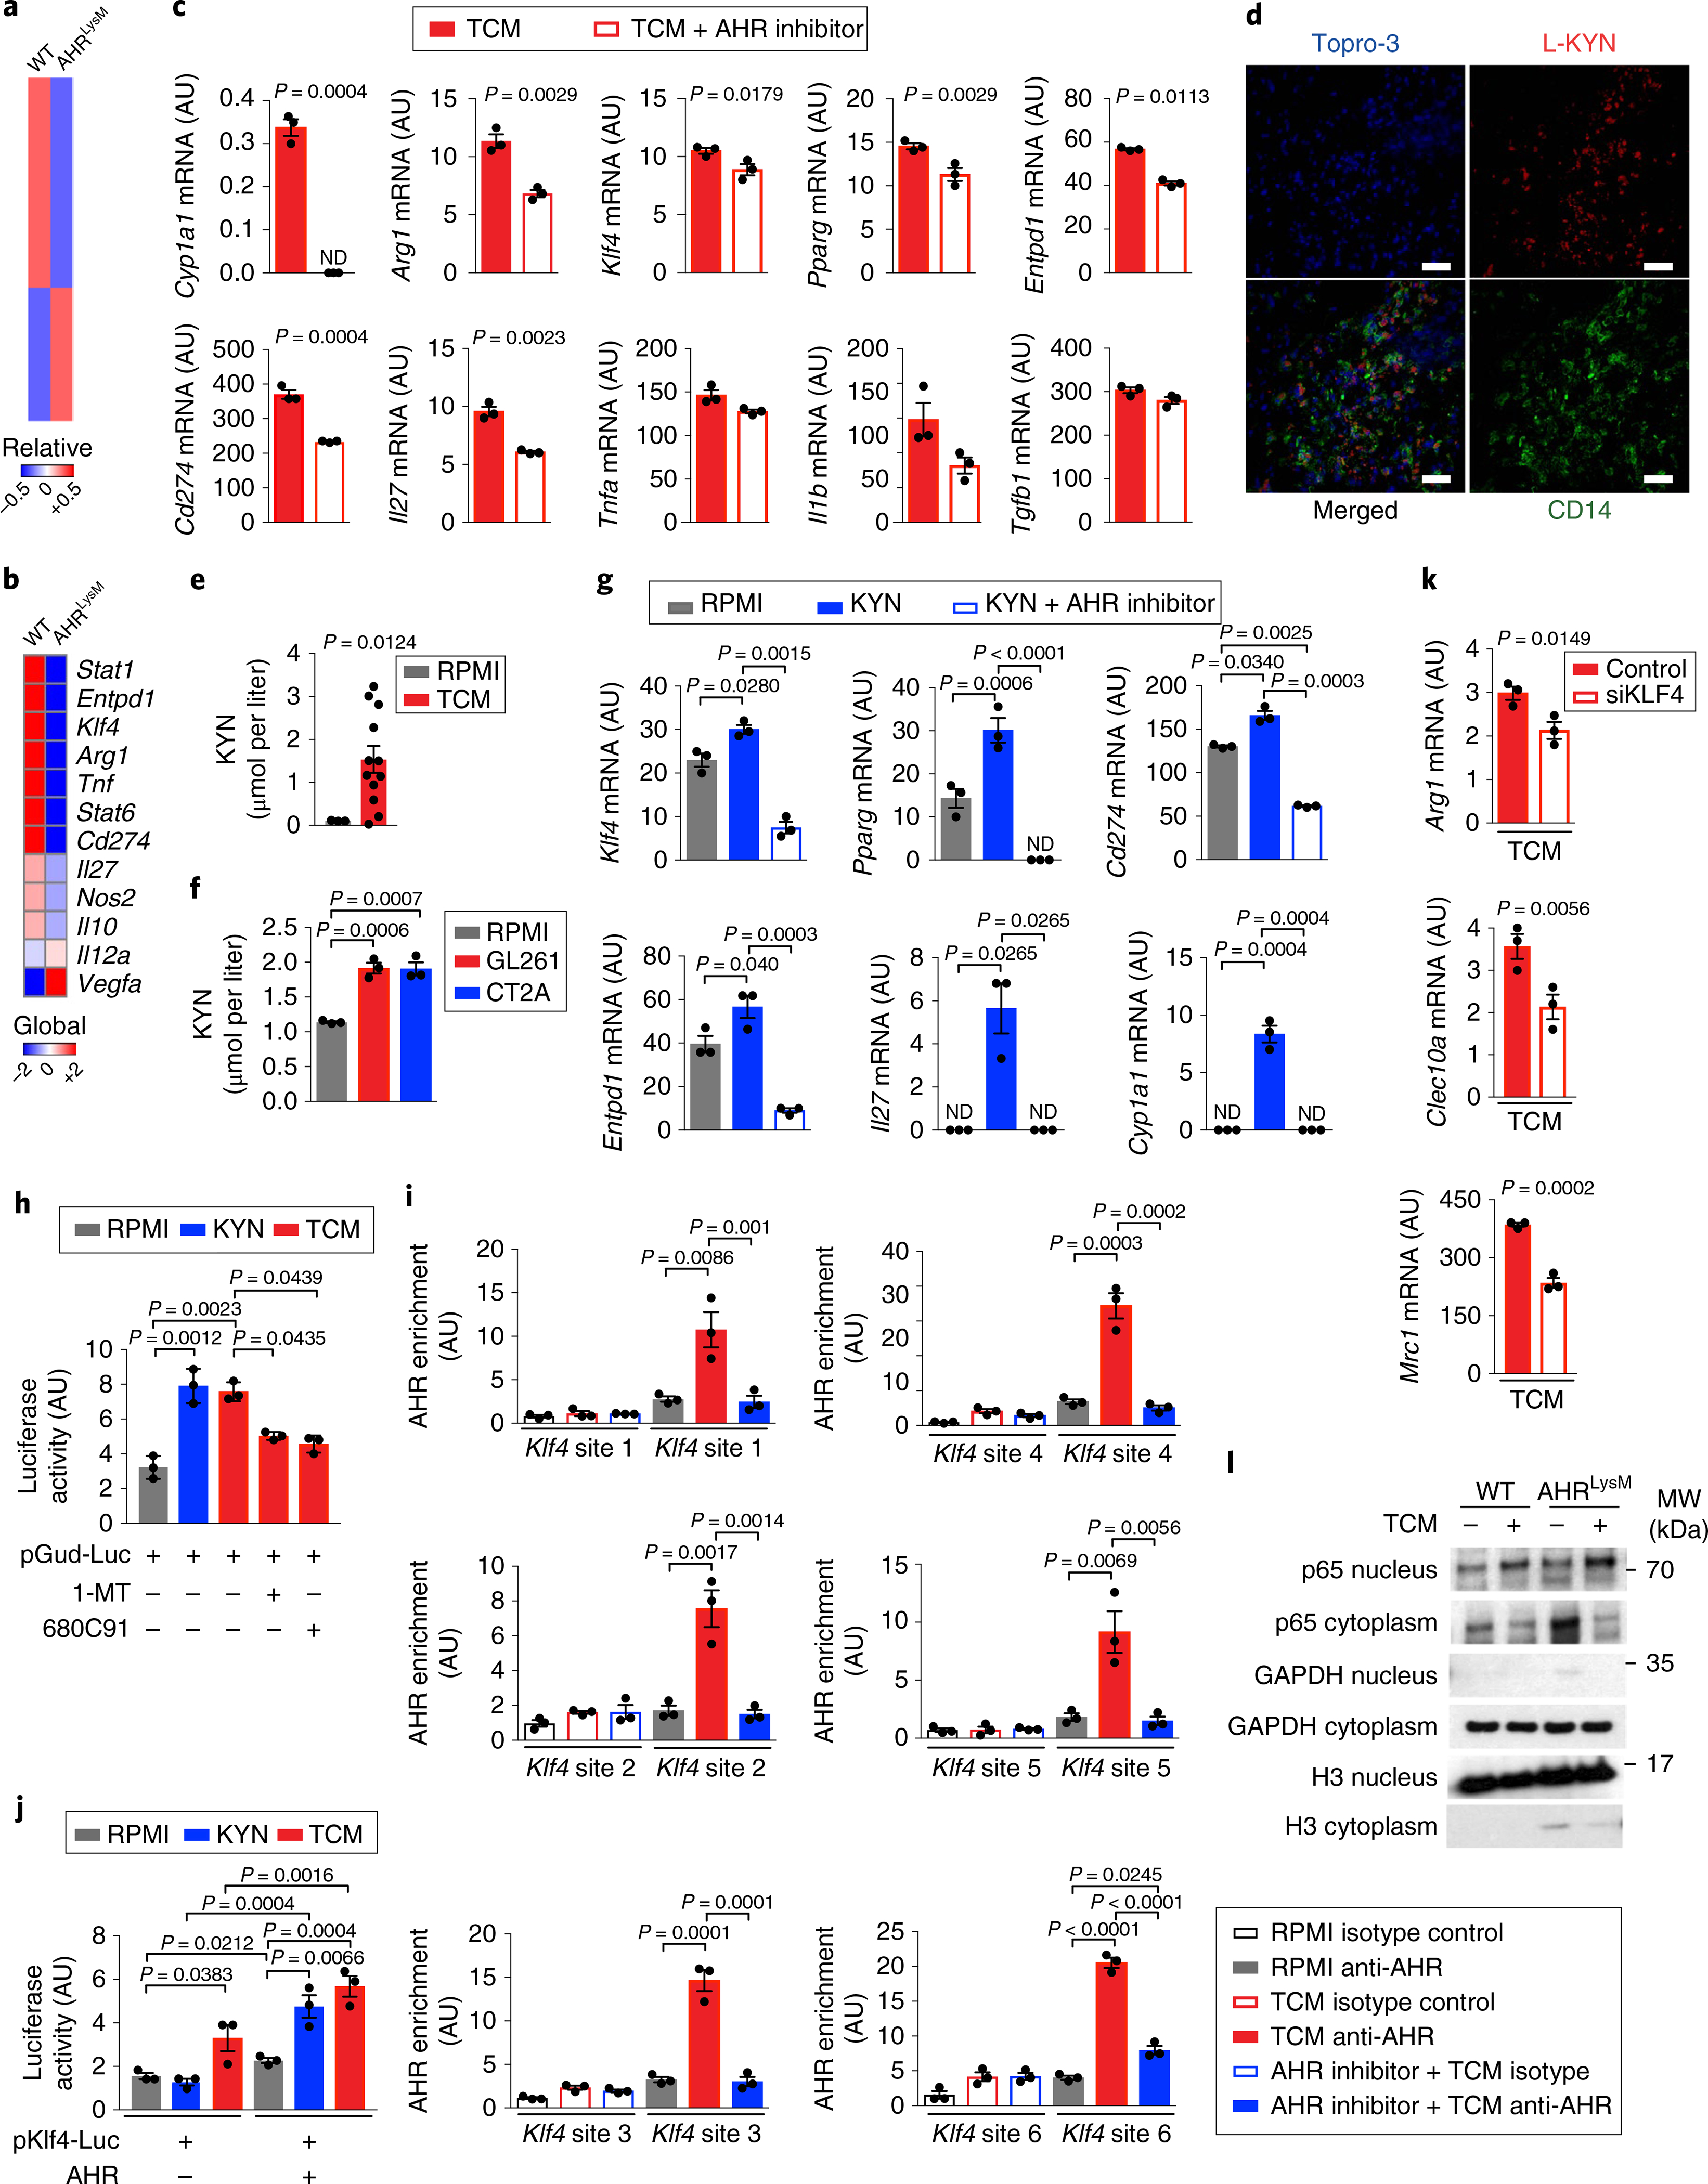
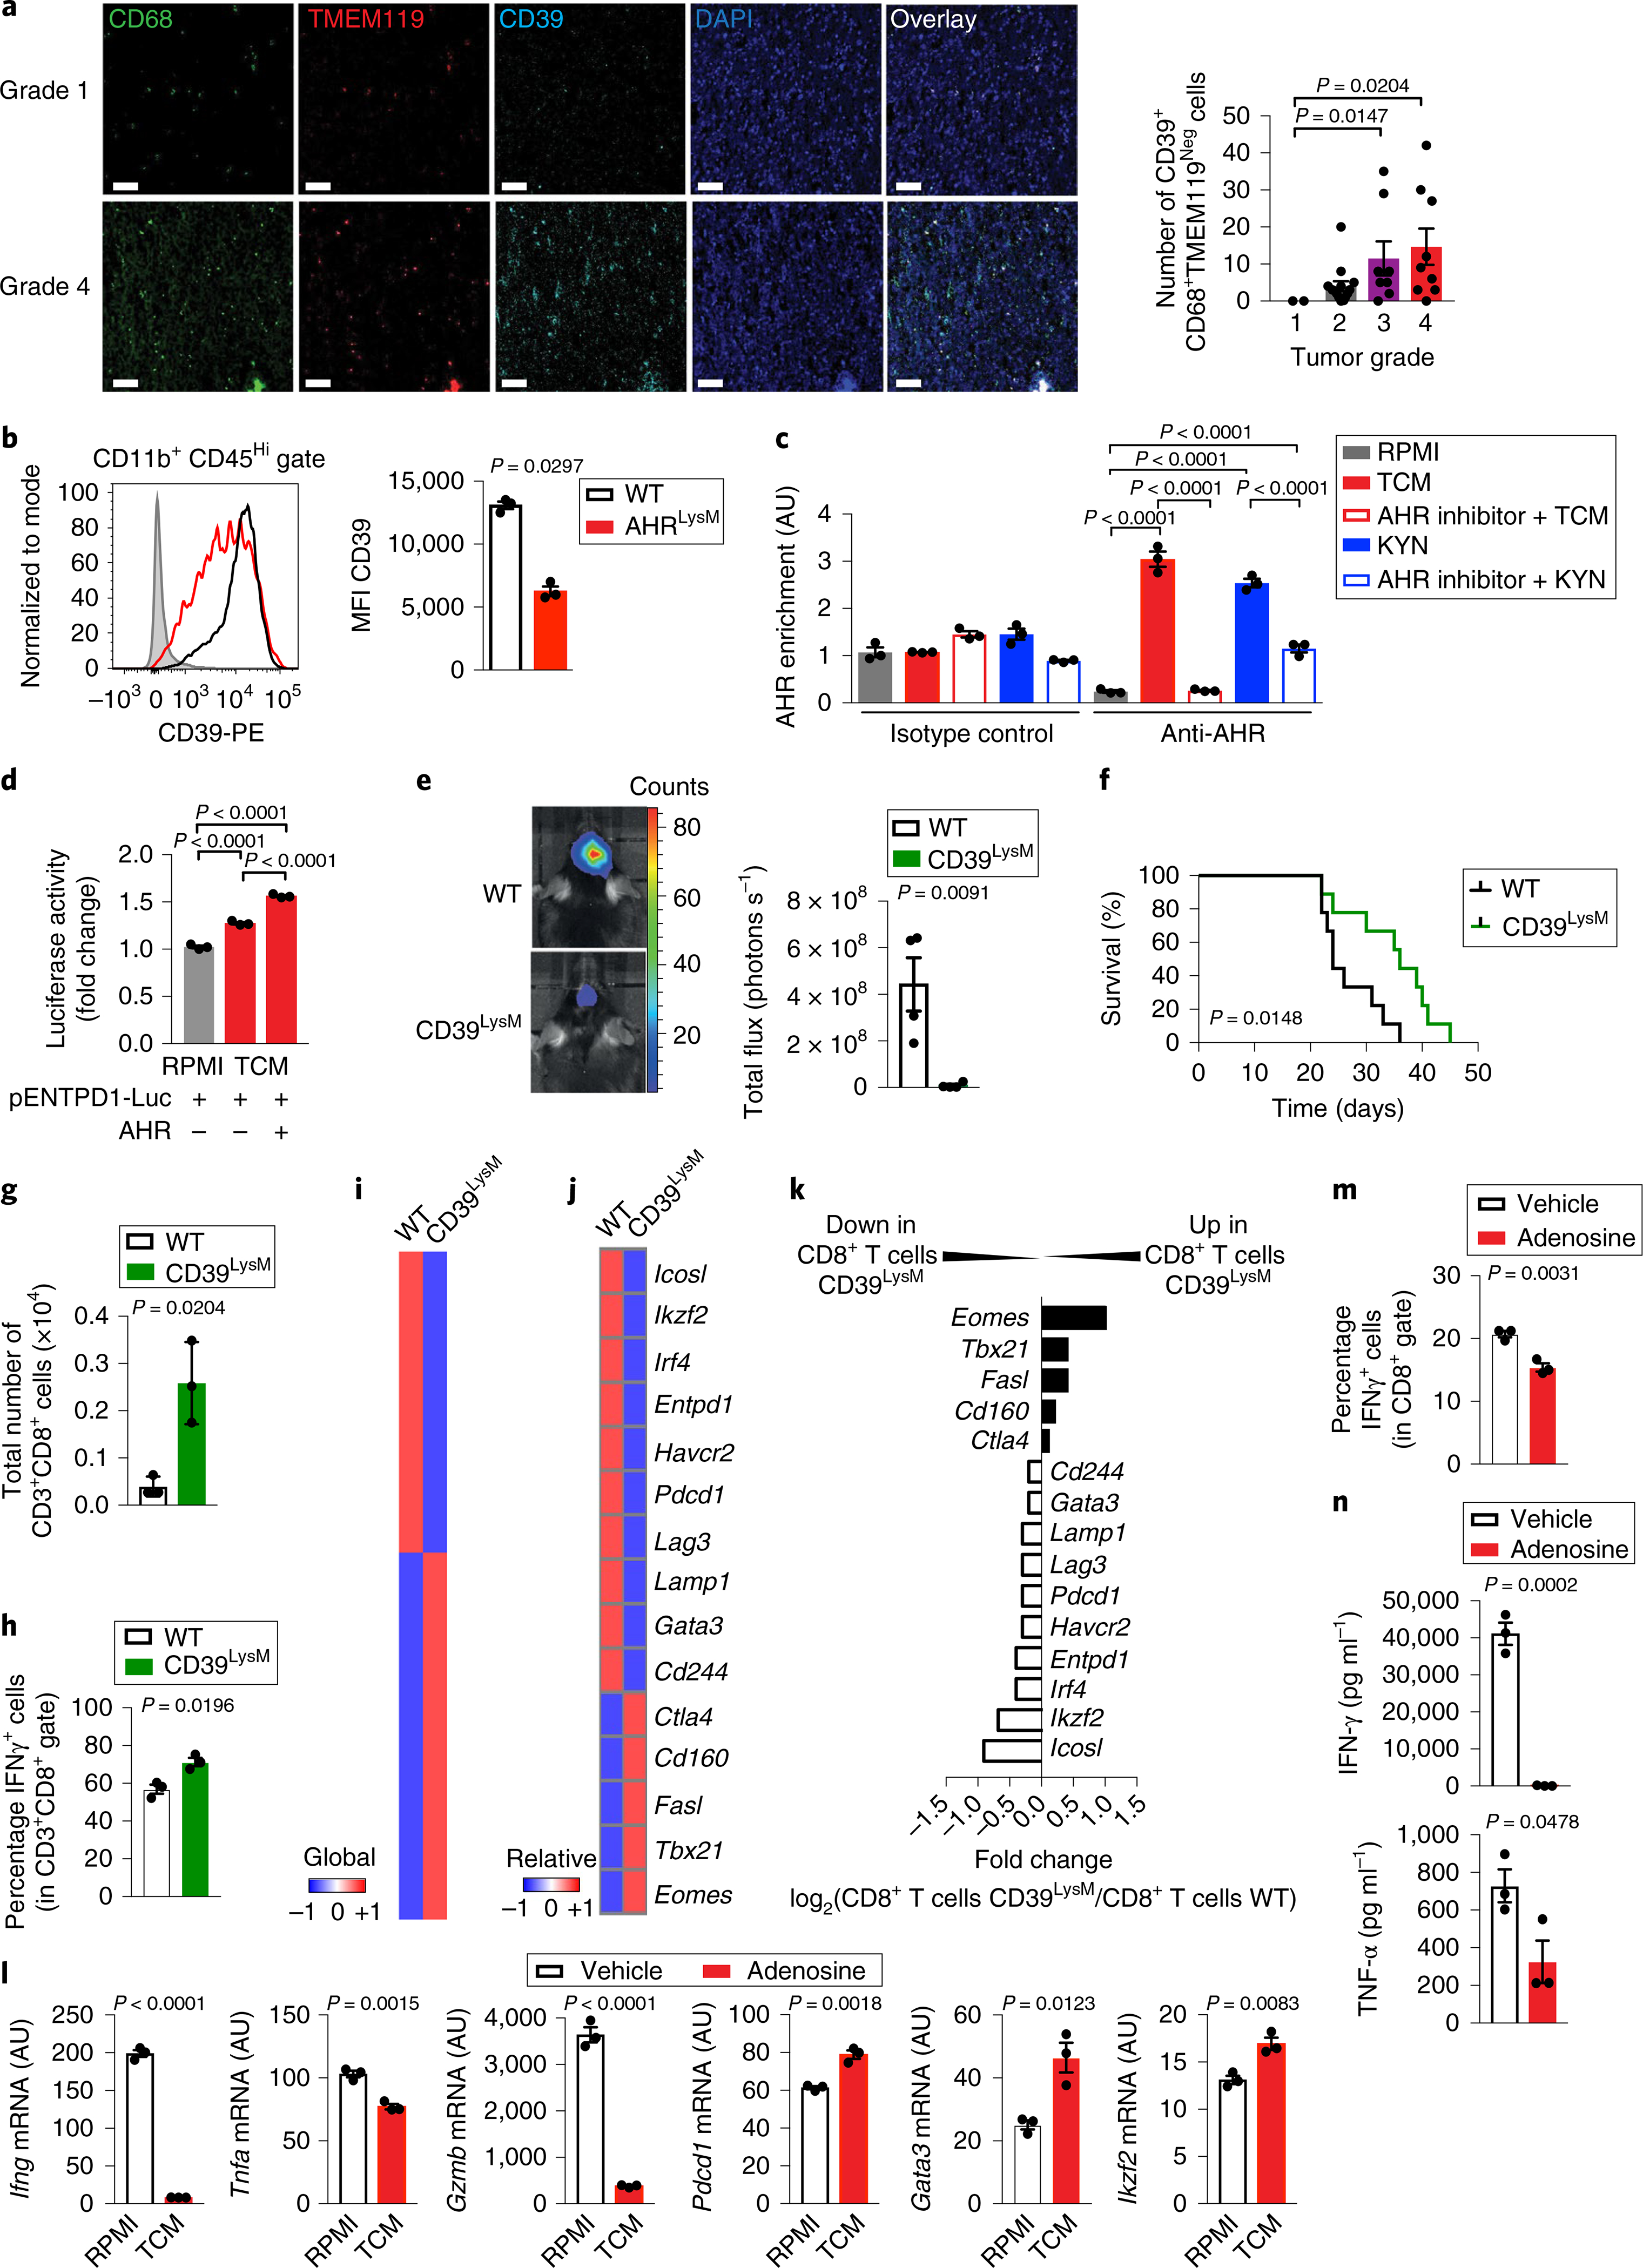
Tumor-associated macrophages (TAMs) play an important role in the immune response to cancer, but the mechanisms by which the tumor microenvironment controls TAMs and T cell immunity are not completely understood. Here we report that kynurenine produced by glioblastoma cells activates aryl hydrocarbon receptor (AHR) in TAMs to modulate their function and T cell immunity. AHR promotes CCR2 expression, driving TAM recruitment in response to CCL2. AHR also drives the expression of KLF4 and suppresses NF-κB activation in TAMs. Finally, AHR drives the expression of the ectonucleotidase CD39 in TAMs, which promotes CD8+ T cell dysfunction by producing adenosine in cooperation with CD73. In humans, the expression of AHR and CD39 was highest in grade 4 glioma, and high AHR expression was associated with poor prognosis. In summary, AHR and CD39 expressed in TAMs participate in the regulation of the immune response in glioblastoma and constitute potential targets for immunotherapy.


Conflict of interest statement

Competing interests

F.J.Q. is a member of the Scientific Advisory Board of Kyn Therapeutics. D.S. is a cofounder of and holds equity in Hercules Pharmaceuticals. The other authors declare no competing interests.

Figures

Fig. 1 |
Fig. 1 |. AHR is expressed by TAMs in GBM.
ac, Gene expression analysis of GBM-infiltrating CD14+ cells (GBM) and microglia from healthy individuals (Control) using Nanostring (n = 3 biologically independent samples). Heatmap of all expressed genes (a), differentially regulated genes with P < 0.05 (b) and volcano plot of gene expression with P < 0.05 (fold change in relative expression of M1-like and M2-like genes as determined by log2 (GBM/control), with upregulated genes are shown in red and downregulated genes in blue) (c). d,e, Sorted splenic macrophages (CD11cNeg CD11b+ Ly6C+) stimulated with complete RPMI (RPMI) or TCM from GL261 cells for 24 h. Quantitative PCR (qPCR) analysis of M1- and M2-linked genes (d) and of Ahr and AHR target genes (n = 3 technical replicates) (e). Data are representative of three independent experiments, with similar results obtained. ND, not detectable. f, AHR expression in GBM and Control cells (n = 3 biologically independent samples) determined by qPCR. g, Representative immunofluorescence images of human GBM stained for AHR (red), CD14 (green), CD4 (green), CD8 (green) and nuclei (DAPI; blue) (n = 3 biologically independent samples). Arrows indicate co-expression of AHR and CD14. Scale bars, 25 μm. h, Left: representative immunofluorescence images of human gliomas stained for AHR (red), CD14 (green) and nuclei (blue) from a nervous system glioma tissue array (n = 43). Arrowheads indicate co-expression of AHR and CD14. Scale bars, 20 μm. Right: quantification of the total number of CD14+ cells and AHR+ CD14+ cells in 40 glioma samples and 3 controls. Kruskal–Wallis test was used for statistical analysis. i, Ahr expression in microglia (CD45Low CD11b+), bone marrow (BM) monocytes (CD3Neg B220Neg Ly6GNeg NK1.1Neg Siglec-FNeg CD11b+ Ly6CHi) and splenic monocytes (CD11cNeg CD11b+ Ly6CHi) from naive wild-type (WT) mice and TAMs (LinNeg CD45+ CD11b+) in GL261-bearing WT mice (n = 3 biologically independent samples). Data are representative of three independent experiments, with similar results obtained. Data in df, h and i are shown as mean ± s.e.m. P values were determined using two-sided Student’s t-tests (bf) or one-way ANOVA (i).
Fig. 2 |
Fig. 2 |. STAT1, STAT3 and miR-29 control AHR expression in TAMs.
a, qPCR analysis of cytokine genes in GL261 cells (n = 3 technical replicates). b, Production of IFN-β (n = 4 independent samples) and IL-6 (n = 3 independent samples) in control media (RPMI) and TCM from GL261 cells as assessed by ELISA. Unpaired two-tailed t-test. c,d, Ahr expression in BMDMs treated with anti-IFN-β antibody or STAT1 or STAT3 inhibitor for 15 min and stimulated with RPMI or TCM from GL261 cells for 24 h (n = 3 technical replicates). e, STAT1 and STAT3 binding sites in the Ahr promoter. The arrows indicate primers designed to study STAT1 (sites 1 and 2) and STAT3 (site 3) recruitment. f, ChiP analysis of STAT1 recruitment to the Ahr promoter in BMDMs stimulated with TCM (n = 3 technical replicates). g, Luciferase activity in HEK293 cells transfected with a luciferase reporter construct driven by the Ahr promoter (pAhR-Luc) and a construct encoding constitutively activated STAT1 (n = 3 technical replicates). h, STAT3 recruitment to the Ahr promoter in BMDMs stimulated with TCM as assessed by ChIP (n = 3 technical replicates). i, Luciferase activity in HEK293 cells transfected with a luciferase reporter driven by the AHR promoter (pAhR-Luc) and a construct encoding constitutively activated STAT3 (n = 4 technical replicates). j, Predicted miR-29 binding sites in the 3′ UTR of AHR. The asterisks indicate nucleotides mutated for the luciferase reporter assay. k, miR-29a and miR-29b expression determined by qPCR in TAMs (LinNeg CD45+ CD11b+) sorted from the brain of naive (Control) or GL261 cell-implanted (GBM) WT mice (n = 3 biologically independent samples). l, Correlation between patient survival and miR-29a, miR-29b and miR-29c expression levels (high or low) in GBM based on TCGA data (n = 91 biologically independent samples). Log-rank test was used for statistical analysis. m,n, miR-29b ectopic expression suppresses Ahr mRNA (m) and AHR protein (n) expression in RAW264.7 macrophages (n = 3 biologically independent samples). The immunoblot images are cropped; full scans are shown in Supplementary Fig. 2a. o, Luciferase activity measured 48 h post-transfection of an AHR 3′-UTR-driven luciferase reporter co-transfected with a miR-29b mimic (miR-29b) or control oligonucleotides (control) (n = 3 biologically independent samples). The following luciferase reporters were used: empty plasmid (Empty), plasmid with intact human AHR 3′-UTR (hAHR) and plasmid with human AHR 3′-UTR containing miR-29b mutant binding site (hAHRmut). Data are representative of two (c, d, f, h, i, k, mo) or three (a) independent experiments, with similar results obtained. Data in ad, fi and ko are shown as mean ± s.e.m. P values were determined by two-sided Student’s t-testa (b, g, i, k and n) or one-way ANOVA (c, d, f, h, m and o).
Fig. 3 |
Fig. 3 |. AHR modulates TAM recruitment and tumor growth.
a, Tumor size in WT and AHRLysM mice 17 days after GL261-luciferase cell implantation (n = 4 independent mice). Representative images from each group are shown on the left and quantification of tumor size on the right. Unpaired two-tailed t-test. b, Survival curve analysis from WT and AHRLysM mice implanted intracranially with GL261 cells (n = 12 independent mice). Survival analysis was performed using a Kaplan–Meier plot using a log-rank (Mantel–Cox) test. c, Percentage of TAMs (LinNeg CD45+ CD11b+) in WT and AHRLysM mice implanted with GL261 cells. d,e, Percentage of microglia (CD11b+ CD45Low) and peripheral infiltrated macrophages (CD11b+ CD45Hi) in TAMs gated from naive WT mice and GBM WT and AHRLysM mice 15 days after GL261 cell implantation (n = 4 independent mice) (d), and 28 days after CT2A cell implantation (n = 3 independent mice) (e). Representative flow cytometry plots from each group are shown on the left and quantification analyses are on the right. f, Migration of WT and AHRLysM sorted splenic macrophages (CD11b+ Ly6C+) exposed to a gradient of CCL2 or PBS in the presence of an AHR inhibitor or vehicle (n = 3 technical replicates). g, Ccr2 mRNA expression in sorted peripheral infiltrated macrophages from GBM WT and AHRLysM (n = 3 biologically independent samples). h, CCR2 expression in splenic macrophages (CD11cNeg CD11b+ Ly6C+) from naive WT and AHRLysM mice (n = 3 biologically independent samples). APC, allophycocyanin; PE, phycoerythrin; FMO, fluorescence minus one. Data are representative of two (a, ch) or three (b) independent experiments, with similar results obtained. Data in a, dh are shown as mean ± s.e.m. P values were determined by two-sided Student’s t-tests (a, g and h) or one-way ANOVA (d, e and f).
Fig. 4 |
Fig. 4 |. KYN controls TAM activation via AHR.
a,b, Nanostring analysis of peripheral infiltrated macrophages (LinNeg CD11b+ CD45Hi) in GBM from WT and AHRLysM mice 15 days after GL261 cell implantation (pool of 4 mice per group). Heatmaps of global gene expression (a) and macrophage polarization genes (b). c,g, Expression of M1- and M2-like genes by qPCR in splenic macrophages from WT mice treated with an AHR inhibitor or vehicle for 15 min and stimulated with TCM (c) or L-KYN (g) for 24 h (n = 3 technical replicates). d, Representative images of human GBM tissue (n = 3 biologically independent samples) stained for KYN (red), CD14 (green) and Topro-3 (blue). Scale bars, 50 μm. e,f, KYN levels in human (n = 12 biologically independent samples) (e) and mouse TCM (n = 3 biologically independent samples) (f). h, Luciferase activity in HEK293 cells transfected with a luciferase construct driven by an AHR-responsive promoter (pGud-luc). Cells were treated with a TDO inhibitor (680C91) or an IDO-1 inhibitor (1-MT) for 15 min and stimulated with TCM or KYN for 24 h (n = 3 technical replicates). i, AHR recruitment to the Klf4 promoter in BMDMs treated with TCM in the presence or absence of an AHR inhibitor as assessed by ChIP (n = 3 technical replicates). j, Luciferase activity in RAW264.7 cells transfected with a luciferase construct driven by the KLF4 promoter alone and AHR, incubated with TCM or KYN for 24 h (n = 3 technical replicates). k, qPCR analysis of KLF4 target genes in TCM-stimulated BMDMs depleted of KLF4 by siRNA (siKLF4) (n = 3 technical replicates). l, Western blot analysis of NF-κB (p65) activation in BMDMs stimulated with TCM for 90 min from WT and AHRLysM mice. H3, histone H3. Images are cropped; full scans are shown in Supplementary Fig. 2c. Data in c, gl are representative of two independent experiments, with similar results obtained. Data in c, ek are shown as mean ± s.e.m. P values were determined by two-sided Student’s t-tests (c, e and k) or one-way ANOVA (fj).
Fig. 5 |
Fig. 5 |. AHR-driven CD39 expression in TAMs impairs the T cell response.
a, Left: representative immunofluorescence images of tissue array from human gliomas stained for TMEM119 (red), CD68 (green), CD39 (cyan) and nuclei (blue). Scale bars, 20 μm. Right: quantification of the total number of CD39+ CD68+ TMEM119Neg cells in 33 glioma samples classified as grade 1 (n = 2), grade 2 (n = 14), grade 3 (n = 8) or grade 4 (n = 9). Kruskal–Wallis test. b, Flow cytometry analysis of CD39 expression in peripheral infiltrated macrophages in TAMs (LinNeg CD11b+ CD45Hi) gated from WT and AHRLysM mice 17 days after GL261 cell implantation (n = 3 independent mice). Representative histogram shown on the left and quantification analysis on the right. c, AHR recruitment to the Entpd1 promoter as assessed by ChIP in KYN- or TCM-stimulated BMDMs in the presence or absence of an AHR inhibitor (n = 3 technical replicates). d, Relative expression of luciferase activity in HEK293 cells transfected with a luciferase reporter driven by the ENTPD1 promoter alone, or with a construct coding for AHR, and stimulated TCM for 24 h. RPMI condition was the reference sample (n = 3 technical replicates). e, Representative images from intracranial tumors in WT and CD39LysM mice 21 days after GL261-luciferase cell implantation (n = 4 independent mice). f, Survival curve analysis of WT and CD39LysM mice implanted intracranially with GL261-luciferase cells (n = 8 independent mice). g,h, Total number of TILs (CD3+ CD8+) (g) and percentage of IFN-γ+ cells in TILs (h) gated from WT and CD39LysM mice 15 days after GL261-luciferase cell implantation (n = 3 independent mice). ik, Nanostring analysis of sorted CD8+ TILs from WT and CD39LysM mice 15 days after GL261-luciferase cell implantation (pool of 5 mice per group). Heatmap of gene expression for all genes (i) and of T cell dysfunction-related genes (j). k, Ratio of the expression of genes related to CD8+ T cell dysfunction in WT and CD39LysM mice. ln, Naive CD8+ T cells purified using beads activated with anti-CD3 and anti-CD28 monoclonal antibodies in the presence or absence of adenosine for 48 h (n = 3 technical replicates for all analyses). Expression levels of T cell effector and dysfunction genes were analyzed by qPCR (l), frequency of IFN-γ+ cells in CD8+ T cells by FACS (m) and cytokines production by ELISA (n). Data in bh and ln are representative of two independent experiments; similar results were obtained. Data in ae, g, h, l–n are shown as mean ± s.e.m. P values were determined by two-sided Student’s t-tests (b, e, g, h, l–n) or one-way ANOVA (a, c and d), and survival analysis was performed using a Kaplan–Meier plot using a log-rank (Mantel–Cox) test (f).
Fig. 6 |
Fig. 6 |. Association of AHR transcriptional response to clinical outcome in GBM.
a, Left: representative immunofluorescence images of tissue array with non-tumor (n = 3) and human gliomas of different grades (n = 40) stained for KYN (green) and nuclei (blue). Scale bars, 20 μm. Right: quantification of KYN+ cells in non-tumor brain (n = 3) and tumors of grade 1 (n = 9), grade 2 (n = 16), grade 3 (n = 11) and grade 4 (n = 4). b, Heatmap of gene expression in GBM (n = 151) and lower-grade glioma (LGG, n = 527) samples generated using data shown in Supplementary Table 2 and arranged in the following order: group: GBM, LGG; grade: G2, G3 (LGG), G4 (GBM); LGG subclass: anaplastic astrocytoma, anaplastic oligoastrocytoma, astrocytoma, oligoastrocytoma, oligodendroglioma; GBM subclass: classical, G-CIMP, mesenchymal, neural, proneural; IDH mutant: no, yes. NA, not applicable or missing data. c, CCR2 and CCL2 mRNA RNA sequencing by expectation maximization (RSEM) from GBM patients with proneural (n = 29), neural (n = 26) or mesenchymal (n = 49) types using TCGA data (Supplementary Table 3). For a and c, each symbol represents one individual, and data are shown as mean ± s.e.m. P values were determined by one-way ANOVA.

References

    1. De Henau O et al. Overcoming resistance to checkpoint blockade therapy by targeting PI3Kγ in myeloid cells. Nature 539, 443–447 (2016). - PMC - PubMed
    1. Kaneda MM et al. PI3Kγ is a molecular switch that controls immune suppression. Nature 539, 437–442 (2016). - PMC - PubMed
    1. Quail DF et al. The tumor microenvironment underlies acquired resistance to CSF-1R inhibition in gliomas. Science 352, aad3018 (2016). - PMC - PubMed
    1. Quail DF & Joyce JA Microenvironmental regulation of tumor progression and metastasis. Nat. Med 19, 1423–1437 (2013). - PMC - PubMed
    1. Colegio OR et al. Functional polarization of tumour-associated macrophages by tumour-derived lactic acid. Nature 513, 559–563 (2014). - PMC - PubMed

Publication types

MeSH terms