. 2019 May;22(5):762-769.
doi: 10.1038/s41593-019-0374-7. Epub 2019 Apr 8.

Distinct cortical-amygdala projections drive reward value encoding and retrieval

Affiliations

Distinct cortical-amygdala projections drive reward value encoding and retrieval

Melissa Malvaez et al. Nat Neurosci. 2019 May.

Abstract

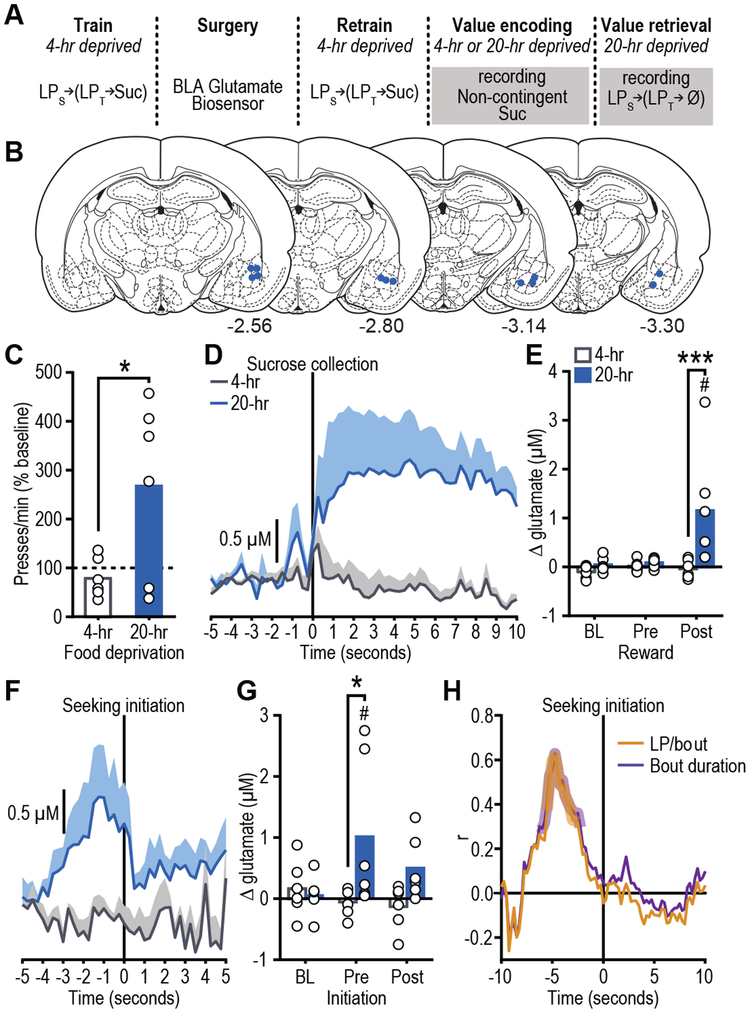
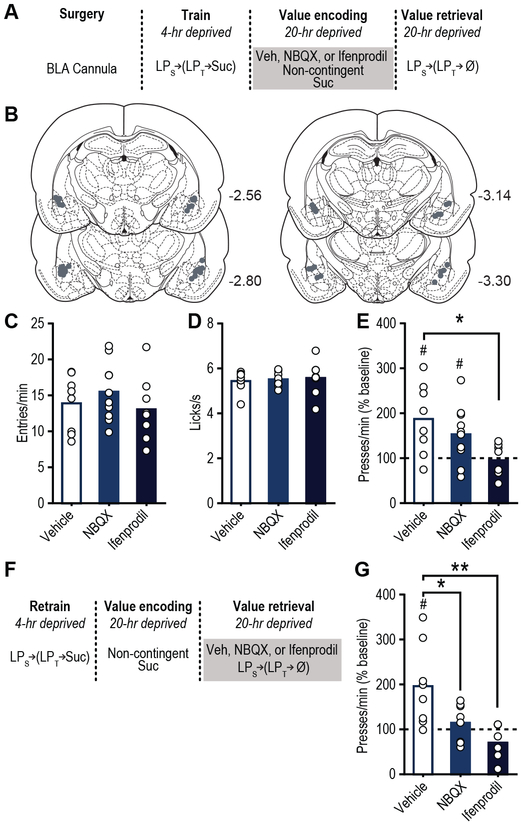
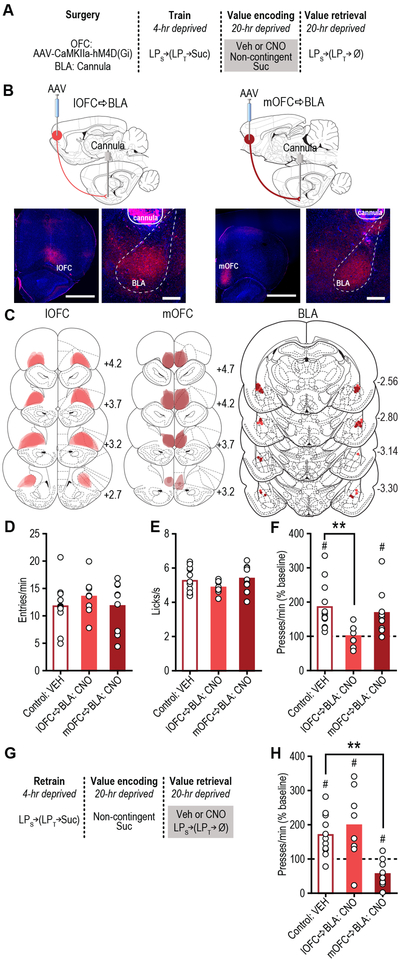
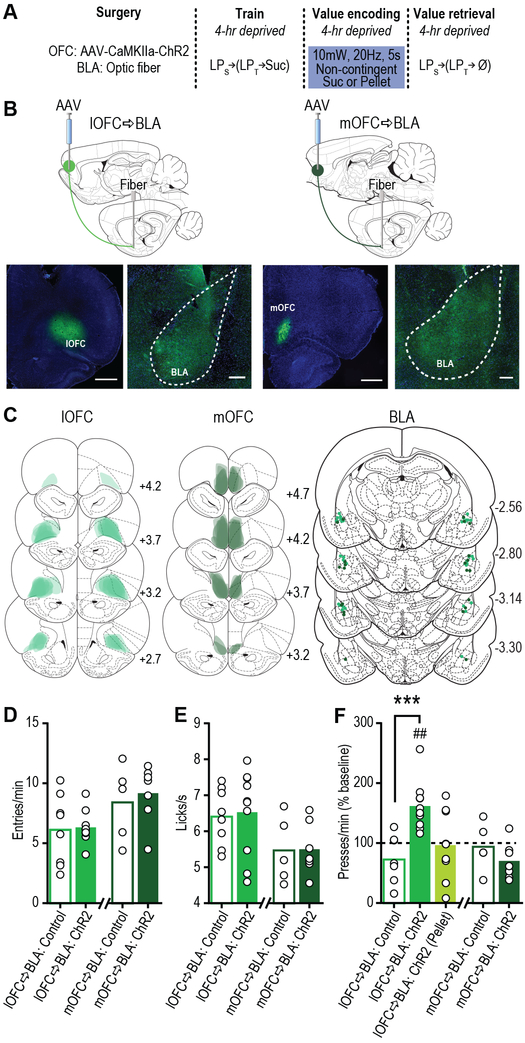
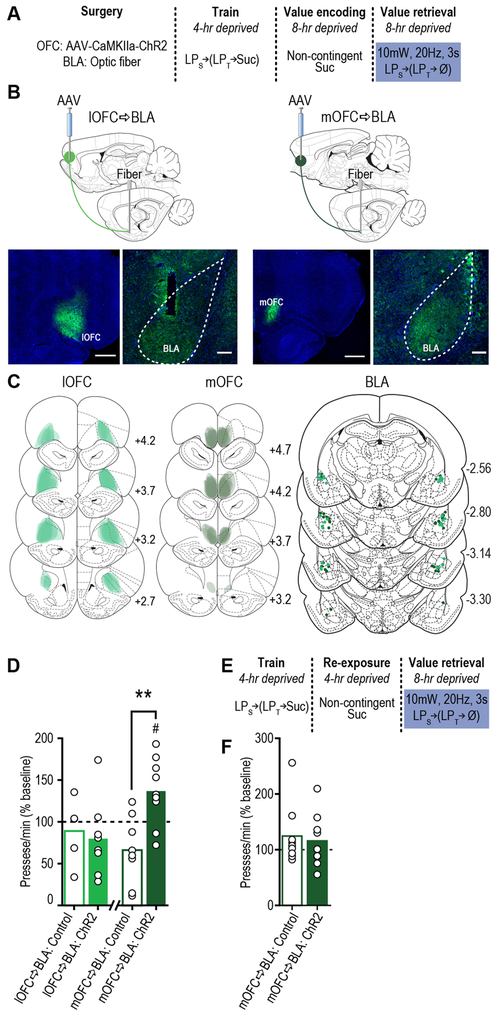
The value of an anticipated rewarding event is a crucial component of the decision to engage in its pursuit. But little is known of the networks responsible for encoding and retrieving this value. By using biosensors and pharmacological manipulations, we found that basolateral amygdala (BLA) glutamatergic activity tracks and mediates encoding and retrieval of the state-dependent incentive value of a palatable food reward. Projection-specific, bidirectional chemogenetic and optogenetic manipulations revealed that the orbitofrontal cortex (OFC) supports the BLA in these processes. Critically, the function of ventrolateral and medial OFC→BLA projections is doubly dissociable. Whereas lateral OFC→BLA projections are necessary and sufficient for encoding of the positive value of a reward, medial OFC→BLA projections are necessary and sufficient for retrieving this value from memory. These data reveal a new circuit for adaptive reward valuation and pursuit and provide insight into the dysfunction in these processes that characterizes myriad psychiatric diseases.


Conflict of interest statement

COMPETING FINANCIAL INTERESTS

The authors declare no biomedical financial interests or potential conflicts of interest.

Figures

Figure 1.
Figure 1.. BLA glutamate release tracks reward value encoding and retrieval.
(a) Procedure schematic (LPs, seeking lever press; LPt, taking lever press; Suc, sucrose; Ø, no sucrose delivered). (b) Representation of biosensor tip placements. Numbers represent anterior-posterior distance (mm) from bregma. (c) Reward-seeking press rate (seeking presses/min), normalized to baseline press rate (average of last-two training sessions in 4-hr food-deprived state prior to test; dashed line), during lever-pressing probe test in the hungry state for rats given prior non-contingent sucrose exposure in control sated (4-hr food-deprived; no value encoding) or hungry (20-hr deprived; value encoding opportunity) state (N=6 rats/group; mean + scatter). Data were analyzed by two-tailed unpaired t test (d) Trial-averaged BLA glutamate concentration v. time trace (shading reflects between-subject s.e.m) and (e) quantification (mean + scatter) of average glutamate change (N=6 biologically independent glutamate recordings/group) prior to (pre) and following (post) sucrose collection/consumption (occurring at time 0 s), or equivalent baseline periods (BL) during non-contingent sucrose re-exposure in sated or hungry. Two-way ANOVA was used followed by Bonferroni corrected post hoc test, between groups (***P=0.0009) or relative to baseline (#P=0.002). (f) Trial-averaged BLA glutamate concentration v. time trace and (g) quantification of average glutamate change (N=6 biologically-independent glutamate recordings/group) around bout-initiating reward-seeking presses during the lever-pressing probe test in the hungry state. Two-way ANOVA was used followed by Bonferroni corrected post hoc test, between groups (*P=0.018), or relative to BL (#P=0.026). (h) Pearson correlation coefficient (N=50 trials from 6 rats) between glutamate concentration at each time point around reward-seeking bout initiation and either total seeking presses in or the duration of the subsequent bout. Shaded region indicates significant correlation at least P<0.05.
Figure 2.
Figure 2.. BLA glutamate receptor activity is necessary for reward value encoding and retrieval.
(a) Procedure schematic (LPs, seeking lever press; LPt, taking lever press; Suc, sucrose; Ø, no sucrose delivery; Veh, Vehicle; NBQX, AMPA antagonist; Ifenprodil, NMDA antagonist). (b) Microinfusion injector tip placements. Numbers represent anterior-posterior distance (mm) from bregma. (c) Food-port entry rate (entries/min) and (d) palatability responses (lick frequency; licks/s) during non-contingent sucrose re-exposure in hungry state (20-hr deprived; value encoding opportunity) following intra-BLA infusion of Vehicle (N=8 rats), AMPA (N=10 rats), or NMDA (N=9 rats) antagonist (analyzed using one-way ANOVA), and subsequent (e) reward-seeking press rate (seeking presses/min), relative to baseline press rate (dashed line), during drug-free, lever-pressing probe test in hungry state (analyzed using one-way ANOVA followed by Bonferroni corrected post hoc test, between groups: *P=0.013; and one sample t test, relative to baseline: Vehicle, t7=3.11, #P=0.017; NBQX, t9=2.63, #P=0.027). (f) Procedure schematic. (g) Following off-drug sucrose re-exposure in hungry state, reward-seeking press rate, relative to baseline, during the on-drug (intra-BLA Vehicle (N=8 rats), AMPA (N=8 rats), or NMDA (N=7 rats) antagonist) lever-pressing probe test in the hungry state (analyzed using one-way ANOVA followed by Bonferroni corrected post hoc test, between groups: *P=0.038, **P=0.003; and one sample t test, relative to baseline: Vehicle, t7=3.021, #P=0.019). Data presented as mean + scatter.
Figure 3.
Figure 3.. lOFC→BLA and mOFC→BLA projections are necessary for reward value encoding and retrieval, respectively.
(a) Procedure schematic (LPs, seeking lever press; LPt, taking lever press; Suc, sucrose; Ø, no sucrose delivery; Veh, Vehicle; CNO, Clozapine N-oxide). (b) Top, schematic of chemogenetic approach for inactivation of lOFC (left; scale bar represents 1 mm) or mOFC (right; scale bar represents 1 mm) terminals in the BLA (scale bars represent 500 µm). Bottom, representative immunofluorescent images of HA-tagged hM4D(Gi) expression in lOFC (left) or mOFC (right) and cannula above terminal expression in the BLA. (c) Schematic representation of hM4D(Gi) expression in lOFC or mOFC and placement of microinfusion injector tips in the BLA for all subjects. Numbers represent anterior-posterior distance (mm) from bregma. (d) Food-port entry rate (entries/min) and (e) palatability responses (lick frequency, licks/s) during non-contingent sucrose re-exposure in hungry state (20-hr deprived; value encoding opportunity) following intra-BLA infusion of Vehicle (N=12 rats, ½ mOFC hM4D(Gi), ½ lOFC hM4D(Gi)) or CNO (1mM/0.5µl; lOFC→BLA:CNO, N=8 rats; mOFC→BLA:CNO, N=9 rats; data analyzed using one-way ANOVA), and subsequent (f) reward-seeking press rate (seeking presses/min), relative to baseline press rate (dashed line), during drug-free, lever-pressing probe test in hungry state (analyzed using one-way ANOVA followed by Bonferroni corrected post hoc test, between groups: **P=0.009; and one sample t test, relative to baseline: Control:Veh, t11=4.36, #P=0.001; mOFC→BLA:CNO, t8=3.07, #P=0.02). (g) Procedure schematic. (h) Following off-drug sucrose re-exposure in hungry state, reward-seeking press rate, relative to baseline, during the on-drug test (intra-BLA Vehicle (N=11 rats) or CNO (lOFC→BLA:CNO, N=8 rats; mOFC→BLA:CNO, N=9 rats; data analyzed using one-way ANOVA followed by Bonferroni corrected post hoc test, between groups: **P=0.003; and one sample t test, relative to baseline: Control:Veh, t10=3.86, #P=0.003; lOFC→BLA:CNO, t7=2.63, #P=0.03; mOFC→BLA:CNO, t8=3.34, #P=0.01). **P<0.01, between groups; #P<0.05 relative to baseline. Data presented as mean + scatter.
Figure 4.
Figure 4.. Optical stimulation of lOFC terminals in BLA concurrent with reward experience is sufficient to drive positive value assignment.
(a) Procedure schematic (LPs, seeking lever press; LPt, taking lever press; Suc, sucrose; Ø, no sucrose delivery). (b) Top, schematic of optogenetic approach for stimulation of lOFC (left; scale bar represents 1 mm) or mOFC (right; scale bar represents 1 mm) terminals in the BLA (scale bars represent 250 µm). Bottom, representative fluorescent images of ChR2-eYFP expression in lOFC (left) or mOFC (right) and BLA terminal field. (c) Schematic representation of ChR2 expression in lOFC or mOFC and placement of optical fiber tips in BLA for all subjects. Numbers represent anterior-posterior distance (mm) from bregma. (d) Food-port entry rate (entries/min) and (e) palatability responses (lick frequency, licks/s) during non-contingent sucrose re-exposure in control 4-hr food-deprived sated state. Light (10mW, 20Hz, 5 s) was delivered concurrent with each sucrose collection. Control groups consisted of half eYFP-only + 473 nm and half ChR2 + 589 nm light delivery. lOFC→BLA and mOFC→BLA data were each analyzed by two-tailed unpaired t test. lOFC→BLA:Control, N=8 rats; lOFC→BLA:ChR2, N=10 rats; mOFC→BLA:Control, N=5 rats; mOFC→BLA:ChR2, N=7 rats. (f) Reward-seeking press rate (seeking presses/min), relative to baseline press rate (dashed line), during manipulation-free, lever-pressing probe test in sated state. (Pellet) refers to the control condition of optical stimulation of lOFC terminals in BLA paired with stimulation of a task-irrelevant food pellet rather than sucrose. lOFC→BLA data were analyzed by one-way ANOVA followed by Bonferroni corrected post hoc tests, between groups: ***P=0.0009; and one sample t test, relative to baseline: lOFC→BLA:ChR2, t9=4.84, ##P=0.0009; mOFC→BLA data were analyzed by two-tailed unpaired t test. lOFC→BLA:Control, N=8 rats; lOFC→BLA:ChR2, N=10 rats; lOFC→BLA:ChR2 (Pellet), N=9 rats; mOFC→BLA:Control, N=5 rats; mOFC→BLA:ChR2, N=7 rats. Data presented as mean + scatter.
Figure 5.
Figure 5.. Optical stimulation of mOFC→BLA projections is sufficient to enhance reward value retrieval.
(a) Procedure schematic (LPs, seeking lever press; LPt, taking lever press; Suc, sucrose; Ø, no sucrose delivered). (b) Top, schematic of optogenetic approach for stimulation of lOFC (left) or mOFC (right) terminals in the BLA. Bottom, representative fluorescent images of ChR2-eYFP expression in lOFC (right; scale bar represents 1 mm) or mOFC (left; scale bar represents 1 mm) and BLA (scale bars represent 250 µm) terminal field. (c) Schematic representation of ChR2 expression in lOFC or mOFC and placement of fiber tips in BLA for all subjects. Numbers represent anterior-posterior distance (mm) from bregma. (d) Reward-seeking press rate (seeking presses/min), relative to baseline press rate (dashed line), during lever-pressing probe test in moderate (8-hr food-deprived) hunger state following sucrose re-exposure in 8-hr food-deprived state (a sub-threshold incentive learning opportunity). Light (10mW, 20Hz, 3 s, once/min) was delivered during this test. Control groups consisted of half eYFP-only + 473 nm and half ChR2 + 589 nm light delivery. lOFC→BLA and mOFC→BLA data were each anlayzed by two-tailed unpaired t test, and one sample t test, relative to baseline: mOFC→BLA:ChR2, t8=2.77, #P=0.024. lOFC→BLA:Control, N=5 rats; lOFC→BLA:ChR2, N=8 rats; mOFC→BLA:Control, N=8 rats; mOFC→BLA:ChR2, N=9 rats; (e) Procedure schematic for a separate group of all ChR2-expressing subjects for which the sub-threshold incentive learning was omitted. (f) Reward-seeking press rate, relative to baseline press rate, during lever-pressing probe test in moderate (8-hr food-deprived) hunger state following sucrose re-exposure in 4-hr food-deprived state. Light (10mW, 20Hz, 3 s, once/min) was delivered during this test. Within-subject control consisted of identical delivery of 589 nm light during lever pressing test (test order counterbalanced). mOFC→BLA(no incentive learning), N=9 rats. Data was analyzed by two-tailed paired t test. Data presented as mean + scatter.

Comment in

References

    1. Dickinson A & Balleine BW Motivational control over goal-directed action. Animal Learning and Behavior 22, 1–18 (1994).
    1. Wassum KM & Izquierdo A The basolateral amygdala in reward learning and addiction. Neurosci Biobehav Rev 57, 271–283 (2015). - PMC - PubMed
    1. Wassum KM, Ostlund SB, Maidment NT & Balleine BW Distinct opioid circuits determine the palatability and the desirability of rewarding events. Proc Natl Acad Sci U S A 106, 12512–12517 (2009). - PMC - PubMed
    1. Parkes SL & Balleine BW Incentive Memory: Evidence the Basolateral Amygdala Encodes and the Insular Cortex Retrieves Outcome Values to Guide Choice between Goal-Directed Actions. J Neurosci 33, 8753–8763 (2013). - PMC - PubMed
    1. West EA, et al. Transient inactivation of basolateral amygdala during selective satiation disrupts reinforcer devaluation in rats. Behav Neurosci 126, 563–574 (2012). - PMC - PubMed

Publication types