. 2019 Apr 5:5:5.
doi: 10.1038/s41531-019-0078-4. eCollection 2019.

Modeling Parkinson's disease in midbrain-like organoids

Affiliations

Modeling Parkinson's disease in midbrain-like organoids

Lisa M Smits et al. NPJ Parkinsons Dis. .

Abstract

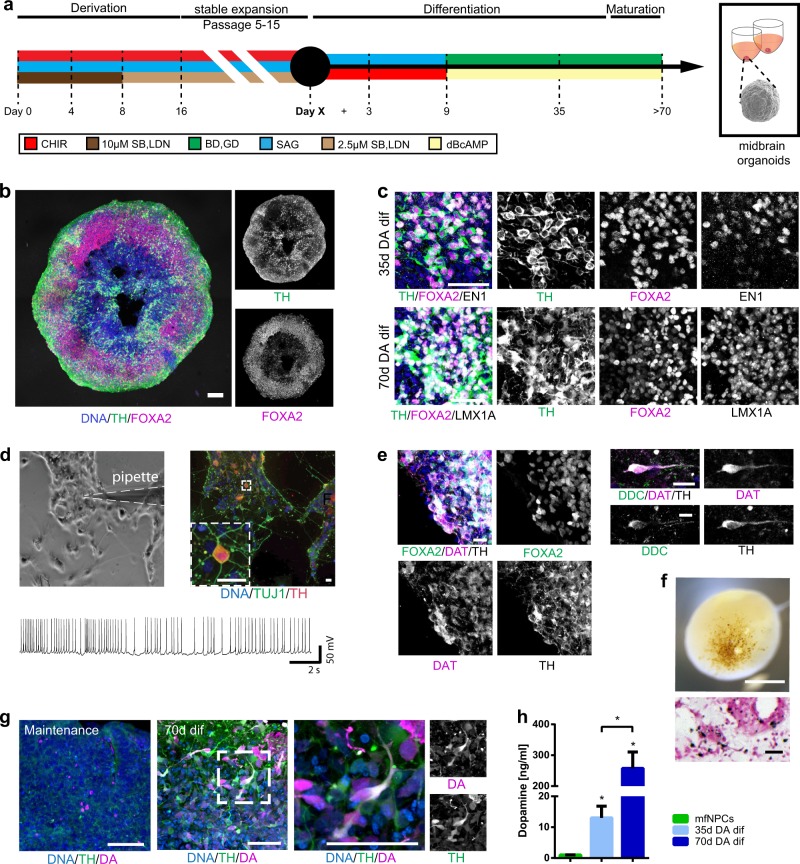
Modeling Parkinson's disease (PD) using advanced experimental in vitro models is a powerful tool to study disease mechanisms and to elucidate unexplored aspects of this neurodegenerative disorder. Here, we demonstrate that three-dimensional (3D) differentiation of expandable midbrain floor plate neural progenitor cells (mfNPCs) leads to organoids that resemble key features of the human midbrain. These organoids are composed of midbrain dopaminergic neurons (mDANs), which produce and secrete dopamine. Midbrain-specific organoids derived from PD patients carrying the LRRK2-G2019S mutation recapitulate disease-relevant phenotypes. Automated high-content image analysis shows a decrease in the number and complexity of mDANs in LRRK2-G2019S compared to control organoids. The floor plate marker FOXA2, required for mDAN generation, increases in PD patient-derived midbrain organoids, suggesting a neurodevelopmental defect in mDANs expressing LRRK2-G2019S. Thus, we provide a robust method to reproducibly generate 3D human midbrain organoids containing mDANs to investigate PD-relevant patho-mechanisms.


Conflict of interest statement

The authors declare no competing interests.

Figures

Fig. 1
Fig. 1
Generation of midbrain-specific organoids. a Illustration of the conditions used to differentiate spherical midbrain floor plate neural progenitor cells (mfNPCs) into human midbrain-specific organoids (hMOs). mfNPCs are stably expandable up to passage 15; day X indicates the start of dopaminergic differentiation. SB = SB-431542, LDN = LDN-193189, SAG = sonic hedgehog agonist, BD = brain-derived neurotrophic factor, GD = glial cell-derived neurotrophic factor. b Maximum intensity projection of midbrain dopaminergic neuron (mDAN) markers TH and FOXA2 in 70-day-old hMO sections. Scale bar is 100 μm. hMOs derived from mfNPC lines H1–3 (image shows line H3). c Immunohistological stainings of mDAN markers TH, FOXA2, EN1, and LMX1A in the center of hMO sections. Scale bar is 50 μm. hMOs derived from mfNPC lines H1–3 (images shows line H2). d Bright-field image showing neurons obtained from three-dimensional (3D) culture of line H4 where a recorded cell is attached to the patch-clamp pipette tip (×10 magnification). Scale bar is 20 µm. Representative current-clamp trace of the pace-making firing activity obtained from the recorded mDAN is shown. Experiment conducted with mfNPC lines H4, P2-GC, and P3-GC, in total 26 cells have been recorded, 12 of these showed a similar pattern; representative images and traces of line H4. e Representative immunohistological stainings of mDAN markers FOXA2, TH, dopamine decarboxylase (DDC), and dopamine transporter (DAT) at the edge of an organoid. Scale bar is 20 μm. hMOs were derived from mfNPC lines H1–4 (images show lines H3 and H1). f Appearance of dark granules in hMOs at day 255, derived from mfNPC line H1. Scale bar is 500 µm. Fontana-Masson staining reveals neuromelanin-like granules at the edge of the organoid section after 100 days in culture, derived from mfNPCs line H4. Scale bar is 50 µm. g Representative immunohistological staining of spherical maintenance mfNPCs and 70-day hMO sections (50 μm thickness, taken at the edge of a section) for TH and neurotransmitter dopamine (DA). Scale bar is 50 μm. hMOs derived from mfNPC lines H1–3 (images show line H3). h Quantitative analysis of DA extracted from the supernatant of mfNPCs and hMOs, *p < 0.05. The two time points analyzed in all the experiments were 35 and 70 days of differentiation. Data are presented as mean ± SEM (mfNPC line H3, 4 different passages, n = 4)
Fig. 2
Fig. 2
Disease modeling of Parkinson’s disease (PD) patient-derived midbrain-specific organoids. a Representative maximum intensity projection of TH-positive and FOXA2-positive cells in control and PD patient-specific human midbrain-specific organoids (hMOs) after 35 days of differentiation. Scale bar is 50 µm, magnification from the center of the organoid, images taken from line H3 and P3. b Heatmap comprising all features extracted by high-content automated image analysis. Dendrograms indicate clustering of genotypes and age (top) and features (left) and were obtained using the clustergram function in Matlab. ce Quantification of c TH and FOXA2 double-positive signal, d number of nodes in the TH network, and e TH-negative, FOXA2-positive signal. Data are presented as mean ± SEM (and comprised of following numbers of hMO sections: healthy hMOs H (midbrain floor plate neural progenitor cell (mfNPC) line H3 and H4): n = 26 (d10), n = 32 (d35), n = 38 (d70); patient-derived hMOs P (mfNPC line P3 and P4): n = 23 (d10), n = 36 (d35), n = 31 (d70); isogenic control hMOs H-G2019S (mfNPC line H3-G2019S and H4-G2019S): n = 18 (d10), n = 29 (d35), n = 28 (d70); isogenic control hMOs P-GC (mfNPC line P3-GC and P4-GC): n = 21 (d10), n = 38 (d35), n = 22 (d70)). Relevant statistical significances determined by two-way analysis of variance (ANOVA), Tukey’s multiple comparisons test are indicated with asterisks: *p <0.05, ***p <0.001, ****p <0.0001 (complete statistical evaluation shown in Supplementary Table 4)

References

    1. Lancaster MA, et al. Cerebral organoids model human brain development and microcephaly. Nature. 2013;501:373–379. doi: 10.1038/nature12517. - DOI - PMC - PubMed
    1. Muguruma K, Nishiyama A, Kawakami H, Hashimoto K, Sasai Y. Self-organization of polarized cerebellar tissue in 3D culture of human pluripotent stem cells. Cell Rep. 2015;10:537–550. doi: 10.1016/j.celrep.2014.12.051. - DOI - PubMed
    1. Qian X, et al. Brain-region-specific organoids using mini-bioreactors for modeling ZIKV exposure. Cell. 2016;165:1238–1254. doi: 10.1016/j.cell.2016.04.032. - DOI - PMC - PubMed
    1. Di Lullo E, Kriegstein AR. The use of brain organoids to investigate neural development and disease. Nat. Rev. Neurosci. 2017;18:573–584. doi: 10.1038/nrn.2017.107. - DOI - PMC - PubMed
    1. Lee CT, Bendriem RM, Wu WW, Shen RF. 3D brain organoids derived from pluripotent stem cells: promising experimental models for brain development and neurodegenerative disorders. J. Biomed. Sci. 2017;24:59. doi: 10.1186/s12929-017-0362-8. - DOI - PMC - PubMed