. 2019 Apr 5:2:127.
doi: 10.1038/s42003-019-0367-9. eCollection 2019.

Differences in glutamate uptake between cortical regions impact neuronal NMDA receptor activation

Affiliations

Differences in glutamate uptake between cortical regions impact neuronal NMDA receptor activation

Jennifer Romanos et al. Commun Biol. .

Abstract

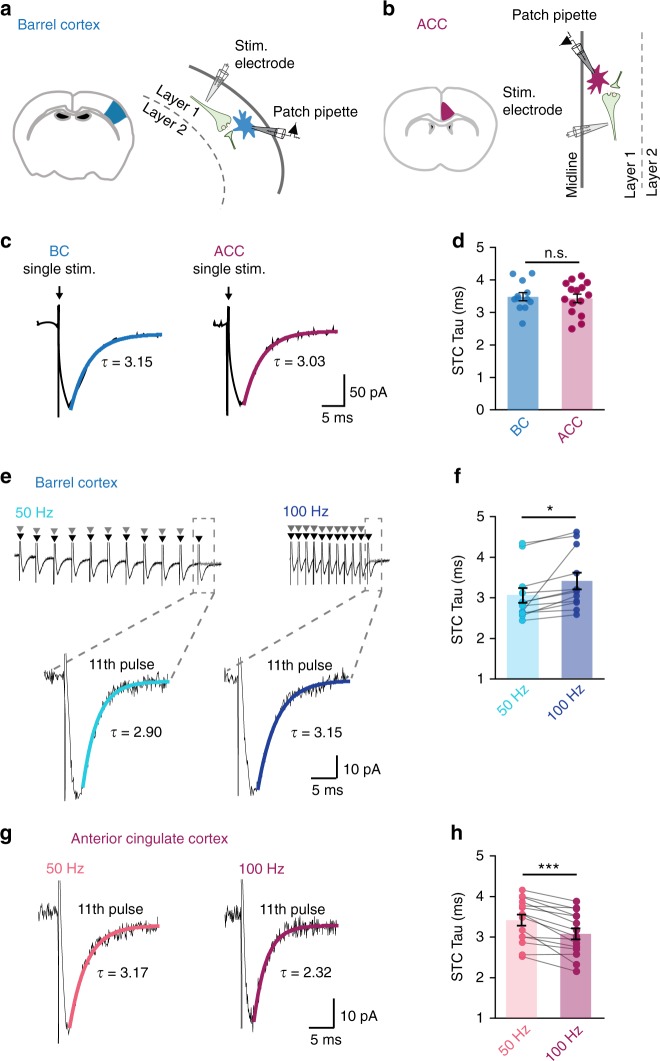
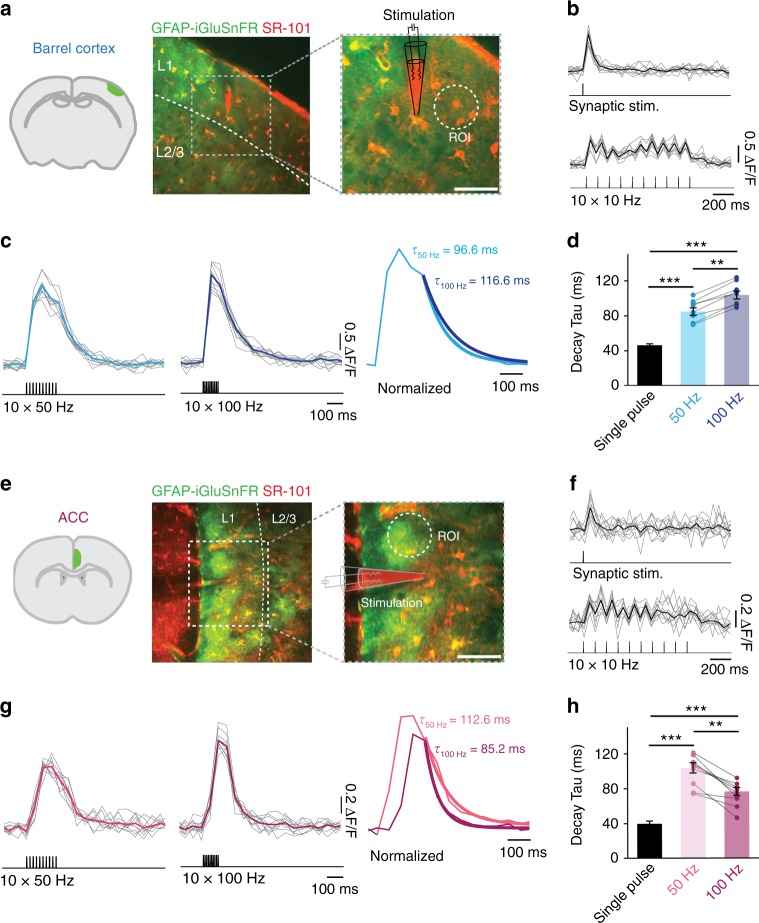
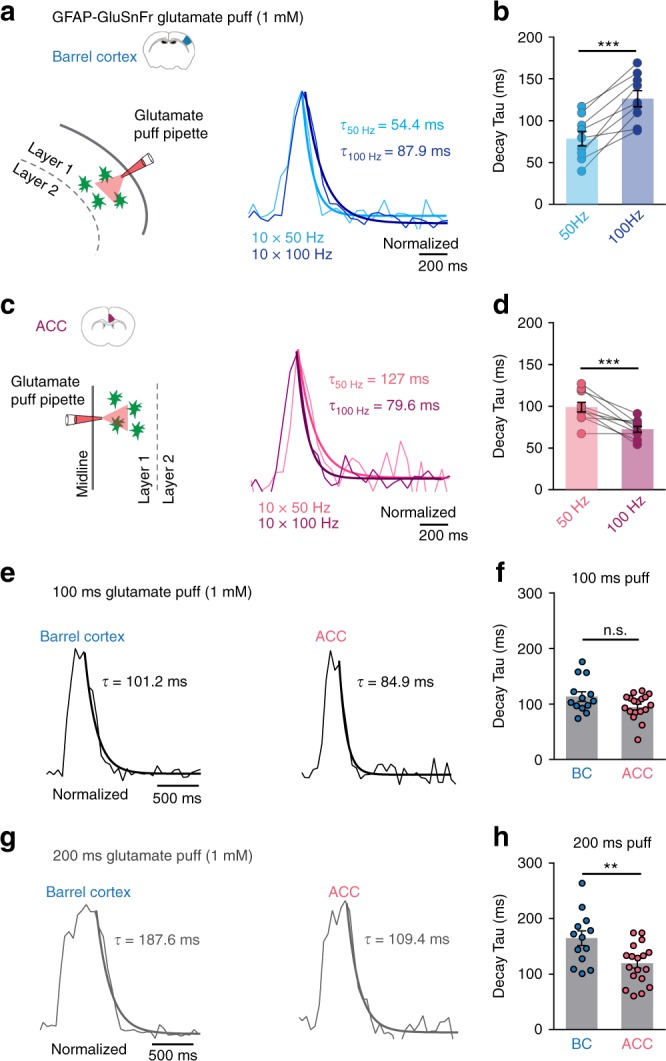
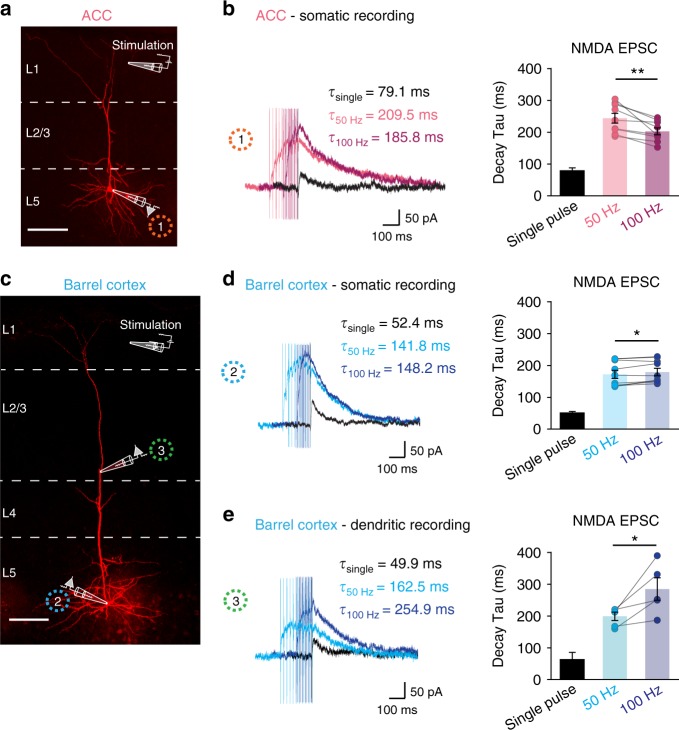
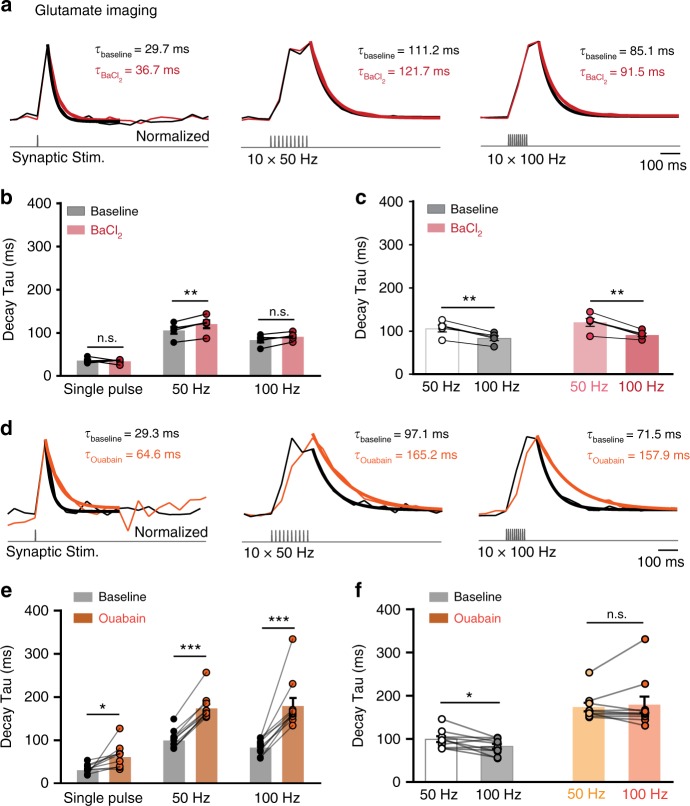
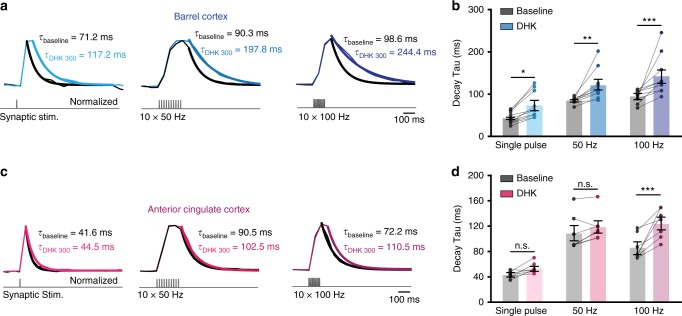
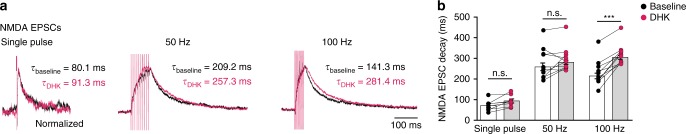
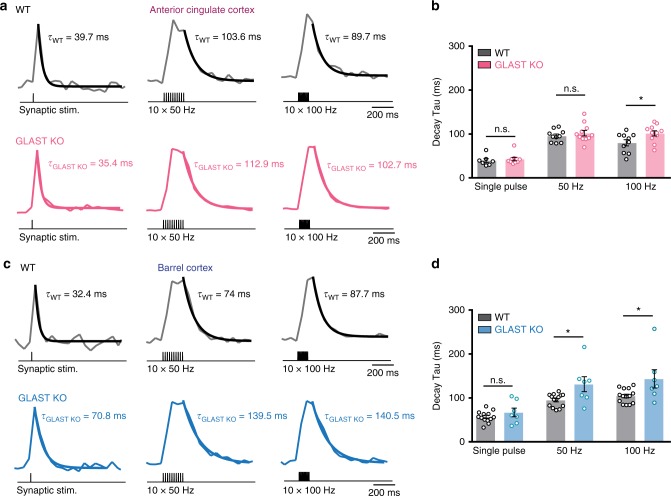
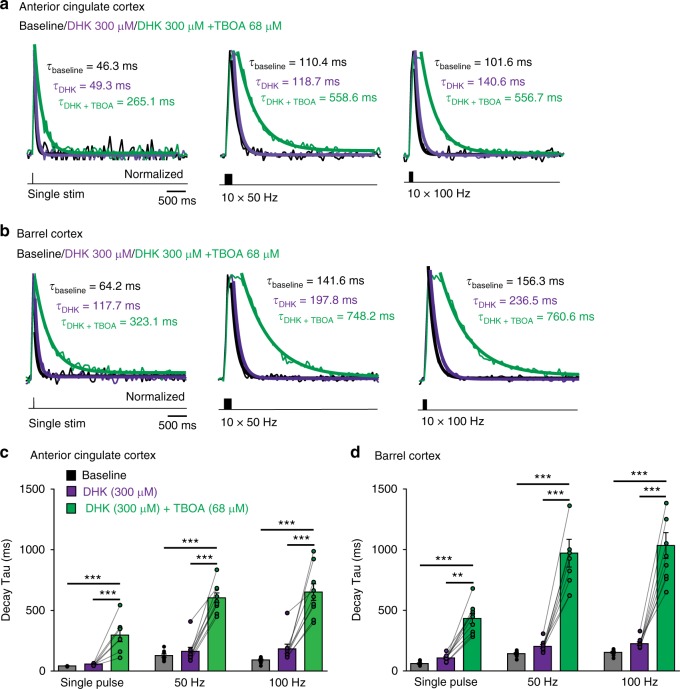
Removal of synaptically-released glutamate by astrocytes is necessary to spatially and temporally limit neuronal activation. Recent evidence suggests that astrocytes may have specialized functions in specific circuits, but the extent and significance of such specialization are unclear. By performing direct patch-clamp recordings and two-photon glutamate imaging, we report that in the somatosensory cortex, glutamate uptake by astrocytes is slower during sustained synaptic stimulation when compared to lower stimulation frequencies. Conversely, glutamate uptake capacity is increased in the frontal cortex during higher frequency synaptic stimulation, thereby limiting extracellular buildup of glutamate and NMDA receptor activation in layer 5 pyramidal neurons. This efficient glutamate clearance relies on Na+/K+-ATPase function and both GLT-1 and non-GLT-1 transporters. Thus, by enhancing their glutamate uptake capacity, astrocytes in the frontal cortex may prevent excessive neuronal excitation during intense synaptic activity. These results may explain why diseases associated with network hyperexcitability differentially affect individual brain areas.


Conflict of interest statement

The authors declare no competing interests.

Figures

Fig. 1
Fig. 1
Astrocytic glutamate uptake is facilitated in the ACC during high-frequency synaptic stimulation. a, b Schemes representing the astrocytic whole-cell patch-clamp recordings in layer 1 of the barrel cortex (a) and in layer 1 of the ACC (b) in acute brain slices. Currents were evoked by focal electrical stimulation via a theta-glass pipette placed in layer 1 in proximity to the recorded astrocyte. c Representative traces of the inward current evoked in an astrocyte by a single pulse stimulation in the barrel cortex (left) and in the ACC (right). d The average decay time of the STCs elicited by a single stimulation in the barrel cortex (τdecay = 3.5 ± 0.13 ms; n = 12) is similar to that in the ACC (τdecay = 3.45 ± 0.13 ms; n = 15). e Superimposed representative traces of the inward current evoked in an astrocyte by an extracellular stimulation train of 11 pulses (black) and a train of 10 pulses (gray) at 50 Hz and 100 Hz in the barrel cortex. f In the barrel cortex, the average STCs decay time elicited by the 11th pulse of 50 Hz trains is significantly faster than that elicited by the 11th pulse of 100 Hz trains (n = 12, N = 7, *P = 0.0162) each point represents the STC decay time in one astrocyte at 50 Hz (light blue) then at 100 Hz (dark blue). g Same as (e) for the anterior cingulate cortex. h In the ACC, the average STCs decay time elicited by the 11th pulse of 50 Hz trains is significantly slower than that elicited by the 11th pulse of 100 Hz trains (n = 15, N = 6, ***P < 0.0001). Each point represents the STC decay time of one astrocyte at 50 Hz (pink) then at 100 Hz (purple). Representative traces are the average of at least five sweeps. n = number of cells, N = number of mice. Data are mean ± SEM. Two-tailed paired t test
Fig. 2
Fig. 2
Extrasynaptic glutamate is cleared faster during high-frequency stimulations in the ACC in contrast to the BC. a Typical experiment showing the extent of expression of iGluSnFR in the adult mouse barrel cortex. The glutamate sensor was expressed specifically on the plasma membrane of cortical astrocytes (GFAP-iGluSnFr, green channel). In red, astrocytes were stained with Sulforhodamine-101 (SR-101). Theta-glass electrode for synaptic stimulation was placed in the inner layer one and glutamate was imaged from a region of interest (ROI) adjacent to the electrode. Scale bar = 40 μm. ac Upon synaptic stimulation: single stimulation, 10 × 10 Hz (b), 10 × 50 Hz, and 10 × 100 Hz (c) robust and consistent increases in iGluSnFr emission could be detected. Thick lines represent the average of the responses and the mono-exponential fit of the decay. d The decay kinetics of the averaged transients are slower following 100 Hz stimulation compared with 50 Hz (n = 8, **P < 0.001) and decay kinetics of the transients at both 50 and 100 Hz are significantly slower than those from a single pulse (n = 8, N = 3, ***P < 0.0001). eg same as (ac) for the ACC. Scale bar = 40 μm. h The decay kinetics of the averaged transients are faster following 100 Hz stimulations compared with 50 Hz (n = 8, **P < 0.001) and decay kinetics of the transients at both 50 and 100 Hz are significantly slower than those at single pulse (n = 8, N = 3, ***P < 0.0001). n = number of slices, N = number of mice. Data are mean ± SEM. One-way ANOVA with Bonferroni post hoc test
Fig. 3
Fig. 3
Exogenous glutamate is scavenged differently in the BC and in the ACC. a Left: cartoon depicting localized glutamate puff (1 mM) through a pipette in layer 1 of the barrel cortex. Right: example traces of the glutamate puff-evoked iGluSnFr responses triggered by ten short (8 ms) puffs at 50 Hz (light blue) and 100 Hz (dark blue) in the BC. b The decay of the glutamate puff-evoked iGluSnFr responses in the BC upon 100 Hz stimulation is slower compared with 50 Hz (n = 9, ***P = 0.0001). c Left: same as a but in the ACC. Right: Example traces of the glutamate puff-evoked iGluSnFr responses triggered by ten short puffs at 50 Hz (light pink) and 100 Hz (dark pink) in the ACC. d The decay of the glutamate puff-evoked iGluSnFr responses in the ACC upon 100 Hz stimulation is faster compared with 50 Hz (n = 10, ***P = 0.0009). e Example traces of glutamate puff-evoked iGluSnFr responses triggered by continuous 100 ms in the BC and in the ACC. f The decay of glutamate puff-evoked iGluSnFr responses by 100 ms stimulations was slightly but not significantly slower in the BC compared with the ACC (BC: n = 13, ACC: n = 18, P = 0.059). g Example traces of 200 ms glutamate puffs in the BC and in the ACC. h Upon continuous 200 ms glutamate puffs, the decay of iGluSnFr evoked signals were significantly slower in the BC compared with the ACC (BC: n = 13, NBC = 3, ACC: n = 18, NACC = 3, **P = 0.0053). Traces normalized to the peak. n = number of slices, N = number of mice. Data are mean ± SEM. Two-tailed paired t test and two-tailed unpaired t test
Fig. 4
Fig. 4
NMDA EPSCs in layer 5 pyramidal neurons are faster following high-frequency stimulations in the ACC. a Image of patch-clamp recording from soma of a biocytin-labeled layer 5 (L5) pyramidal cell in the ACC showing the location of the recording and stimulation pipettes (layer 5 and inner layer 1, respectively). Scale bar = 100 μm. b Representative traces of NMDA-evoked EPSCs in soma of L5 pyramidal cells in the ACC following single stimulation, trains of 10 stimuli at 50 and 100 Hz (holding potential at + 40 mV). The decay kinetics of NMDA-evoked EPSCs are faster following trains of 100 Hz stimulation than following 50 Hz stimulation (n = 9, N = 6, **P = 0.005). c Image of a biocytin-labeled L5 pyramidal cell in the BC. Whole-cell patch-clamp recordings were either acquired from the soma or from the apical dendrite. Scale bar = 100 μm. d Somatic recordings: representative traces of NMDA-evoked EPSCs in soma of L5 pyramidal cells in the BC following single stimulation, trains of 10 stimuli at 50 and 100 Hz. The decay kinetics of NMDA-evoked EPSCs in the soma of L5 pyramidal cells is slightly slower (by 4%) upon 100 Hz stimulations compared with 50 Hz stimulations (n = 9, N = 6, *P = 0.025). e Dendritic recordings: representative traces of NMDA-evoked EPSCs in the recorded dendrites. The decay kinetics of NMDA-evoked EPSCs in the dendrites of L5 pyramidal cells becomes 43.2% slower upon 100 Hz stimulations compared with 50 Hz stimulations (n = 5, N = 5, *P = 0.04). n = number of cells, N = number of mice. Data are mean ± SEM. Two-tailed paired t test
Fig. 5
Fig. 5
Role of K+ uptake and Na+/K+-ATPase activity in glutamate clearance in the ACC. a Transients of iGluSnFR signals at baseline (black traces) evoked by single stimulation, trains of 50 Hz and 100 Hz stimuli and in the presence of 200 µM BaCl2 (red traces). b Blockade of KIR-dependent K+ uptake by BaCl2 did not affect glutamate decay kinetics following a single stimulation (baseline: 35.6 ± 2.7 ms; BaCl2: 34.3 ± 2.3 ms; n = 5, P > 0.05). However, BaCl2 significantly slowed the decay of iGluSnFR signals in the ACC at 50 Hz by 13% (baseline: 105.9 ± 7.7 ms; BaCl2: 119 ± 9.1 ms; n = 5 slices, ** P < 0.01). The presence of BaCl2 had smaller effects on the decay kinetics at 100 Hz (baseline: 83.1 ± 0.1 ms; BaCl2: 91.0 ± 8.9 ms, n = 5, P > 0.05). c In the presence of BaCl2 in the ACC, the decay of glutamate transients remain significantly faster at 100 Hz (91 ± 8.9 ms) compared with 50 Hz (119 ± 9.1 ms; n = 5 slices, N = 1, **P = 0.006). Traces normalized to the peak. d Same as (a), but in the presence of 5 µM ouabain (orange traces). e Blockade of Na+/K+-ATPase by ouabain slowed down glutamate transients drastically at all stimulation intensities with a larger effect at 100 Hz (single pulse, baseline: 30.6 ± 3.2 ms; ouabain: 61.42 ± 8.7 ms; n = 10 slices, * P < 0.05. At 50 Hz, baseline: 99.3 ± 6.6 ms; ouabain: 173.4 ± 9.7 ms; n = 10 slices, ***P < 0.0001. At 100 Hz: baseline: 82.7 ± 5.7 ms; ouabain: 179.1 ± 18.6 ms, n = 10, ***P < 0.0001, n = number of slices, N = number of mice). f In the presence of ouabain in the ACC, the decay of glutamate transients becomes comparable, with non-significant difference between 50 and 100 Hz. Traces normalized to the peak. Data are mean ± SEM. Two-way RM ANOVA test and two-tailed paired t test
Fig. 6
Fig. 6
Complete blockade of GLT-1 transporters reverses glutamate uptake facilitation at 100 Hz in the ACC. a Representative responses of iGluSnFr signal in the barrel cortex following synaptic stimulation (single stimulation, 10 × 50 Hz and 10 × 100 Hz) during baseline (black traces) and after application of DHK (300 μM, blue traces). b Decay kinetics of extrasynaptic glutamate transients are similarly and significantly slower in the presence of DHK (300 μM) following single pulse stimulation (n = 10, *P < 0.05), 50 Hz stimulation (n = 10, **P < 0.01) and following 100 Hz stimulation (n = 10, N = 3, **P < 0.001). c Same as (a) for the ACC. d Decay kinetics of extrasynaptic glutamate transients following single pulse and 50 Hz stimulation are not affected by the presence of DHK (n = 7, P > 0.05). However, following 100 Hz stimulation the decay kinetics become significantly slower in the presence of DHK (n = 7, N = 3, ***P < 0.0001). Traces normalized to the peak. n = number of slices, N = number of mice. Data are mean ± SEM. Two-way RM ANOVA test
Fig. 7
Fig. 7
Effect of DHK on NMDA current kinetics in the ACC. a Representative traces of NMDA currents (layer 1 synaptic stimulation) normalized to the peak amplitude recorded from layer 5 pyramidal cells in the ACC following single pulse, trains of ten pulses at 50 and 100 Hz (extracellular synaptic stimulations) at baseline (black traces) and in the presence of the GLT-1 antagonist DHK (250 μM, purple traces). Holding potential at + 40 mV. b The decay kinetics of NMDA-evoked EPSCs are slightly but not significantly slower in the presence of DHK at single pulse (baseline: 72.3 ± 9.2 ms; DHK: 93.9 ± 9.9 ms, n = 8, P > 0.05) and 50 Hz stimulations (baseline: 259.1 ± 18.6 ms; DHK: 281.4 ± 10.1 ms, n = 9, P > 0.05). However, at 100 Hz, the decay kinetics become significantly slower in the presence of DHK (baseline: 215 ± 13.6 ms; DHK: 305 ± 9.1 ms, n = 9, N = 3, *** P < 0.001). n = number of cells, N = number of mice. Data are mean ± SEM. Two-way RM ANOVA test
Fig. 8
Fig. 8
Temporal profile of extrasynaptic glutamate clearance is slower in GLAST KO mice in the ACC and BC. a Example traces of iGluSnFr responses in the anterior cingulate cortex (ACC) following synaptic stimulation (single stimulation, 10 × 50 Hz and 10 × 100 Hz) in WT mice (black traces) and GLAST KO mice (GLASTCreERT2/CreERT2 pink traces). b In the ACC, GLAST KO mice show slower kinetics of the events only at 100 Hz compared with WT mice (nWT = 10, nGLAST KO = 11, NWT = 6, NGLAST KO = 3; Psingle = 0.58, P50 Hz = 0.42, *P100 Hz = 0.02). c Same as (a) but in the BC. d In the BC, GLAST KO mice show slower kinetics of the events at both 50 Hz and 100 Hz compared with WT mice (nWT = 14, nGLAST KO = 7, NWT = 6, NGLAST KO = 3; Psingle = 0.26, *P50 Hz = 0.01, *P100 Hz = 0.02). n = number of slices, N = number of mice. Data are mean ± SEM. Two-tailed unpaired t test
Fig. 9
Fig. 9
Contribution of GLT-1 and non-GLT1 transporters to glutamate uptake. a Example traces of iGluSnFr responses in the ACC following synaptic stimulation (single stimulation, 10 × 50 Hz and 10 × 100 Hz) during baseline (black traces), in the presence of 300 µM DHK, which completely blocks GLT-1 (purple traces) and in the presence of both DHK 300 µM and 68 µM DL-TBOA (green traces), which also blocks about 50% of GLAST. Thick lines are mono-exponential fits. b Similar to (a) but in the BC. c In the ACC, blocking about 50% of GLAST in addition to GLT-1 (green bars) strongly slows the kinetics of the events at all stimulations compared with only blocking GLT-1 by DHK (purple bars; slowdown by 413% for single stim, by 271% for 50 Hz and by 255% for 100 Hz; n = 9, N = 3, ***Psingle < 0.001, ***P50 Hz, 100 Hz < 0.0001). d In the BC, blocking 50% of GLAST in addition to GLT-1 (green bars) strongly slows the kinetics of the events at all stimulation frequencies compared to only blocking GLT-1 by DHK (purple bars; slowdown by 300% for single stim, by 380% for 50 Hz and by 360% for 100 Hz; n = 9, N = 3, **Psingle < 0.01, ***P50 Hz, 100 Hz < 0.0001). Please note the different time scale compared to the other figures. Traces normalized to the peak. n = number of slices, N = number of mice. Data are mean ± SEM. Two-way RM ANOVA test

References

    1. Danbolt NC. Glutamate uptake. Prog. Neurobiol. 2001;65:1–105. doi: 10.1016/S0301-0082(00)00067-8. - DOI - PubMed
    1. Clements JD, Lester RA, Tong G, Jahr CE, Westbrook GL. The time course of glutamate in the synaptic cleft. Science. 1992;258:1498–1501. doi: 10.1126/science.1359647. - DOI - PubMed
    1. Chiu DN, Jahr CE. Extracellular Glutamate in the Nucleus Accumbens Is Nanomolar in Both Synaptic and Non-synaptic Compartments. Cell Rep. 2017;18:2576–2583. doi: 10.1016/j.celrep.2017.02.047. - DOI - PMC - PubMed
    1. Bergles DE, Diamond JS, Jahr CE. Clearance of glutamate inside the synapse and beyond. Curr. Opin. Neurobiol. 1999;9:293–298. doi: 10.1016/S0959-4388(99)80043-9. - DOI - PubMed
    1. Chalifoux JR, Carter AG. Glutamate spillover promotes the generation of NMDA spikes. J. Neurosci. 2011;31:16435–16446. doi: 10.1523/JNEUROSCI.2777-11.2011. - DOI - PMC - PubMed

Publication types