. 2019 Oct;56(10):6986-7002.
doi: 10.1007/s12035-019-1565-7. Epub 2019 Apr 8.

Increased MDR1 Transporter Expression in Human Brain Endothelial Cells Through Enhanced Histone Acetylation and Activation of Aryl Hydrocarbon Receptor Signaling

Affiliations

Increased MDR1 Transporter Expression in Human Brain Endothelial Cells Through Enhanced Histone Acetylation and Activation of Aryl Hydrocarbon Receptor Signaling

Dahea You et al. Mol Neurobiol. 2019 Oct.

Abstract

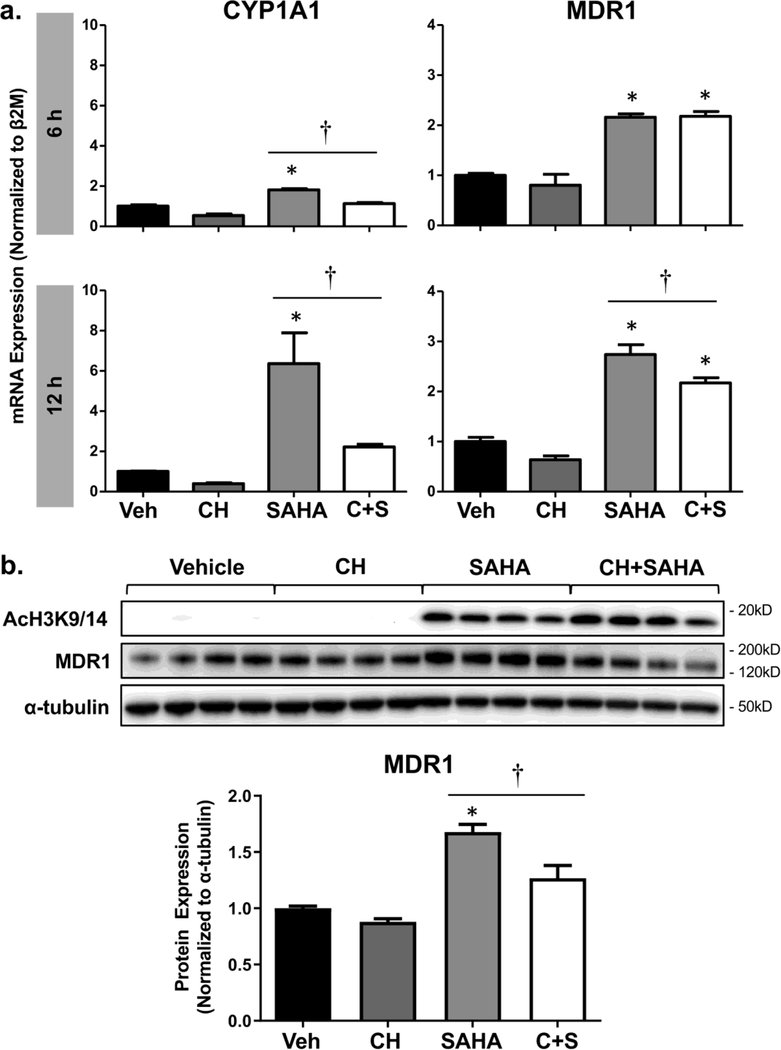
Multidrug resistance protein 1 (MDR1, ABCB1, P-glycoprotein) is a critical efflux transporter that extrudes chemicals from the blood-brain barrier (BBB) and limits neuronal exposure to xenobiotics. Prior studies in malignant cells demonstrated that MDR1 expression can be altered by inhibition of histone deacetylases (HDAC), enzymes that modify histone structure and influence transcription factor binding to DNA. Here, we sought to identify the mechanisms responsible for the up-regulation of MDR1 by HDAC inhibitors in human BBB cells. Immortalized human brain capillary endothelial (hCMEC/D3) cells were treated with HDAC inhibitors and assessed for MDR1 expression and function. Of the HDAC inhibitors profiled, valproic acid (VPA), apicidin, and suberoylanilide hydroxamic acid (SAHA) increased MDR1 mRNA and protein levels by 30-200%, which corresponded with reduced intracellular accumulation of the MDR1 substrate rhodamine 123. Interestingly, induction of MDR1 mRNA by HDAC inhibitors mirrored increases in the expression of the aryl hydrocarbon receptor (AHR) and its target gene cytochrome P450 1A1. To explore the role of AHR in HDAC inhibitor-mediated regulation of MDR1, a pharmacological activator (β-naphthoflavone, βNF) and inhibitor (CH-223191, CH) of AHR were tested. The induction of MDR1 in cells treated with SAHA was amplified by βNF and attenuated by CH. Furthermore, SAHA increased the binding of acetylated histone H3K9/K14 and AHR proteins to regions of the MDR1 promoter that contain AHR response elements. In conclusion, HDAC inhibitors up-regulate the expression and activity of the MDR1 transporter in human brain endothelial cells by increasing histone acetylation and facilitating AHR binding at the MDR1 promoter.

Keywords: Aryl hydrocarbon receptor; Blood–brain barrier; HDAC; MDR1; Transport.


Conflict of interest statement

Conflicts of Interest: The authors declare that they have no conflicts of interest.

Figures

Fig. 1.
Fig. 1.. MDR1 expression and function in human brain microvascular endothelial cells treated with HDAC inhibitors.
(a) hCMEC/D3 cells (n=3–6) were treated with vehicle (veh) or six HDAC inhibitors (5mM VPA, 0.25mM NaB, 1nM romidepsin (Romi), 0.5μM apicidin (Api), 10μM SAHA, or 0.25μM TSA) for 12 h (black) or 24 h (white) and analyzed for mRNA expression of MDR1. Data were normalized to beta2-microglobulin and presented as mean ± SEM. Data were analyzed by one-way ANOVA between treatments within each time point (*), and by two-way ANOVA to compare between the two time points (†), with statistical significance at p < 0.05; (b) hCMEC/D3 cells (n=3–4) were treated with vehicle or six HDAC inhibitors for 24 h and analyzed for protein expression of acetylated histone H3K9/14 or MDR1 by western blot analysis followed by densitometry to semi-quantify protein levels. Alpha-tubulin (α-tubulin) was used as a loading control. Data are presented as mean ± SEM and analyzed by one-way ANOVA. Asterisks (*) represent a statistical difference (p < 0.05) between vehicle- and HDAC inhibitor-treated cells; (c) MDR1 function after the exposure to HDAC inhibitors was assessed by measuring the cellular accumulation of a fluorescent MDR1 substrate, rhodamine 123 (7.5μM), in the presence or absence of the MDR1 inhibitor, verapamil (100μM), using the Nexcelom Cellometer Vision (n=4). Intracellular fluorescence was quantified as mean relative fluorescence intensity. The bar graph is presented with mean ± SEM as analyzed by 2-way ANOVA to compare each treatment group to vehicle (*) and within each treatment group (†), with statistical significance at p < 0.05
Fig. 2.
Fig. 2.. Concentration-dependent regulation of MDR1 expression in human brain microvascular endothelial cells treated with HDAC inhibitors.
hCMEC/D3 cells (n=3–6) were treated with vehicle or increasing concentrations of VPA, apicidin, or SAHA for 12 h and 24 h and analyzed for MDR1 mRNA (a) and protein (b), respectively. Data were normalized to beta2-microglobulin for mRNA and alpha-tubulin (α-tubulin) for protein, and presented as mean ± SEM. Asterisks (*) represent a statistical difference (p < 0.05) between vehicle- and HDAC inhibitor-treated cells
Fig. 3.
Fig. 3.. The enrichment of acetylated histone H3 proteins and DNA binding in human brain microvascular endothelial cells treated with SAHA.
(a) hCMEC/D3 cells (n=3–10) were treated with vehicle or 10μM SAHA for 24 h and cytosolic and nuclear extracts were collected. The relative protein expression of acetylated histone H3K9/14 in each compartment was analyzed by western blot analysis followed by densitometry to semi-quantify protein levels. Total histone H3 was used as a loading control. Data are presented as mean ± SEM and analyzed by a two-tailed Student’s t-test compared to the vehicle control (*) for each compartment with statistical significance at p < 0.05; (b) The locations of different response elements and transcription factor binding sites at human MDR1/ABCB1 gene (NC_000007.14) promoter region. DRE: Dioxin Response Element; TSS: Transcription Start Site; AHR: Aryl Hydrocarbon Receptor; (c) hCMEC/D3 cells (n=3–6) were treated with vehicle or 10μM SAHA for 24 h and analyzed for relative histone H3K9/14 acetylation at different regions of the MDR1/ABCB1 gene promoter. Data collected from qPCR amplification of ChIP samples were presented as mean ± SEM. Data were analyzed by two-tailed Student’s t-test between treatment groups with statistical significance at p < 0.05. The graph titles correspond to the labels in Fig. 3b
Fig. 4.
Fig. 4.. AHR expression and activity in human brain microvascular endothelial cells treated with HDAC inhibitors.
(a) hCMEC/D3 cells (n=3–6) were treated with vehicle (Veh) or six HDAC inhibitors (5mM VPA, 0.25mM NaB, 1nM romidepsin (Romi), 0.5μM apicidin (Api), 10μM SAHA, or 0.25μM TSA) for 12 h and analyzed for mRNA expression of AHR and CYP1A1. Data were normalized to beta2-microglobulin and presented as mean ± SEM. Data were analyzed by one-way ANOVA compared to the vehicle control (*) with statistical significance at p < 0.05; (b) Correlation between changes in the expression of MDR1 and AHR and CYP1A1 mRNA levels after 12 h treatment with HDAC inhibitors was analyzed by Pearson’s correlation test; (c) hCMEC/D3 cells (n=3–7) were treated with vehicle or 10μM SAHA for 24 h and cytosolic and nuclear extracts were collected. The relative protein expression of AHR in each compartment was analyzed by western blot analysis followed by densitometry to semi-quantify protein levels. Total histone H3 was used as a loading control. Data are presented as mean ± SEM and analyzed by a two-tailed Student’s t-test compared to the vehicle control (*) for each compartment with statistical significance at p < 0.05
Fig. 5.
Fig. 5.. MDR1 expression in human brain microvascular endothelial cells treated with SAHA and an AHR activator.
(a) hCMEC/D3 cells (n=3) were treated with vehicle (Veh), AHR activator (βNF, β-naphthoflavone 5μM) and/or 10μM SAHA for 6 h or 12 h. Total RNA was isolated and analyzed for mRNA expression of MDR1 and CYP1A1, the positive control, by qPCR. Data were normalized to beta2-microglobulin and presented as mean ± SEM. Data were analyzed by one-way ANOVA compared to the vehicle control (*), and between SAHA and β+S (βNF + SAHA) (†) with statistical significance at p < 0.05; (b) hCMEC/D3 cells (n=3) were treated with Veh, βNF 5μM and/or 10μM SAHA for 24 h and analyzed for protein expression of acetylated histone H3K9/14 or MDR1 by western blot analysis followed by densitometry to semi-quantify protein levels. Alpha-tubulin (α-tubulin) was used as a loading control. Data are presented as mean ± SEM and analyzed by one-way ANOVA compared to the vehicle control (*), and between SAHA and β+S (†) with statistical significance at p < 0.05
Fig. 6.
Fig. 6.. MDR1 expression in human brain microvascular endothelial cells treated with SAHA and an AHR inhibitor.
(a) hCMEC/D3 cells (n=3–4) were treated with vehicle (Veh), AHR inhibitor (CH, CH-223191 5μM) and/or 10μM SAHA for 6 h or 12 h. Total RNA was isolated at the end of the treatment and analyzed for mRNA expression of MDR1 and CYP1A1, the positive control, by qPCR. Data were normalized to beta2-microglobulin and presented as mean ± SEM. Data were analyzed by one-way ANOVA compared to the vehicle control (*), and between SAHA and C+S (CH + SAHA) (†) with statistical significance at p < 0.05; (b) hCMEC/D3 cells (n=4) were treated with Veh, CH 5μM and/or 10μM SAHA for 36 h and analyzed for protein expression of acetylated histone H3K9/14 or MDR1 by western blot analysis followed by densitometry to semi-quantify protein levels. Alpha-tubulin (α-tubulin) was used as a loading control. Data are presented as mean ± SEM and analyzed by one-way ANOVA compared to the vehicle control (*), and between SAHA and C+S (†) with statistical significance at p < 0.05
Fig. 7.
Fig. 7.. Relative aryl hydrocarbon receptor binding at different regions of the MDR1/ABCB1 gene promoter in human brain microvascular endothelial cells treated with SAHA.
hCMEC/D3 cells (n=3–10) were treated with vehicle or 10μM SAHA for 24 h and analyzed for relative AHR binding at different regions of the MDR1/ABCB1 gene promoter (a). Data collected from qPCR amplification of ChIP samples were presented as mean ± SEM (b). Data were analyzed by two-tailed Student’s t-test between treatment groups with statistical significance (*) at p < 0.05. The graph titles correspond to the labels in Fig. 7a
Fig. 8.
Fig. 8.. Proposed mechanism of interaction between histone acetylation and AHR signaling in MDR1 regulation at the human blood-brain barrier.
Pharmacological inhibition of HDACs promotes the acetylation of histones which consequently increases the accessibility of the MDR1 promoter to AHR binding and transactivation of the MDR1 gene

Similar articles

Cited by

References

    1. Abbott NJ (2014) Anatomy and Physiology of the Blood-Brain Barriers In: Hammarlund-Udenaes M, de Lange E, Thorne RG (eds) Drug Delivery to the Brain: Physiogial Concepts, Methodologies and Approaches, vol 101 edn. Springer-Verlag; New York, pp xx, 731
    1. Abbott NJ, Patabendige AA, Dolman DE, Yusof SR, Begley DJ (2010) Structure and function of the blood-brain barrier. Neurobiol Dis 37 (1):13–25. doi:10.1016/j.nbd.2009.07.030 - DOI - PubMed
    1. Loscher W, Potschka H (2005) Blood-brain barrier active efflux transporters: ATP-binding cassette gene family. NeuroRx 2 (1):86–98. doi:10.1602/neurorx.2.1.86 - DOI - PMC - PubMed
    1. Nakanishi T, Ross DD (2012) Breast cancer resistance protein (BCRP/ABCG2): its role in multidrug resistance and regulation of its gene expression. Chin J Cancer 31 (2):73–99. doi:10.5732/cjc.011.10320 - DOI - PMC - PubMed
    1. Sadhasivam S, Chidambaran V, Zhang X, Meller J, Esslinger H, Zhang K, Martin LJ, McAuliffe J (2015) Opioid-induced respiratory depression: ABCB1 transporter pharmacogenetics. Pharmacogenomics J 15 (2):119–126. doi:10.1038/tpj.2014.56 - DOI - PubMed

MeSH terms