. 2019 Jun;149(6):729-746.
doi: 10.1111/jnc.14703. Epub 2019 May 8.

Extracellular and intracellular sphingosine-1-phosphate distinctly regulates exocytosis in chromaffin cells

Affiliations

Extracellular and intracellular sphingosine-1-phosphate distinctly regulates exocytosis in chromaffin cells

Zhong-Jiao Jiang et al. J Neurochem. 2019 Jun.

Abstract

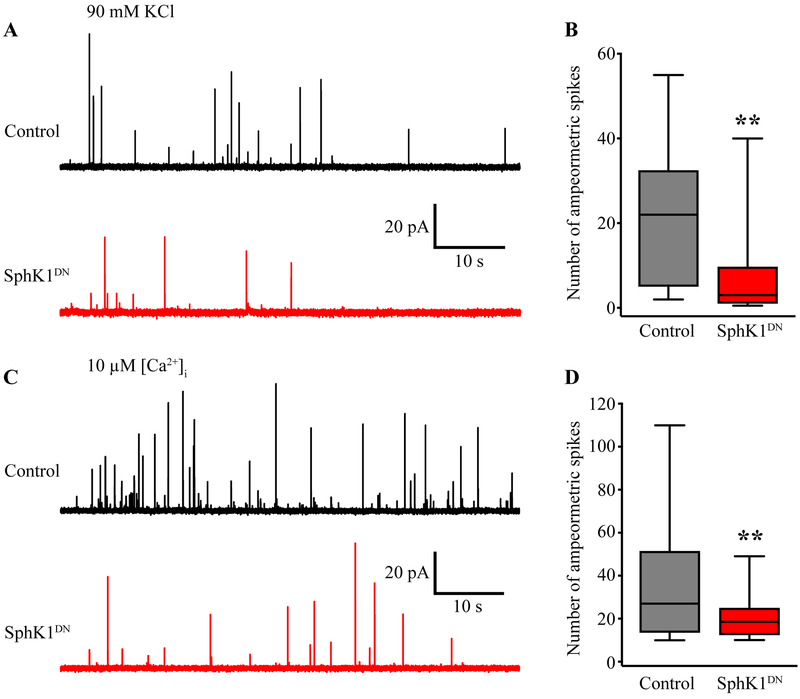
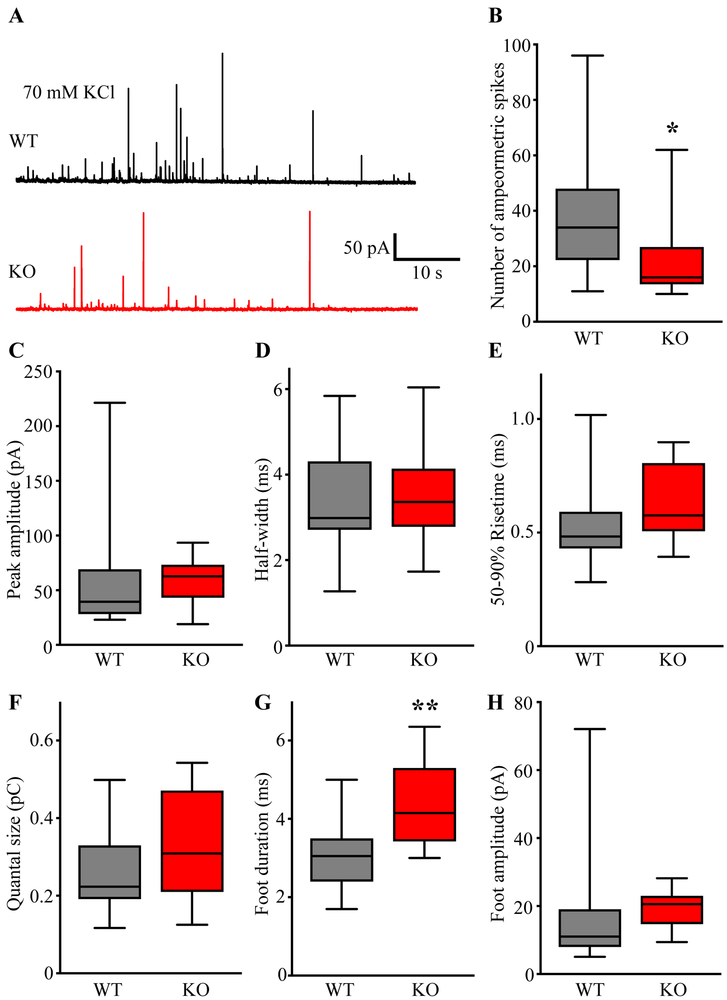
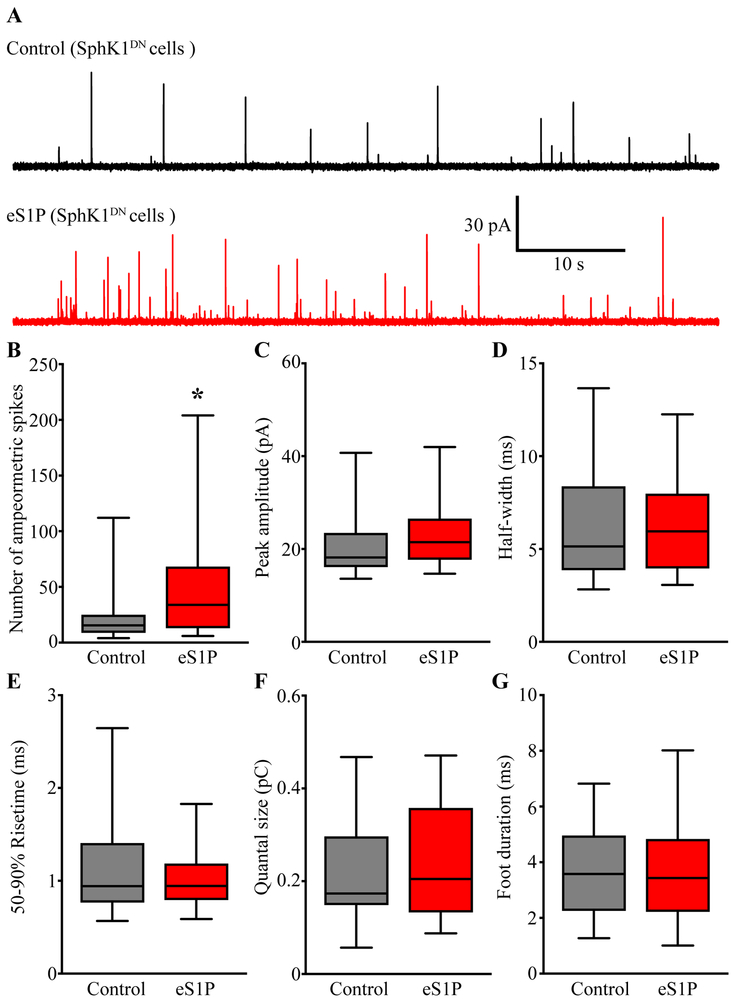
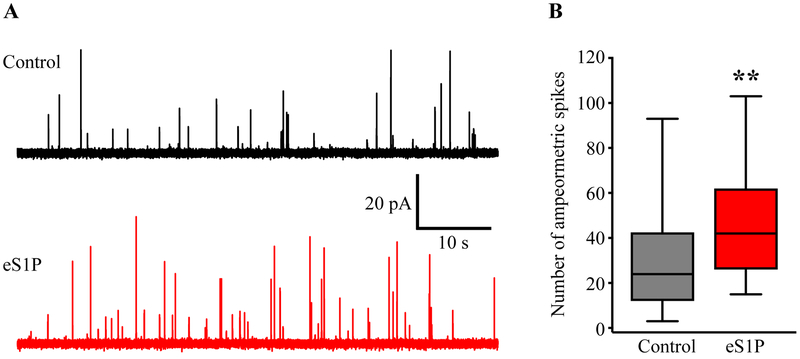
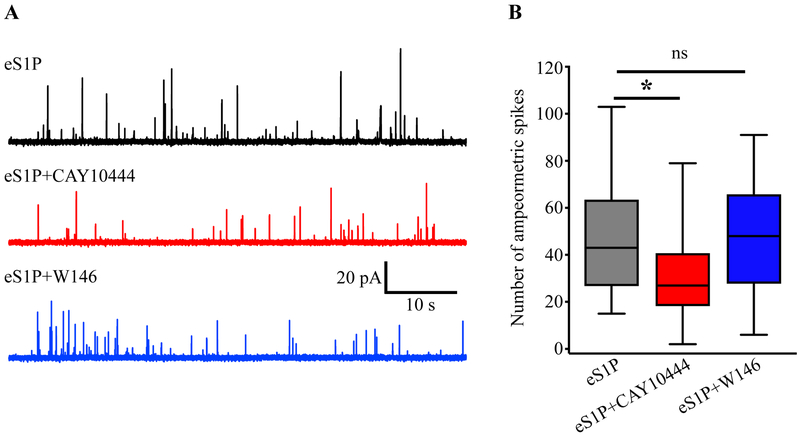
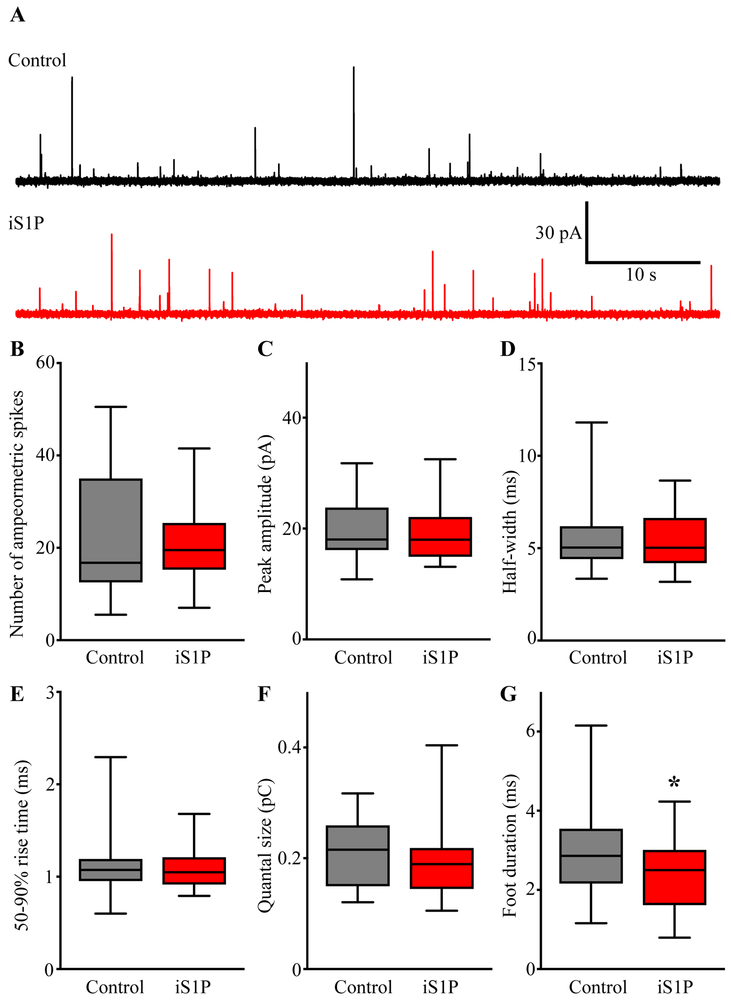
Sphingosine-1-phosphate (S1P) is an essential bioactive sphingosine lipid involved in many neurological disorders. Sphingosine kinase 1 (SphK1), a key enzyme for S1P production, is concentrated in presynaptic terminals. However, the role of S1P/SphK1 signaling in exocytosis remains elusive. By detecting catecholamine release from single vesicles in chromaffin cells, we show that a dominant negative SphK1 (SphK1DN ) reduces the number of amperometric spikes and increases the duration of foot, which reflects release through a fusion pore, implying critical roles for S1P in regulating the rate of exocytosis and fusion pore expansion. Similar phenotypes were observed in chromaffin cells obtained from SphK1 knockout mice compared to those from wild-type mice. In addition, extracellular S1P treatment increased the number of amperometric spikes, and this increase, in turn, was inhibited by a selective S1P3 receptor blocker, suggesting extracellular S1P may regulate the rate of exocytosis via activation of S1P3. Furthermore, intracellular S1P application induced a decrease in foot duration of amperometric spikes in control cells, indicating intracellular S1P may regulate fusion pore expansion during exocytosis. Taken together, our study represents the first demonstration that S1P regulates exocytosis through distinct mechanisms: extracellular S1P may modulate the rate of exocytosis via activation of S1P receptors while intracellular S1P may directly control fusion pore expansion during exocytosis. OPEN SCIENCE BADGES: This article has received a badge for *Open Materials* because it provided all relevant information to reproduce the study in the manuscript. The complete Open Science Disclosure form for this article can be found at the end of the article. More information about the Open Practices badges can be found at https://cos.io/our-services/open-science-badges/.

Keywords: amperometry; chromaffin cell; exocytosis; fusion; sphingosine kinase 1; sphingosine-1-phosphate.


Conflict of interest statement

Conflict of Interest: The authors declare no conflict of interest.

Figures

Fig. 1.
Fig. 1.
SphK1DN reduces the rate of exocytosis in chromaffin cells. A. Representative amperometric traces from control (GFP) and SphK1DN-expressing cells stimulated with 90 mM KCl. B. Quantification shows a reduction in the number of amperometric spikes 1 min after the initiation of stimulation in SphK1DN groups (control: 20.76 ± 3.34, n = 24 cells, SphK1DN: 9.04 ± 2.62, n = 23 cells; unpaired Student’s t-test, t(45) = 2.8052, ** p = 0.0074). C. Representative amperometric traces from control (GFP) and SphK1DN-expressing cells stimulated with 10 µM Ca2+ through a whole-cell patch pipette. D. Quantification shows a reduction in the number of amperometric spikes within the first 1 min after patch rupture in SphK1DN-expressing cells (control: 35.41 ± 4.76, n = 28 cells, SphK1DN: 21.39 ± 2.16, n = 28 cells; unpaired Student’s t-test, t(54) = 2.6895, ** p = 0.0095). Data was collected from 4 independent cultures. Box-and-whisker plots in B & D are displayed with the boxes as the intervals between the 25 and 75 percentiles, the horizontal bars inside the boxes as the medians, and the whiskers as the data ranges.
Fig. 2.
Fig. 2.
SphK1DN slows down fusion pore expansion in chromaffin cells. A. Diagram of the parameters analyzed in amperometric spikes. B-E. There is no change between control (GFP) and SphK1DN cells (control: n=28 cells, SphK1DN: n=28 cells) in a variety of parameters, such as peak amplitude (B) (control: 19.56 ± 1.12, SphK1DN: 19.87 ± 1.69; unpaired Student’s t-test, t(54) = 0.1560, p = 0.8766), half-width (C) (control: 5.11 ± 0.35, SphK1DN: 5.13 ± 0.35; unpaired Student’s t-test, t(54) = 0.0341, p = 0.9729), 50–90% rise time (D) (control: 1.09 ± 0.05, SphK1DN: 1.16 ± 0.08; unpaired Student’s t-test, t(54) = 0.7643, p = 0.4480), and the quantal size (E) (control: 0.164 ± 0.011, SphK1DN: 0.156 ± 0.016; unpaired Student’s t-test, t(54) = 0.4208, p = 0.6756). F. An increase in the foot duration in SphK1DN-expressing cells suggests that SphK1 is critical for expansion of fusion pore during exocytosis (control: 2.81 ± 0.19, SphK1DN: 3.99 ± 0.54; unpaired Student’s t-test, t(54) = 2.0583, * p = 0.0444). Data was collected from 3 independent cultures. Box-and-whisker plots in B-F are displayed with the boxes as the intervals between the 25 and 75 percentiles, the horizontal bars inside the boxes as the medians, and the whiskers as the data ranges.
Fig 3.
Fig 3.
Ablation of Sphk1 reduces the rate of exocytosis and slows fusion pore expansion. A. Representative amperometric traces from wildtype (WT) and SphK1 knockout (KO) chromaffin cells stimulated with 70 mM KCl. B. Quantification shows a reduction in the number of amperometric spikes 1 min after the initiation of stimulation in KO cells (WT: 39.9 ± 6.27, n = 18 cells, SphK1 KO: 22.0 ± 4.04, n = 13 cells; unpaired Student’s t-test, t(29) = 2.4664, * p = 0.0198). C-E. There is no change between WT and KO cells in a variety of parameters, such as peak amplitude (WT: 54.7 ± 10.62, n = 19 cells, SphK1 KO: 59.0 ± 6.06, n = 13 cells; unpaired Student’s t-test, t(30) = 0.3673, p = 0.716) (C), half-width (WT: 3.4 ± 0.29, n = 19 cells, SphK1 KO: 3.5 ± 0.34, n = 13 cells; unpaired Student’s t-test, t(30) = 0.3169, p = 0.7535) (D), 50-90% rise time (WT: 0.55 ± 0.04, n = 19 cells, SphK1 KO: 0.62 ± 0.05, n = 13 cells; unpaired Student’s t-test, t(30) = 1.1359, p = 0.265) (E) and the quantal size (WT: 0.26 ± 0.03, n = 19 cells, SphK1 KO: 0.34 ± 0.04, n = 13 cells; unpaired Student’s t-test, t(30) = 1.6303, p = 0.1135) (F). G-H. An increase in the foot duration (WT: 3.02 ± 0.19, n = 17 cells, SphK1 KO: 4.31 ± 0.36, n = 10 cells; unpaired Student’s t-test, t(25) = 3.095, ** p = 0.0048) (G) but no change in the foot amplitude (WT: 16.05 ± 4.13, n = 16 cells, SphK1 KO: 19.15 ± 1.93, n = 10 cells; unpaired Student’s t-test, t(24) = 0.7017, p = 0.4896) (H) in KO cells suggests that SphK1 is critical for expansion of fusion pore during exocytosis. Data was collected from 3 independent cultures. Box-and-whisker plots in B-H are displayed with the boxes as the intervals between the 25 and 75 percentiles, the horizontal bars inside the boxes as the medians, and the whiskers as the data ranges.
Fig. 4.
Fig. 4.
Extracellular S1P (eS1P) restores defects in the rate of exocytosis but not fusion kinetics induced by SphK1DN in chromaffin cells. A. Representative amperometric traces from SphK1DN-expressing cells treated with vehicle or 100 nM S1P. B. Quantification shows that extracellular S1P application increases the number of amperometric spikes within the first 1 min after patch rupture in SphK1DN-infected cells (SphK1DN: 23.2 ± 4.31, n = 30 cells, SphK1DN+S1P: 49.1 ± 10.1, n = 30 cells; unpaired Student’s t-test, t(58) = 2.3372, * p = 0.0229). C-G. Analysis of the amperometric spikes (SphK1DN: n = 28 cells, SphK1DN+S1P: n = 29 cells) reveals no significant change between these two groups in parameters such as peak amplitude (C) (SphK1DN: 21.09 ± 1.37, SphK1DN+S1P: 23.22 ± 1.37; unpaired Student’s t-test, t(55) = 1.1202, p = 0.2675), half-width (D) (SphK1DN: 6.29 ± 0.62, SphK1DN+S1P: 6.07 ± 0.47; unpaired Student’s t-test, t(55) = 0.2900, p = 0.7729), 50-90% rise time (E) (SphK1DN: 1.09 ± 0.09, SphK1DN+S1P: 1.03 ± 0.07; unpaired Student’s t-test, t(55) = 0.5593, p = 0.5782), the quantal size (F) (SphK1DN: 0.210 ± 0.019, SphK1DN+S1P: 0.238 ± 0.023; unpaired Student’s t-test, t(55) = 0.9716, p = 0.3355), and foot duration (G) (SphK1DN: 3.68 ± 0.31, SphK1DN+S1P: 3.65 ± 0.36; unpaired Student’s t-test, t(54) = 0.0639, p = 0.9493). Data was collected from 3 independent cultures. Box-and-whisker plots in B-G are displayed with the boxes as the intervals between the 25 and 75 percentiles, the horizontal bars inside the boxes as the medians, and the whiskers as the data ranges.
Fig. 5.
Fig. 5.
Extracellular S1P (eS1P) induces an increase in the number of amperometric spikes in control chromaffin cells. A. Representative amperometric traces from control cells treated with vesicle or 100 nM S1P. B. Quantification indicates that eS1P increases the number of amperometric spikes (control: 29.7 ± 3.99, n = 33 cells, S1P: 45.57 ± 4.43, n = 35 cells; unpaired Student’s t-test, t(66) = 2.7042, ** p = 0.0087). The analysis was performed on amperometric spikes within the first 1 min after patch rupture. Data was collected from 4 independent cultures. Box-and-whisker plots in B are displayed with the boxes as the intervals between the 25 and 75 percentiles, the horizontal bars inside the boxes as the medians, and the whiskers as the data ranges.
Fig. 6.
Fig. 6.
S1P3 activation mediates the role of extracellular S1P (eS1P) in controlling the rate of exocytosis. A. Representative amperometric traces from S1P-treated cells pretreated with CAY10444 (10 µM) or W146 (10 µM) for 10 min, same concentration of CAY10444 or W146 is maintained during subsequent S1P treatments and recordings. B. Quantification shows the S1P3 selective blocker CAY10444, but not the S1P1 selective blocker W146 decreases the number of amperometric spikes in cells treated by S1P, indicating S1P3 mediates the enhancing effect of extracellular S1P on the exocytotic rate (S1P: 46.41 ± 4.47, n=34 cells, S1P+CAY10444: 31.44 ± 3.65, n=32 cells, S1P+W146: 46.13 ± 4.21, n=30 cells; one-way ANOVA followed by Tukey’s post hoc test, F(2, 93) = 4.4204, * p = 0.0147, S1P vs. S1P+CAY10444: * p = 0.0263, S1P vs. S1P+W146: p=0.8999). The analysis was performed on amperometric spikes within the first 1 min after patch rupture. ns: non-significant. Data was collected from 3 independent cultures. Box-and-whisker plots in B are displayed with the boxes as the intervals between the 25 and 75 percentiles, the horizontal bars inside the boxes as the medians, and the whiskers as the data ranges.
Fig. 7.
Fig. 7.
Intracellular S1P (iS1P) accelerates the fusion pore expansion in control cells. A. Representative amperometric traces from chromaffin cells stimulated with 10 µM Ca2+ through a whole-cell patch pipette included with or without S1P (100 nM). B. Quantification shows intracellular application of S1P does not influence the number of amperometric spikes per minute (control: 22.3 ± 2.63, n = 28 cells, S1P: 20.7 ± 1.62, n = 30 cells; unpaired Student’s t-test, t(56) = 0.5114, p = 0.6111). Amperometric spikes were analyzed 2 min after patch rupture to allow S1P dialysis into cells. C-F. Analysis of spike kinetics from same groups shows intracellular S1P does not change in a variety of parameters such as peak amplitude (C) (control: 20.21 ± 1.10, S1P: 18.99 ± 0.89; unpaired Student’s t-test, t(56) = 0.8776, p = 0.3839), half-width (D) (control: 5.55 ± 0.39, S1P: 5.57 ± 0.29; unpaired Student’s t-test, t(56) = 0.0384, p = 0.9695), 50-90% rise time (E) (control: 1.12 ± 0.06, S1P: 1.10± 0.04; unpaired Student’s t-test, t(56) = 0.2170, p = 0.8290), the quantal size (F) (control: 0.20 ± 0.012, S1P: 0.19± 0.011; unpaired Student’s t-test, t(56) = 1.004, p = 0.3199). G. Analysis of foot signals shows foot duration is significantly decreased in cells treated with intracellular S1P, suggesting a role of S1P in regulating fusion pore expansion (control: 3.01 ± 0.21, S1P: 2.46 ± 0.16; unpaired Student’s t-test, t(56) = 2.0729, p = 0.0428). Data was collected from 3 independent cultures. Box-and-whisker plots in B-G are displayed with the boxes as the intervals between the 25 and 75 percentiles, the horizontal bars inside the boxes as the medians, and the whiskers as the data ranges.

Similar articles

Cited by

References

    1. Allende ML, Sasaki T, Kawai H et al. (2004) Mice deficient in sphingosine kinase 1 are rendered lymphopenic by FTY720. The Journal of biological chemistry, 279, 52487–52492. - PubMed
    1. Alvarez SE, Milstien S and Spiegel S (2007) Autocrine and paracrine roles of sphingosine-1-phosphate. Trends in endocrinology and metabolism: TEM, 18, 300–307. - PubMed
    1. Ammar MR, Kassas N, Chasserot-Golaz S, Bader MF and Vitale N (2013) Lipids in Regulated Exocytosis: What are They Doing? Front Endocrinol (Lausanne), 4, 125. - PMC - PubMed
    1. Antonucci F, Turola E, Riganti L et al. (2012) Microvesicles released from microglia stimulate synaptic activity via enhanced sphingolipid metabolism. EMBO J, 31, 1231–1240. - PMC - PubMed
    1. Bao H, Goldschen-Ohm M, Jeggle P, Chanda B, Edwardson JM and Chapman ER (2016) Exocytotic fusion pores are composed of both lipids and proteins. Nat Struct Mol Biol, 23, 67–73. - PMC - PubMed

Publication types