Assessing fractional hair cell survival in archival human temporal bones
- PMID: 30963586
- PMCID: PMC6783317
- DOI: 10.1002/lary.27991
Assessing fractional hair cell survival in archival human temporal bones
Abstract
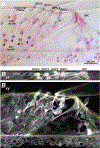
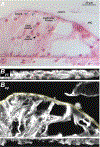
Objectives/hypothesis: Histopathological analysis of hair cell survival in human temporal bone sections has historically been binarized such that each hair cell row is rated as either present or absent, thereby greatly underestimating the amount of hair cell loss. Here, we describe and validate a technique to reliably assess fractional hair cell survival in archival sections stained with hematoxylin and eosin (H&E) using high-resolution light microscopy and optical sectioning.
Study design: Technique validation.
Methods: Hair cell counts in archival temporal bone slide sets were performed by several observers using either differential interference contrast (DIC) or confocal microscopy of the endogenous eosin fluorescence in hair cells. As a further cross-check, additional decelloidinized sections were immunostained with hair cell markers myosin VI and VIIa.
Results: Cuticular plates and stereocilia bundles are routinely resolvable in DIC imaging of archival H&E-stained human material using standard research-grade microscopes, allowing highly accurate counts of fractional hair cell survival that are reproducible across observer and can be verified by confocal microscopy.
Conclusions: Reanalysis of cases from the classic temporal bone literature on presbycusis suggests that, contrary to prior reports, differences in audiometric patterns may be well explained by the patterns of hair cell loss.
Level of evidence: NA Laryngoscope, 130:487-495, 2020.
Keywords: Presbycusis; audiometric pattern; hair cell loss.
© 2019 The American Laryngological, Rhinological and Otological Society, Inc.
Conflict of interest statement
Figures


Similar articles
-
Presbycusis: a human temporal bone study of individuals with flat audiometric patterns of hearing loss using a new method to quantify stria vascularis volume.Laryngoscope. 2003 Oct;113(10):1672-86. doi: 10.1097/00005537-200310000-00006. Laryngoscope. 2003. PMID: 14520091
-
Presbycusis: a human temporal bone study of individuals with downward sloping audiometric patterns of hearing loss and review of the literature.Laryngoscope. 2006 Sep;116(9 Pt 3 Suppl 112):1-12. doi: 10.1097/01.mlg.0000236089.44566.62. Laryngoscope. 2006. PMID: 16946668 Review.
-
Cochlear neuropathy in human presbycusis: Confocal analysis of hidden hearing loss in post-mortem tissue.Hear Res. 2015 Sep;327:78-88. doi: 10.1016/j.heares.2015.04.014. Epub 2015 May 19. Hear Res. 2015. PMID: 26002688 Free PMC article.
-
Selective aspects of human pathology in high-tone hearing loss of the aging inner ear.Hear Res. 2001 Jul;157(1-2):77-86. doi: 10.1016/s0378-5955(01)00279-9. Hear Res. 2001. PMID: 11470187
-
A method for quantitative assessment of vestibular otopathology.Laryngoscope. 1999 Oct;109(10):1560-9. doi: 10.1097/00005537-199910000-00004. Laryngoscope. 1999. PMID: 10522922
Cited by
-
Genetic Hearing Loss Affects Cochlear Processing.Genes (Basel). 2022 Oct 22;13(11):1923. doi: 10.3390/genes13111923. Genes (Basel). 2022. PMID: 36360160 Free PMC article.
-
The effects of mild hypothermia on the electrode insertion trauma in a murine whole organ cochlea culture.Front Neurosci. 2023 Apr 13;17:1112243. doi: 10.3389/fnins.2023.1112243. eCollection 2023. Front Neurosci. 2023. PMID: 37123355 Free PMC article.
-
Delayed hearing loss after cochlear implantation: Re-evaluating the role of hair cell degeneration.Hear Res. 2024 Jun;447:109024. doi: 10.1016/j.heares.2024.109024. Epub 2024 May 3. Hear Res. 2024. PMID: 38735179 Free PMC article.
-
Primary Neural Degeneration in Noise-Exposed Human Cochleas: Correlations with Outer Hair Cell Loss and Word-Discrimination Scores.J Neurosci. 2021 May 19;41(20):4439-4447. doi: 10.1523/JNEUROSCI.3238-20.2021. Epub 2021 Apr 21. J Neurosci. 2021. PMID: 33883202 Free PMC article.
-
Modeling the effects of age and hearing loss on concurrent vowel scores.J Acoust Soc Am. 2021 Nov;150(5):3581. doi: 10.1121/10.0007046. J Acoust Soc Am. 2021. PMID: 34852572 Free PMC article.
References
-
- Merchant SN, Nadol JB. Schuknecht’s Pathology of the Ear, 3rd Edition. Shelton, CT: People’s Medical Publishing House - USA, 2010.
-
- Guild SR. A graphic reconstruction method for the study of the organ of Corti. Anatomical Record 1921; 22:141–157.
-
- Nelson EG, Hinojosa R. Presbycusis: a human temporal bone study of individuals with flat audiometric patterns of hearing loss using a new method to quantify stria vascularis volume. Laryngoscope 2003; 113:1672–1686. - PubMed
-
- Kaya S, Tsuprun V, Hizli O, Paparella MM, Cureoglu S. Quantitative Assessment of Cochlear Histopathologic Findings in Patients With Suppurative Labyrinthitis. JAMA Otolaryngol Head Neck Surg 2016; 142:364–369. - PubMed
Publication types
MeSH terms
Substances
Grants and funding
LinkOut - more resources
Full Text Sources
Research Materials

