. 2019 Feb 27;286(1897):20190049.
doi: 10.1098/rspb.2019.0049.

Annual environmental variation influences host tolerance to parasites

Affiliations

Annual environmental variation influences host tolerance to parasites

Sabrina M McNew et al. Proc Biol Sci. .

Abstract

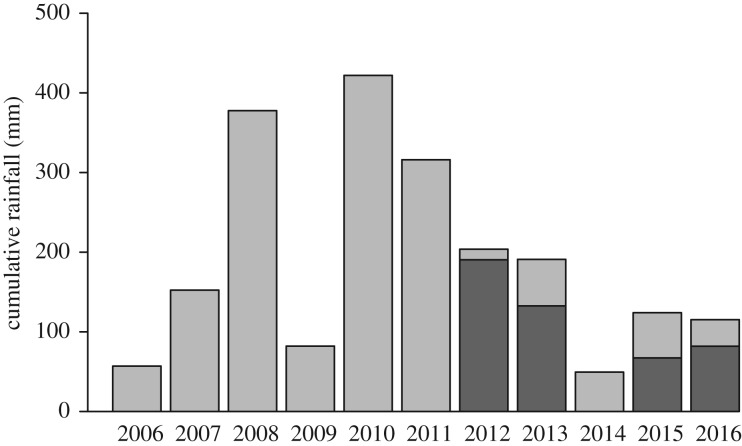
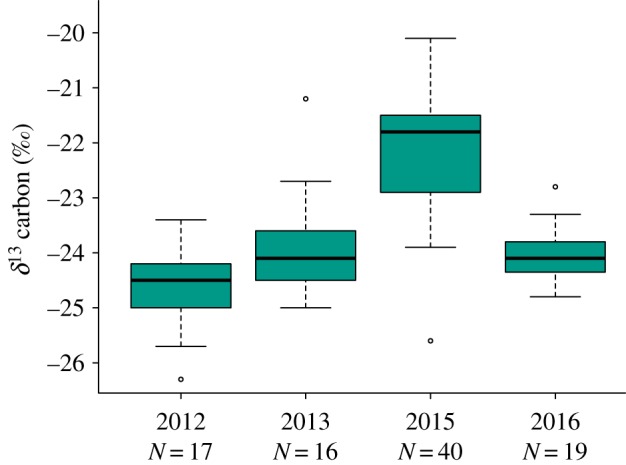
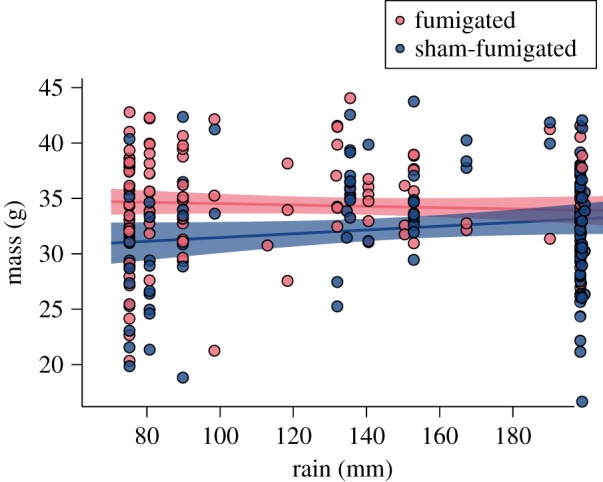
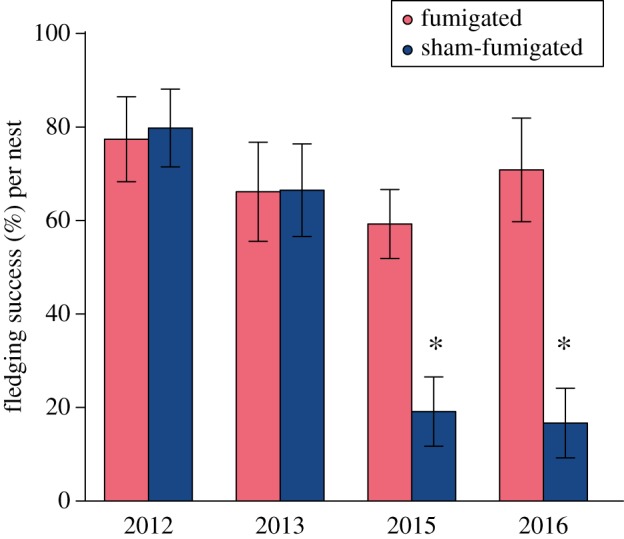
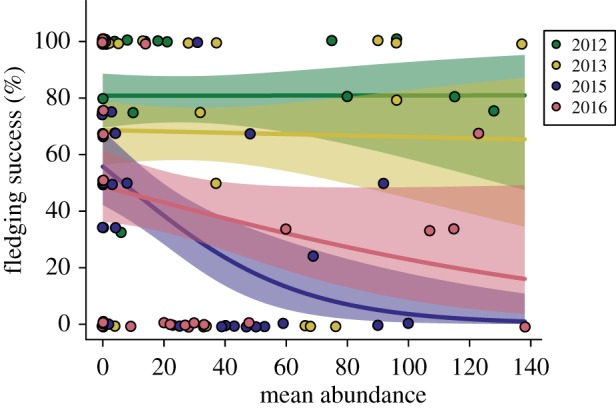
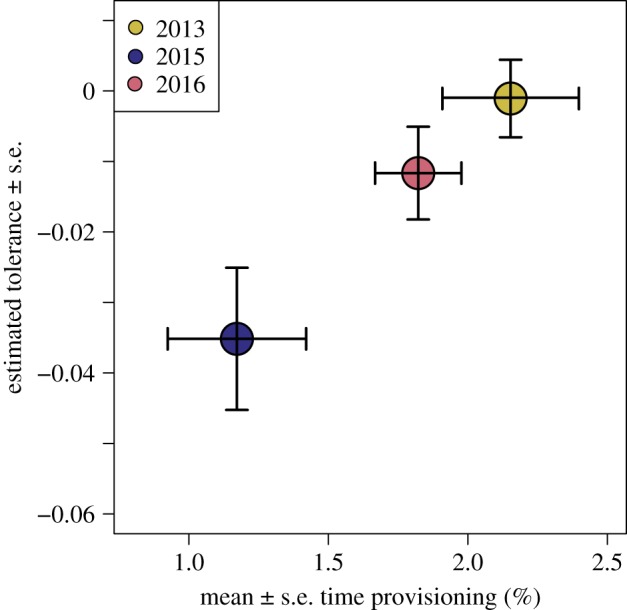
When confronted with a parasite or pathogen, hosts can defend themselves by resisting or tolerating the attack. While resistance can be diminished when resources are limited, it is unclear how robust tolerance is to changes in environmental conditions. Here, we investigate the sensitivity of tolerance in a single host population living in a highly variable environment. We manipulated the abundance of an invasive parasitic fly, Philornis downsi, in nests of Galápagos mockingbirds ( Mimus parvulus) over four field seasons and measured host fitness in response to parasitism. Mockingbird tolerance to P. downsi varied significantly among years and decreased when rainfall was limited. Video observations indicate that parental provisioning of nestlings appears key to tolerance: in drought years, mockingbirds likely do not have sufficient resources to compensate for the effects of P. downsi. These results indicate that host tolerance is a labile trait and suggest that environmental variation plays a major role in mediating the consequences of host-parasite interactions.

Keywords: Galápagos Islands; Mimus parvulus; Philornis downsi; host defence; invasive species.


Conflict of interest statement

We declare we have no competing interests.

Figures

Figure 1.
Figure 1.
Cumulative rainfall immediately before and during the typical mockingbird breeding seasons (December–March) at our field site for 2006–2016. Dark grey bars within each study year (2012, 2013, 2015, and 2016) are median rainfall by the date of hatching for nests in the study.
Figure 2.
Figure 2.
Boxplot showing the δ13 carbon values from nestling blood over the four field seasons. Differences between treatments were not significant and so values were combined. Values from 2015 were higher than other years; no other year by year comparisons were significant. (Online version in colour.)
Figure 3.
Figure 3.
Relationship between rainfall and mass of nestlings at 9–11 days of age. Lines indicate regression lines for fumigated nestlings (no parasites; N = 139) and sham-fumigated nestlings (parasites; N = 120). Shaded regions indicate 95% confidence intervals. Fumigated nestling mass is not significantly associated with rainfall (red line); sham-fumigated nestling mass is positively associated with rainfall (blue line; electronic supplementary material, table S9). (Online version in colour.)
Figure 4.
Figure 4.
Mean (±s.e.) fledging success per nest in fumigated and sham-fumigated nests over the study period. Fledging success of sham-fumigated nests in 2015 and 2016 (asterisks) was significantly lower than all other groups. (Online version in colour.)
Figure 5.
Figure 5.
Relationship between abundance of P. downsi and mockingbird fledging success. Each point represents an individual nest (N = 126). Points have been jittered for clarity. Logistic regression lines and shaded 95% confidence intervals are plotted for each year. Steeper slopes indicate lower tolerance. Fledging success was not significantly associated with abundance in 2012 or 2013. Fledging success was marginally associated with abundance in 2016, and was significantly negatively correlated with abundance in 2015 (electronic supplementary material, table S16). (Online version in colour.)
Figure 6.
Figure 6.
Relationship between mean (±s.e.) time that parents spent provisioning nestlings and tolerance (±s.e.) each year. Provisioning data were not collected in 2012. Annual provisioning rates were based on 15 observation periods in 2013, and 2018 observations in each of 2015 and 2016. Tolerance was calculated from 33 nests in 2013, 34 nests in 2015, and 29 nests in 2016. Tolerance is the slope of the relationship (i.e. GLM estimate) between P. downsi abundance and host fledging success (figure 5). (Online version in colour.)

References

    1. Medzhitov R, Schneider DS, Soares MP. 2012. Disease tolerance as a defense strategy. Science 335, 936–941. (10.1126/science.1214935) - DOI - PMC - PubMed
    1. Kutzer MAM, Armitage SAO. 2016. Maximising fitness in the face of parasites: a review of host tolerance. Zoology 119, 281–289. (10.1016/j.zool.2016.05.011) - DOI - PubMed
    1. Boots M. 2008. fight or learn to live with the consequences? Trends Ecol. Evol. 23, 245–248. (10.1016/j.tree.2008.02.003) - DOI - PubMed
    1. Råberg L, Graham AL, Read AF. 2009. Decomposing health: tolerance and resistance to parasites in animals. Proc. R. Soc. B 364, 37–49. (10.1098/rstb.2008.0184) - DOI - PMC - PubMed
    1. Rauw WM. 2012. Immune response from a resource allocation perspective. Front. Genet. 3, 1–14. (10.3389/fgene.2012.00267) - DOI - PMC - PubMed

Publication types

LinkOut - more resources