. 2019 Feb 27;286(1897):20182733.
doi: 10.1098/rspb.2018.2733.

Survival of retinal ganglion cells after damage to the occipital lobe in humans is activity dependent

Affiliations

Survival of retinal ganglion cells after damage to the occipital lobe in humans is activity dependent

Colleen L Schneider et al. Proc Biol Sci. .

Abstract

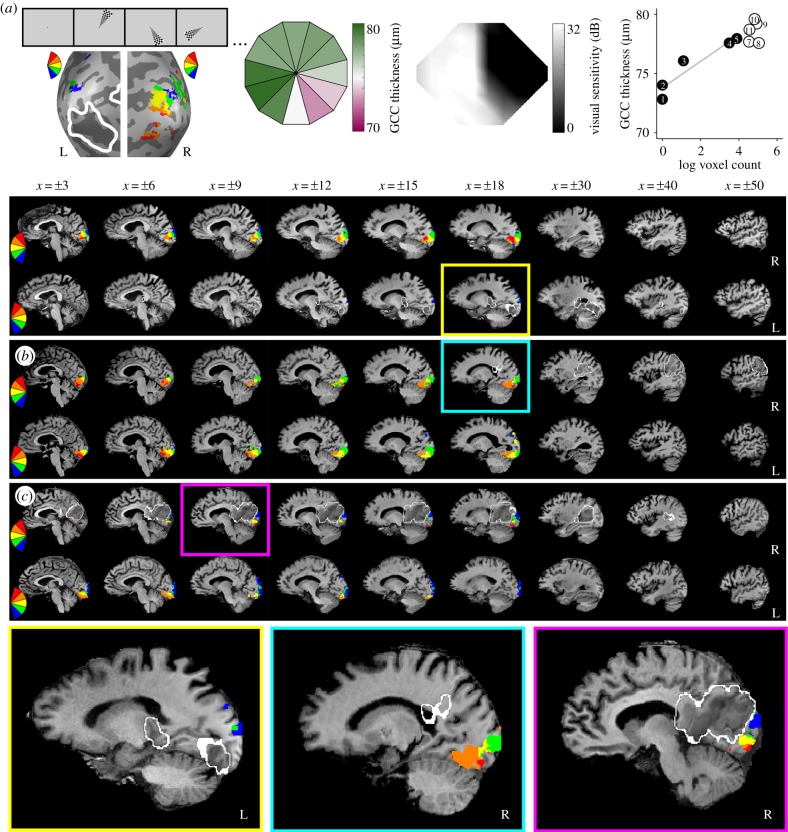
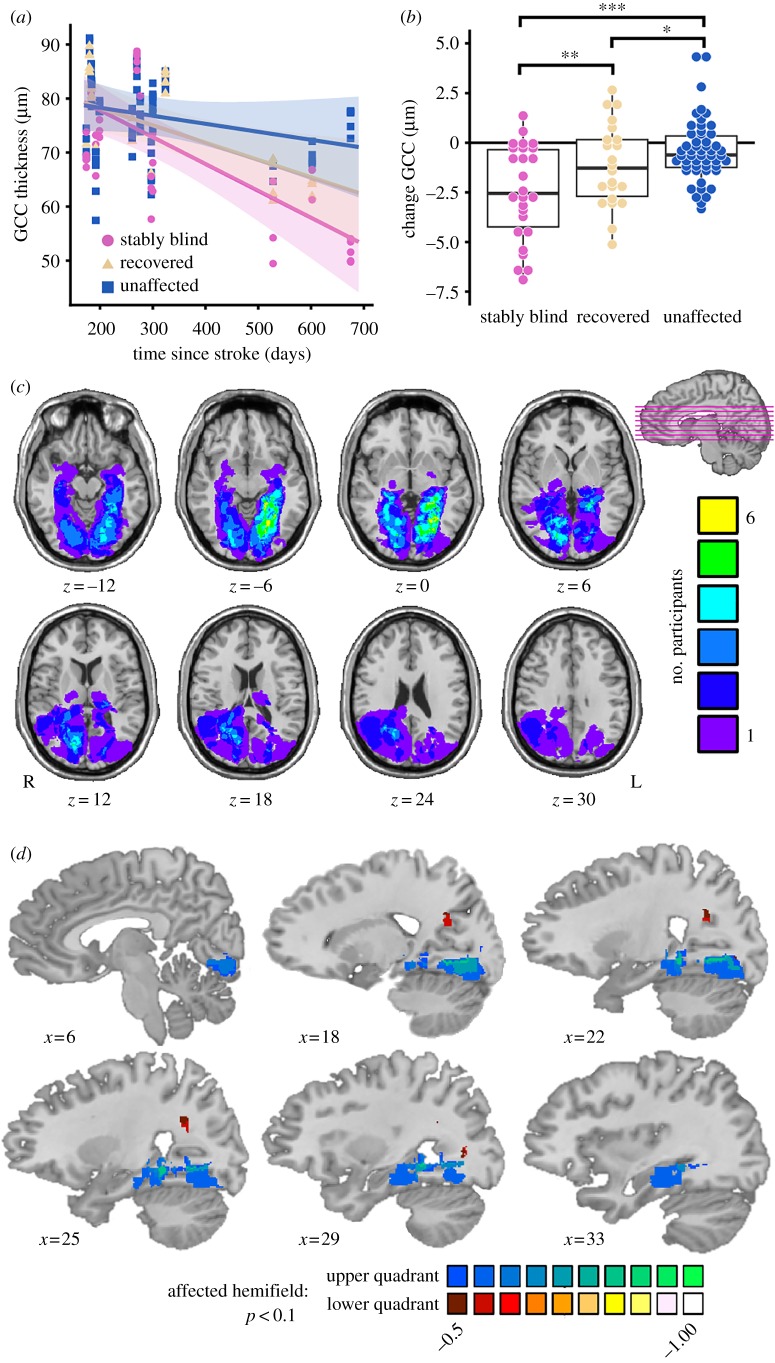
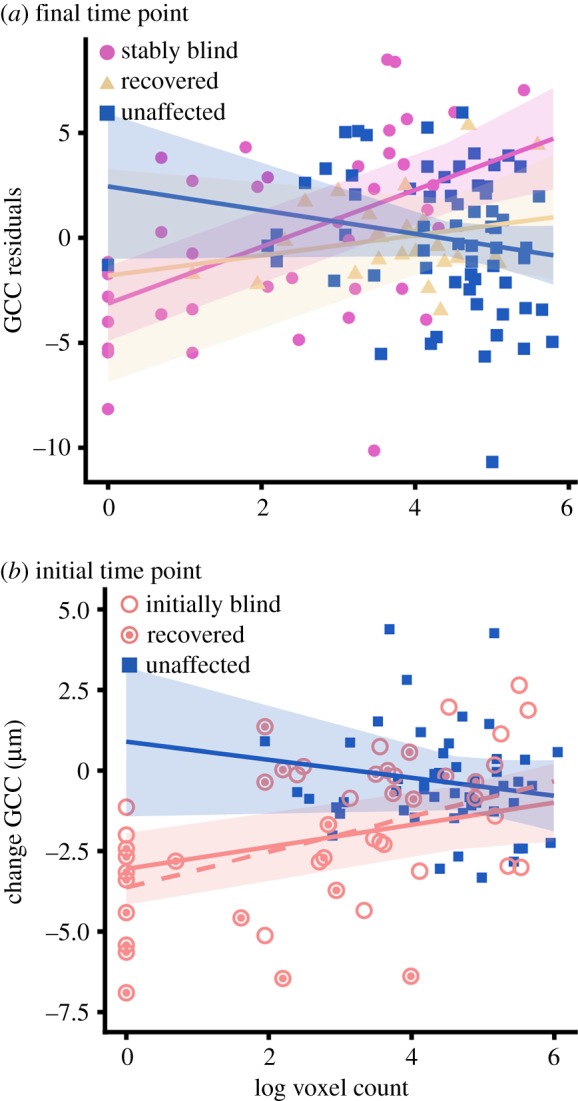
Damage to the optic radiations or primary visual cortex leads to blindness in all or part of the contralesional visual field. Such damage disconnects the retina from its downstream targets and, over time, leads to trans-synaptic retrograde degeneration of retinal ganglion cells. To date, visual ability is the only predictor of retinal ganglion cell degeneration that has been investigated after geniculostriate damage. Given prior findings that some patients have preserved visual cortex activity for stimuli presented in their blind field, we tested whether that activity explains variability in retinal ganglion cell degeneration over and above visual ability. We prospectively studied 15 patients (four females, mean age = 63.7 years) with homonymous visual field defects secondary to stroke, 10 of whom were tested within the first two months after stroke. Each patient completed automated Humphrey visual field testing, retinotopic mapping with functional magnetic resonance imaging, and spectral-domain optical coherence tomography of the macula. There was a positive relation between ganglion cell complex (GCC) thickness in the blind field and early visual cortex activity for stimuli presented in the blind field. Furthermore, residual visual cortex activity for stimuli presented in the blind field soon after the stroke predicted the degree of retinal GCC thinning six months later. These findings indicate that retinal ganglion cell survival after ischaemic damage to the geniculostriate pathway is activity dependent.

Keywords: functional magnetic resonance imaging; homonymous hemianopia; optical coherence tomography; retinal ganglion cells; retinotopic mapping; stroke.


Conflict of interest statement

The authors declare no competing interests.

Figures

Figure 1.
Figure 1.
Overview of key measures. (a) Example measures from participant 5 collected at the final time point. Winner map of fMRI activity to flickering checkerboard wedges (stimulus example shows random order, lesion outlined from clinical T2 FLAIR or diffusion-weighted image *DWI shown in white; left panel), GCC thickness averaged over both eyes (shown in retinal coordinates; left middle panel), visual field cut (black is blind) determined from automated 24–2 Humphrey perimetry collected as standard of care two days post-stroke (right middle panel) and a plot of the relation between GCC thickness and fMRI activity binned by initial blind (black circles, TD ≤ −6 dB) or sighted wedge locations (white circles, TD > −6 dB; right panel). In the plot, GCC thickness values are translated to visual field coordinates (flipped horizontally); numbers correspond to the wedge number by clock hour, grey line is for blind wedges only. Sagittal slices showing the lesion (outlined in white) and a winner map of visual cortex activity, masked by the medial occipital lobe, for representative patients of varying lesion volumes: (a) small (participant 5, final time point), (b) medium (participant 15, initial time point), and (c) large (participant 14, initial time point). See electronic supplementary material, figure S2 for all other participant activation maps.
Figure 2.
Figure 2.
Effect of lesion location, time since stroke, and visual ability on GCC thickness. (a) GCC thickness decreases in the stably blind (pink circle) and recovered (yellow triangle) but not unaffected (blue square) areas of the visual field as a function of time since stroke (n = 15), error is 95% confidence interval. (b) Box plot shows the change in GCC thickness is greatest in stably blind areas of the visual field followed by recovered areas of the visual field (n = 10, *p < 0.05, **p < 0.01, ***p < 0.001). (c) Lesion overlap map of all participants (n = 15) constructed from the acute clinical T2 FLAIR or diffusion-weighted images. (d) Voxel-based lesion-symptom map of the change in GCC thickness (n = 10) in the upper (blues) or lower (reds) quadrant of the affected hemifield (electronic supplementary material). Lesions in the ventral V1 and/or Meyer's loop were associated with greater GCC thinning in the part of the retina that corresponds to the upper visual field; lesions in Baum's loop were associated with greater GCC thinning in the part of the retina that corresponds to the lower visual field (p < 0.1 two-tailed, colour bar is r value for the point-biserial correlation between presence/absence of a lesion and change in GCC thickness).
Figure 3.
Figure 3.
GCC thickness is associated with visual cortex activity. (a) GCC thickness at the final time point, controlling for change in visual ability over time, is related to the number of voxels in which there is stimulus-evoked activity for stably blind areas of the visual field at the final time point (n = 13; pink circle, stably blind; yellow triangle, recovered; blue square, unaffected). (b) The number of voxels that respond to stimulation of the initial blind field (red circle) but not the unaffected areas of the visual field (blue) at the initial time point (less than two months post-stroke) predicts the change in GCC thickness at the final time point (five+ months post-stroke, n = 10). This relation remains when wedge locations that recover vision are removed from the analysis (dashed red line; open red circle, recovered; filled red circle, stably blind). Error is 95% confidence interval. (Online version in colour.)

Similar articles

Cited by

References

    1. Cowey A, Stoerig P, Williams C. 1999. Variance in transneuronal retrograde ganglion cell degeneration in monkeys after removal of striate cortex: effects of size of the cortical lesion. Vision Res. 39, 3642–3652. (10.1016/S0042-6989(99)00097-8) - DOI - PubMed
    1. Cowey A, Alexander I, Stoerig P. 2011. Transneuronal retrograde degeneration of retinal ganglion cells and optic tract in hemianopic monkeys and humans. Brain 134, 2149–2157. (10.1093/brain/awr125) - DOI - PubMed
    1. VanBuren J. 1963. Trans-synaptic retrograde degeneration in the visual system of primates. J. Neurol. Neurosurg. Psychiatry 26, 402–409. (10.1136/jnnp.26.5.402) - DOI - PMC - PubMed
    1. Johnson H, Cowey A. 2000. Transneuronal retrograde degeneration of retinal ganglion cells following restricted lesions of striate cortex in the monkey. Exp. Brain Res. 132, 269–275. (10.1007/s002210000384) - DOI - PubMed
    1. Bridge H, Jindahra P, Barbur J, Plant GT. 2011. Imaging reveals optic tract degeneration in hemianopia. Investig. Ophthalmol. Vis. Sci. 52, 382–388. (10.1167/iovs.10-5708) - DOI - PubMed

Publication types