Autism sensory dysfunction in an evolutionarily conserved system
- PMID: 30963913
- PMCID: PMC6304042
- DOI: 10.1098/rspb.2018.2255
Autism sensory dysfunction in an evolutionarily conserved system
Abstract
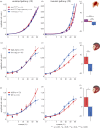
There is increasing evidence for a strong genetic basis for autism, with many genetic models being developed in an attempt to replicate autistic symptoms in animals. However, current animal behaviour paradigms rarely match the social and cognitive behaviours exhibited by autistic individuals. Here, we instead assay another functional domain-sensory processing-known to be affected in autism to test a novel genetic autism model in Drosophila melanogaster. We show similar visual response alterations and a similar development trajectory in Nhe3 mutant flies (total n = 72) and in autistic human participants (total n = 154). We report a dissociation between first- and second-order electrophysiological visual responses to steady-state stimulation in adult mutant fruit flies that is strikingly similar to the response pattern in human adults with ASD as well as that of a large sample of neurotypical individuals with high numbers of autistic traits. We explain this as a genetically driven, selective signalling alteration in transient visual dynamics. In contrast to adults, autistic children show a decrease in the first-order response that is matched by the fruit fly model, suggesting that a compensatory change in processing occurs during development. Our results provide the first animal model of autism comprising a differential developmental phenotype in visual processing.
Keywords: Drosophila; animal model; autism; sensory processing; visual system.
Conflict of interest statement
We declare we have no competing interests.
Figures


Similar articles
-
Sensory perception in autism.Nat Rev Neurosci. 2017 Nov;18(11):671-684. doi: 10.1038/nrn.2017.112. Epub 2017 Sep 29. Nat Rev Neurosci. 2017. PMID: 28951611 Review.
-
The Relationship Between Autistic Traits and Atypical Sensory Functioning in Neurotypical and ASD Adults: A Spectrum Approach.J Autism Dev Disord. 2017 Feb;47(2):316-327. doi: 10.1007/s10803-016-2948-5. J Autism Dev Disord. 2017. PMID: 27848052
-
Autonomic and Electrophysiological Evidence for Reduced Auditory Habituation in Autism.J Autism Dev Disord. 2021 Jul;51(7):2218-2228. doi: 10.1007/s10803-020-04636-8. J Autism Dev Disord. 2021. PMID: 32926307
-
Brief Report: Early VEPs to Pattern-Reversal in Adolescents and Adults with Autism.J Autism Dev Disord. 2016 Oct;46(10):3377-86. doi: 10.1007/s10803-016-2880-8. J Autism Dev Disord. 2016. PMID: 27475419
-
Meta-analytic evidence of differential prefrontal and early sensory cortex activity during non-social sensory perception in autism.Neurosci Biobehav Rev. 2021 Aug;127:146-157. doi: 10.1016/j.neubiorev.2021.04.014. Epub 2021 Apr 19. Neurosci Biobehav Rev. 2021. PMID: 33887326 Review.
Cited by
-
Steady-state visual evoked potentials in children with neurofibromatosis type 1: associations with behavioral rating scales and impact of psychostimulant medication.J Neurodev Disord. 2022 Jul 22;14(1):42. doi: 10.1186/s11689-022-09452-y. J Neurodev Disord. 2022. PMID: 35869419 Free PMC article.
-
A case-control study of visual, auditory and audio-visual sensory interactions in children with autism spectrum disorder.J Vis. 2021 Apr 1;21(4):5. doi: 10.1167/jov.21.4.5. J Vis. 2021. PMID: 33830169 Free PMC article.
-
Natural history of social and sexual behavior in fruit flies.Sci Rep. 2020 Dec 14;10(1):21932. doi: 10.1038/s41598-020-79075-7. Sci Rep. 2020. PMID: 33318613 Free PMC article.
-
Power contours: Optimising sample size and precision in experimental psychology and human neuroscience.Psychol Methods. 2021 Jun;26(3):295-314. doi: 10.1037/met0000337. Epub 2020 Jul 16. Psychol Methods. 2021. PMID: 32673043 Free PMC article.
-
Gene editing in monogenic autism spectrum disorder: animal models and gene therapies.Front Mol Neurosci. 2022 Dec 14;15:1043018. doi: 10.3389/fnmol.2022.1043018. eCollection 2022. Front Mol Neurosci. 2022. PMID: 36590912 Free PMC article. Review.
References
MeSH terms
Associated data
Grants and funding
LinkOut - more resources
Full Text Sources
Molecular Biology Databases

