

Electroporation of Ishikawa cells: analysis by flow cytometry
- PMID: 30964039
- PMCID: PMC8676626
- DOI: 10.1049/iet-nbt.2018.5194
Electroporation of Ishikawa cells: analysis by flow cytometry
Abstract
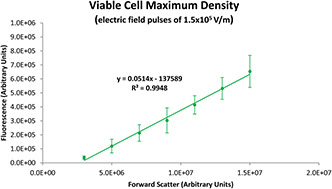
Electroporation facilitates loading of cells with molecules and substances that are normally membrane impermeable. Flow cytometry is used in this study to examine the effects of the application of electroporation-level monopolar electric field pulses of varying electrical field strength on Ishikawa endometrial adenocarcinoma cells. Analysis of the fluorescence versus forward scatter plots corroborates the well-recognised threshold and cell size dependence characteristics of electroporation, but also shows the progression of cell lysis and generation of particulate material. Two 500 µs monopolar rectangular pulses ranging from 1.0 × 10⁵ to 2.5 × 10⁵ V/m were used to electroporate the cells. Electroporation yields (fraction of viable cells exhibiting significant propidium iodide uptake) ranged from 0 to 97%, with viability ranging between 78 and 34% over the electric field strength range tested. The higher electric field strength pulses not only reduced cell viability, but also generated a substantial amount of sub-cellular sized particulate material indicating cells have been physically disrupted enough to create these particles.
Figures


Similar articles
-
Calcein Release from Cells In Vitro via Reversible and Irreversible Electroporation.J Membr Biol. 2018 Feb;251(1):119-130. doi: 10.1007/s00232-017-0005-8. Epub 2017 Nov 15. J Membr Biol. 2018. PMID: 29143077
-
Transfection of HeLa-cells with pEGFP plasmid by impedance power-assisted electroporation.Biotechnol Bioeng. 2005 Nov 5;92(3):267-76. doi: 10.1002/bit.20426. Biotechnol Bioeng. 2005. PMID: 16161165
-
Detection of intracellular biomarkers in viable cells using millisecond pulsed electric fields.Exp Cell Res. 2020 Apr 1;389(1):111877. doi: 10.1016/j.yexcr.2020.111877. Epub 2020 Jan 25. Exp Cell Res. 2020. PMID: 31991124
-
Avoiding the side effects of electric current pulse application to electroporated cells in disposable small volume cuvettes assures good cell survival.Cell Mol Biol Lett. 2017 Jan 13;22:1. doi: 10.1186/s11658-016-0030-0. eCollection 2017. Cell Mol Biol Lett. 2017. PMID: 28536632 Free PMC article.
-
Electric field-induced effects on neuronal cell biology accompanying dielectrophoretic trapping.Adv Anat Embryol Cell Biol. 2003;173:III-IX, 1-77. doi: 10.1007/978-3-642-55469-8. Adv Anat Embryol Cell Biol. 2003. PMID: 12901336 Review.
Cited by
-
Membrane disruption of Fusarium oxysporum f. sp. niveum induced by myriocin from Bacillus amyloliquefaciens LZN01.Microb Biotechnol. 2021 Mar;14(2):517-534. doi: 10.1111/1751-7915.13659. Epub 2020 Sep 20. Microb Biotechnol. 2021. PMID: 32954686 Free PMC article.
References
-
- Kandušer M. Miklavčič D.: ‘Electroporation in ‘biological cell and tissue: an overview’, in Vorobiev E. Lebovka N. (Eds.): ‘Electrotechnologies for extraction from food plants and biomaterials’ (Springer Science + Business Media, LLC, New York, USA, 2008), pp. 1 –37
-
- Weaver J. Chizmadzhev Y.: ‘Electroporation’, in Barnes F. Greenebaum B. (Eds.): ‘Biological and medical aspects of electromagnetic fields’ (CRC Press, New York, USA, 2006), pp. 293 –332
-
- Ho S. Mittal G.: ‘Electroporation of cell membranes: a review’, Crit. Rev. Biotechnol., 1996, 16, (4), pp. 349 –362 - PubMed
-
- Kotnik T. Pucihar G. Reberšek M. et al.: ‘Role of pulse shape in cell membrane electropermeabilization’, BBA – Biomembranes, 2003, 1614, (2), pp. 193 –200 - PubMed
MeSH terms
LinkOut - more resources
Full Text Sources
