. 2019 Jun 21;125(1):14-25.
doi: 10.1161/CIRCRESAHA.118.314223. Epub 2019 Apr 9.

Transient Introduction of miR-294 in the Heart Promotes Cardiomyocyte Cell Cycle Reentry After Injury

Affiliations

Transient Introduction of miR-294 in the Heart Promotes Cardiomyocyte Cell Cycle Reentry After Injury

Austin Borden et al. Circ Res. .

Abstract

Rationale: Embryonic heart is characterized of rapidly dividing cardiomyocytes required to build a working myocardium. Cardiomyocytes retain some proliferative capacity in the neonates but lose it in adulthood. Consequently, a number of signaling hubs including microRNAs are altered during cardiac development that adversely impacts regenerative potential of cardiac tissue. Embryonic stem cell cycle miRs are a class of microRNAs exclusively expressed during developmental stages; however, their effect on cardiomyocyte proliferation and heart function in adult myocardium has not been studied previously.

Objective: To determine whether transient reintroduction of embryonic stem cell cycle miR-294 promotes cardiomyocyte cell cycle reentry enhancing cardiac repair after myocardial injury.

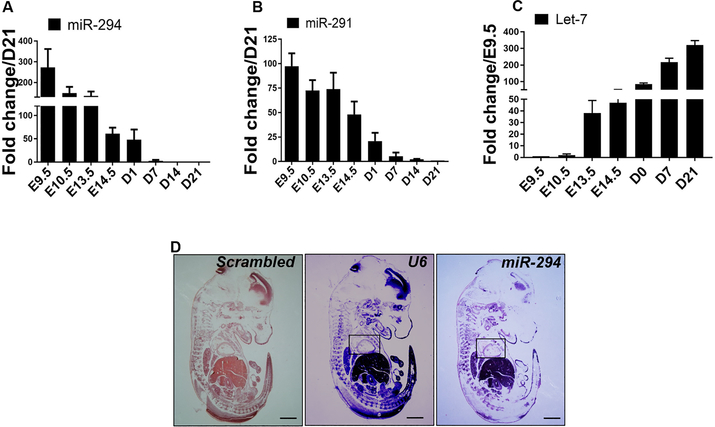
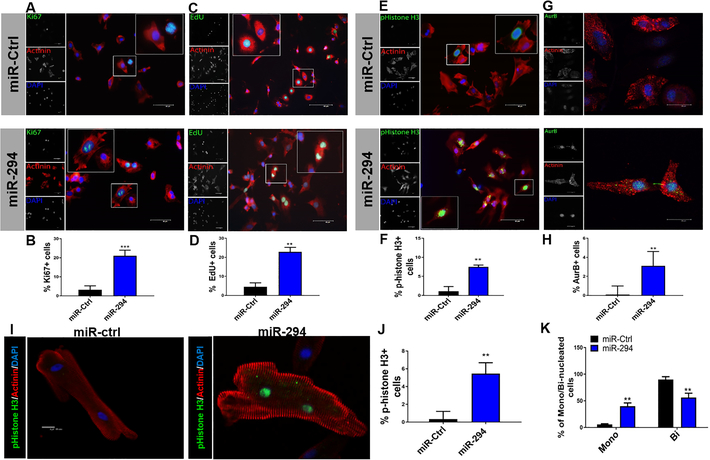
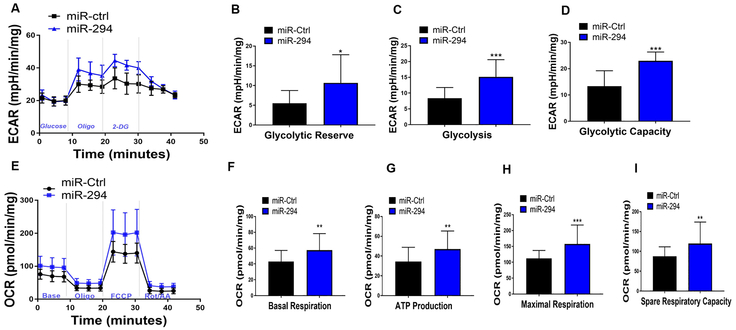
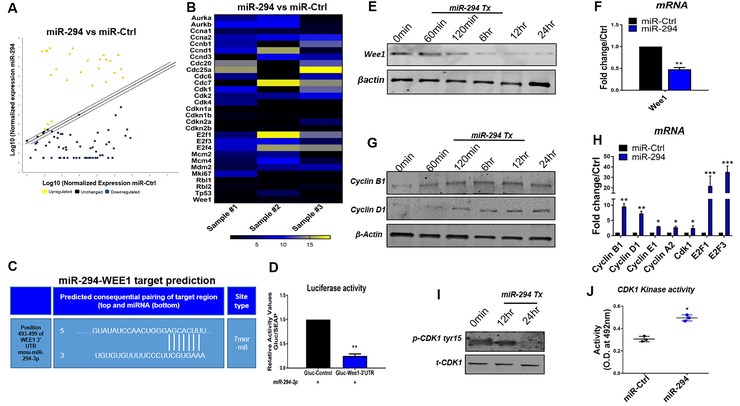
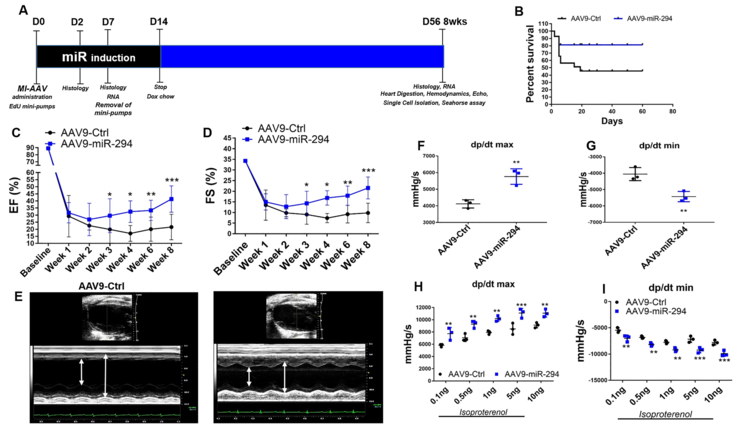
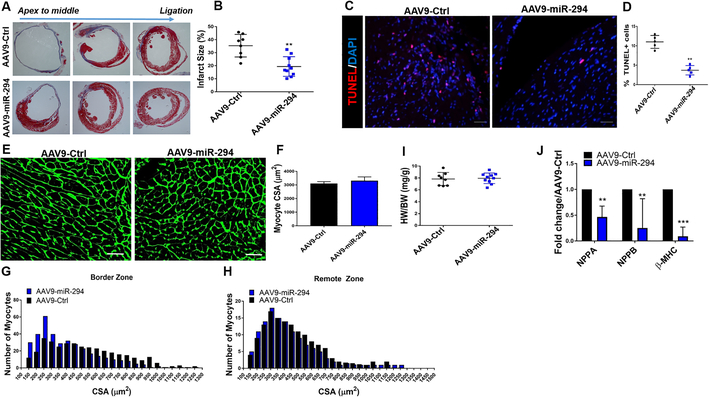
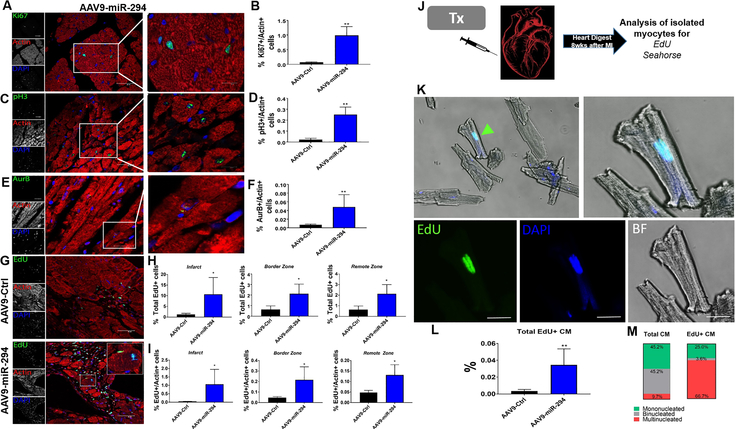
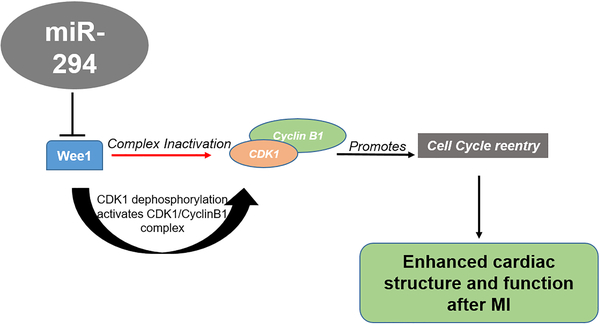
Methods and results: miR-294 is expressed in the heart during development, prenatal stages, lost in the neonate, and adult heart confirmed by qRT-PCR and in situ hybridization. Neonatal ventricular myocytes treated with miR-294 showed elevated expression of Ki67, p-histone H3, and Aurora B confirmed by immunocytochemistry compared with control cells. miR-294 enhanced oxidative phosphorylation and glycolysis in Neonatal ventricular myocytes measured by seahorse assay. Mechanistically, miR-294 represses Wee1 leading to increased activity of the cyclin B1/CDK1 complex confirmed by qRT-PCR and immunoblot analysis. Next, a doxycycline-inducible AAV9-miR-294 vector was delivered to mice for activating miR-294 in myocytes for 14 days continuously after myocardial infarction. miR-294-treated mice significantly improved left ventricular functions together with decreased infarct size and apoptosis 8 weeks after MI. Myocyte cell cycle reentry increased in miR-294 hearts analyzed by Ki67, pH3, and AurB (Aurora B kinase) expression parallel to increased small myocyte number in the heart. Isolated adult myocytes from miR-294 hearts showed increased 5-ethynyl-2'-deoxyuridine+ cells and upregulation of cell cycle markers and miR-294 targets 8 weeks after MI.

Conclusions: Ectopic transient expression of miR-294 recapitulates developmental signaling and phenotype in cardiomyocytes promoting cell cycle reentry that leads to augmented cardiac function in mice after myocardial infarction.

Keywords: cell cycle; embryonic stem cells; microRNAs; myocardial infarction; myocardium.


Figures

Figure 1:
Figure 1:. miR-294 expression in the heart during embryonic and adult cardiac development.
A) Increased expression of miR-294 in the embryonic heart from E9.5 – E14.5 that progressively declines with birth (D1) and postnatal development (D7-D21) (n=3). B) Other miR-290 family members such as miR-291 are also expressed during embryonic heart development albeit at a lower level and decreasing after birth (n=3). C) Let-7 expression is low during E9.5 and 10.5 but starts to increase after that with maximum expression in the adult heart (D21) (n=3). D) miR-294 expression validated in a E14.5 whole embryo including embryonic heart (inset) by in situ hybridization. Scale bar = 100μm.
Figure 2:
Figure 2:. miR-294 promotes cell cycle progression in cardiomyocytes.
A) Increased expression of Ki67+/actinin+ cells was observed in NRVMs treated with miR-294–3p mimic compared to control mimic after 24hrs with quantification in (B) (n=5). Ki67 (green), α-actinin (red) and nuclei (blue). Scale bar = 40μm. C-D) NRVMs were labeled with EdU (G1/S transition) followed by miR-294 mimic or control treatment. EdU detection 24 hrs later showed increased % of EdU+/actinin+ cells in miR-294–3p group compared to control mimic. EdU (green), α-actinin (red) and nuclei (blue) (n=5). Scale bar = 40μm. E-F) Analysis of M-phase marker p-histone H3 showed increased %expression in miR-294 treated group compared to control 24hrs treatment. p-histone 3 (green), α-actinin (red) and nuclei (blue) (n=5). Scale bar = 40μm. Insets show higher magnification. G) Expression of aurora B in miR-294 treated NRVMs shows a late telophase NRVM stained for aurora B in the cytoplasmic body, (H) Significant increase in miR-294 group compared to control after 24hrs (n=5). Aurora B (green), α-actinin (red) and nuclei (blue). Scale bar = 20μm. I-J) Adult feline cardiomyocytes treated with miR-294 mimic show increased expression of p-histone H3 24hrs treatment. p-histone H3 (green), α-actinin (red) and nuclei (blue) (n=4). Scale bar = 40μm. K) miR-294 treatment of adult cardiomyocytes leads to significant % increase in mononucleated cells and a corresponding % decrease in binucleated myocytes (n=3). miR-Ctrl vs. miR-294 *p < 0.05, **p < 0.01, ***p < 0.001, data was assessed using unpaired student’s t test.
Figure 3:
Figure 3:. miR-294 increases NRVM bioenergetics.
A) Analysis of glycolysis, showed increased extra-cellular acidification rate (ECAR) including significant upregulation of glycolytic capacity (B), glycolysis (C) and glycolytic reserve (D) in NRVMs treated with miR-294 24hrs after treatment. E) miR-294 treatment significantly increased oxygen consumption rate (OCR) including basal respiration (F), ATP production (G), maximal respiration (H) and spare respiratory capacity (I) as measured by mito stress test using XF seahorse analyzer. Data for OCR and ECAR was normalized to protein content. miR-ctrl; n=30 and miR-294; n=32/ three independent experiments. miR-Ctrl vs. miR-294 *p < 0.05, **p < 0.01, ***p < 0.001, data was assessed using non-parametric Mann-Whitney test.
Figure 4:
Figure 4:. Analysis of molecular signaling in miR-294 treated NRVMs.
A) Cell cycle array analysis of NRVMs with miR-294–3p mimic or control treatment from 3 independent experiments (n=3). B) Heat map representation of miR-294 fold change over miR-Ctrl. C) Target prediction analysis for miR-294 putative sites on 3-UTR of target genes, identified a 7mer-8m target site in 3-UTR of Wee1 (position 493–499). D) Dual luciferase reporter activity assay for validation of miR-294 targeting of 3UTR-Wee1 in the presence of miR-294 mimic indicates reduced luciferase activity in NRVMs transfected with plasmid carrying 3-UTR-Wee1 (n=3). E) Immunoblot analysis show reduced Wee1 expression in NRVMs after treatment with miR-294 mimic together with mRNA expression in (F) (n=3). G) Elevated proteins levels for cyclin B1 and D1 in miR-294 treated NRVMs (n=3). H) miR-294 treatment of NRVMs shows increased mRNA expression of Cyclin B1,D1, E1, A2, CDK1, E2F1 and E2F3 compared to control cells (n=3). I) Decreased phosphorylation of CDK1tyr15 to total CDK1 ratio (n=3). (J) Elevated CDK1 kinase activity in NRVMs treated with miR-294 compared to control (n=3). miR-Ctrl vs. miR-294 *p < 0.05, **p < 0.01, ***p < 0.001, data was assessed using unpaired student’s t test.
Figure 5:
Figure 5:. AAV9-miR-294 administration augments cardiac function after myocardial infarction in mice.
A) Schematic illustration of experimental design. Animals were divided into two groups and administered AAV9-GFP (n=20) and AAV9-miR-294 (n=20) two weeks prior to myocardial infarction surgery. At the day of surgery (D0) mice were subjected to LAD ligation followed by administration of doxycycline chow to induce miR-294 expression that was removed at day14 and EdU mini-pump implantation removed at D7. Hearts were harvested at D2 and D7 for histology and RNA analysis. Heart were analyzed for echos/hemodynamic measurements, histology and RNA analysis at terminal time point was 8 weeks or D56 after MI. B) Kaplan-Meir survival curve analysis shows increased %survival in AAV9-miR-294 group compared to AAV9-GFP. C) Increased ejection fraction and fractional shortening (D) in AAV9-miR-294 (n=10) administered hearts compared to AAV9-GFP (n=8) animals at 8 weeks after MI. E) Increased wall contractility in AAV9-miR-294 animals compared to controls. Hemodynamic measurements show increased dp/dtmax and reduced dp/dtmin under baseline (F-G) and stimulated (H-I) conditions 8 weeks after MI (n=3). AAV9-Ctrl vs. AAV9-miR-294 *p < 0.05, **p < 0.01, ***p < 0.001, data in panels C,D, were assessed using one-way analysis of variance H and I was assessed using two-way ANOVA with bonferroni post-hoc test while panels F and G were assessed using unpaired student’s t test.
Figure 6:
Figure 6:. Infarct size, apoptosis and myocyte size analysis.
A) Reduced infarct size in AAV9-miR-294 (n=10) administered animals 8 weeks after MI compared to control animals (n=8) as measured by masson’s trichrome staining. Quantification of infarct size in (B). Decreased TUNEL+ cells in the heart treated with AAV9-miR-294 2days after MI compared to AAV9-Ctrl. TUNEL (red), nuclei (blue), scale bar = 40μm. Corresponding quantification in D. E-F) Analysis of myocyte cross-sectional area indicates no significant difference between AAV9-miR-294 (n=10) and AAV9-Ctrl (n=8) animals as determined by wheat germ agglutinin (WGA) staining (green). Scale bar = 40μm. G-H) Size distribution analysis indicated higher number of small sized myocytes in Border zone and remote area of AAV9-miR-294 (n=10) hearts compared to control (n=8) 8 weeks after myocardial infarction. I) HW/BW ratio was not significantly increased in AAV9-miR-294 (n=10) hearts compared to control (n=8) at 8 weeks. J) mRNA expression for markers of hypertrophy was significantly downregulated in AAV9-miR-294 treated (n=3) hearts compared to control (n=3). AAV9-Ctrl vs. AAV9-miR-294 *p < 0.05, **p < 0.01, ***p < 0.001, data was assessed using unpaired student’s t test.
Figure 7:
Figure 7:. AAV9-miR-294 enhances cardiomyocyte cell cycle in vivo after myocardial injury.
A) Histological analysis of heart sections reveals increased Ki67+/actin+ cells 8 weeks after MI in AAV9-miR-294 group compared to control. Ki67 (green), Actin (red) and nuclei (blue), scale bar = 40μm. Insets represent higher magnification at 20μm. Quantification in (B) (n=5). C) Increased p-histone 3/Actin+ small myocytes in AAV9-miR-294 hearts compared to controls. Inset shows small pH3 myocytes in the border zone area (scale bar = 20μm). p-histone H3 (green), actin (red), nuclei (blue). Quantification in (D) (n=5). E) Analysis of cytokinesis marker auroraB shows increased aurB+/actin+ cells in AAV9-miR-294 hearts compared to controls (n=5) (Scale bar = 40μm). Inset shows a AurB+ myocyte in the border zone area (scale bar = 20μm). AuroraB (green), actin (red) and nuclei (blue). Quantification in (F). G-H) EdU detection of the hearts at 8 weeks showed high number of EdU+ cells in infarct, border zone and remote zone in AAV9-miR-294 group compared to control with significantly higher number of EdU+ myocytes respectively (I) (n=5). EdU (green), actin (red), nuclei (blue), scale bar = 40μm. J) Schematic representation of single myocyte isolation from both AAV9-GFP and AAV9-miR-294 hearts followed by EdU detection and seahorse assays on the isolated myocytes 8 weeks after MI (n=3). K) AAV9-miR-294 hearts showed significantly higher number of EdU labeled adult myocytes compared to control hearts. EdU (green), nuclei (blue) bright field (BF). Inset shows an EdU+ isolated adult myocyte from an AAV9-miR-294 heart. Quantification in (L) (n=3). M) Distribution of EdU+ myocytes in the AAV9-miR-294 hearts showed higher % of mononucleated and tri-nucleated EdU+ myocytes. AAV9-Ctrl vs. AAV9-miR-294 *p < 0.05, **p < 0.01, ***p < 0.001, data was assessed using unpaired student’s t test
Figure 8:
Figure 8:. Schematic representation of the working hypothesis.
Wee1 inhibits proliferation (red arrow) by inactivating CDK1/CyclinB1 complex. microRNA-294 delivery to the infarcted heart represses Wee1 activates CDK1/Cyclin B1 complex (Black arrows) through dephosphorylation of CDK1 that promotes cell cycle reentry together with a proliferative phenotype that includes high energy generation and survival ultimately augmenting cardiomyocyte replenishment in the heart after myocardial infarction.

Comment in

  • Embryonic miRs to the Rescue.
    Hoffman JR, Davis ME. Hoffman JR, et al. Circ Res. 2019 Jun 21;125(1):26-28. doi: 10.1161/CIRCRESAHA.119.315284. Epub 2019 Jun 20. Circ Res. 2019. PMID: 31219747 No abstract available.

References

    1. de Carvalho A, Bassaneze V, Forni MF, Keusseyan AA, Kowaltowski AJ and Krieger JE. Early Postnatal Cardiomyocyte Proliferation Requires High Oxidative Energy Metabolism. Sci Rep. 2017;7:15434. - PMC - PubMed
    1. Mollova M, Bersell K, Walsh S, Savla J, Das LT, Park SY, Silberstein LE, Dos Remedios CG, Graham D, Colan S and Kuhn B. Cardiomyocyte proliferation contributes to heart growth in young humans. Proc Natl Acad Sci U S A. 2013;110:1446–51. - PMC - PubMed
    1. Yutzey KE. Cardiomyocyte Proliferation: Teaching an Old Dogma New Tricks. Circ Res. 2017;120:627–629. - PMC - PubMed
    1. Porrello ER, Mahmoud AI, Simpson E, Hill JA, Richardson JA, Olson EN and Sadek HA. Transient regenerative potential of the neonatal mouse heart. Science. 2011;331:1078–80. - PMC - PubMed
    1. Chen JF, Murchison EP, Tang R, Callis TE, Tatsuguchi M, Deng Z, Rojas M, Hammond SM, Schneider MD, Selzman CH, Meissner G, Patterson C, Hannon GJ and Wang DZ. Targeted deletion of Dicer in the heart leads to dilated cardiomyopathy and heart failure. Proc Natl Acad Sci U S A. 2008;105:2111–6. - PMC - PubMed

Publication types