. 2019 Jul;33(7):8363-8374.
doi: 10.1096/fj.201802009RR. Epub 2019 Apr 9.

MCPH1 is essential for cellular adaptation to the G2-phase decatenation checkpoint

Affiliations

MCPH1 is essential for cellular adaptation to the G2-phase decatenation checkpoint

María Arroyo et al. FASEB J. 2019 Jul.

Abstract

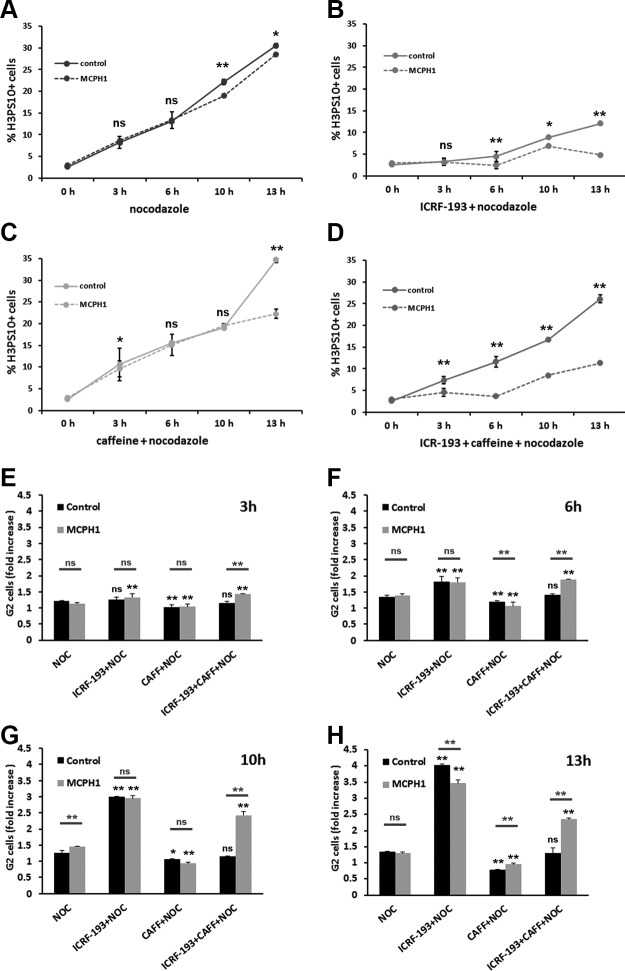
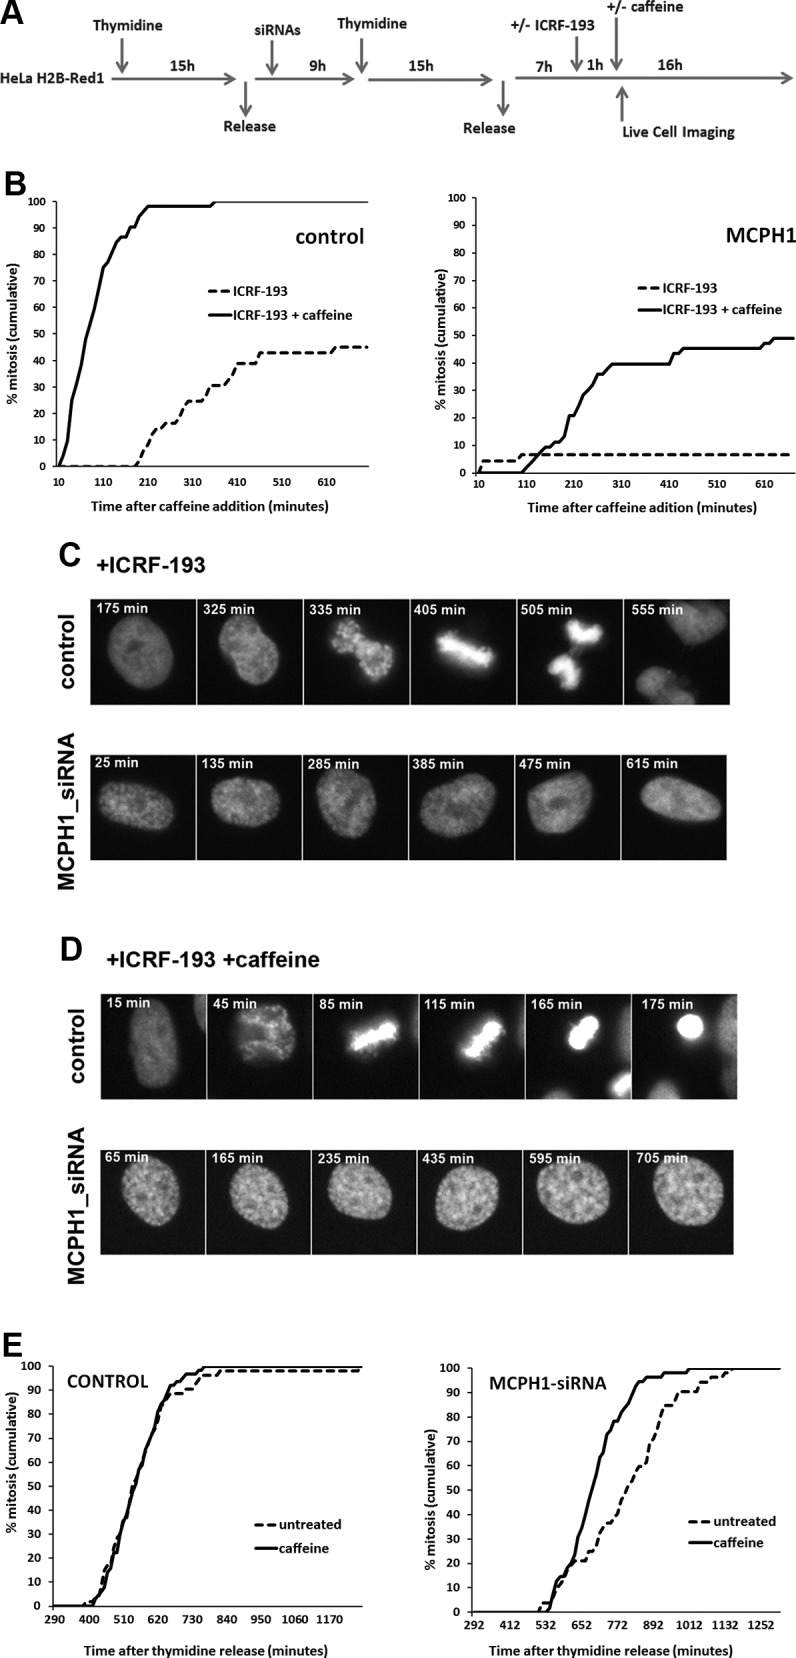
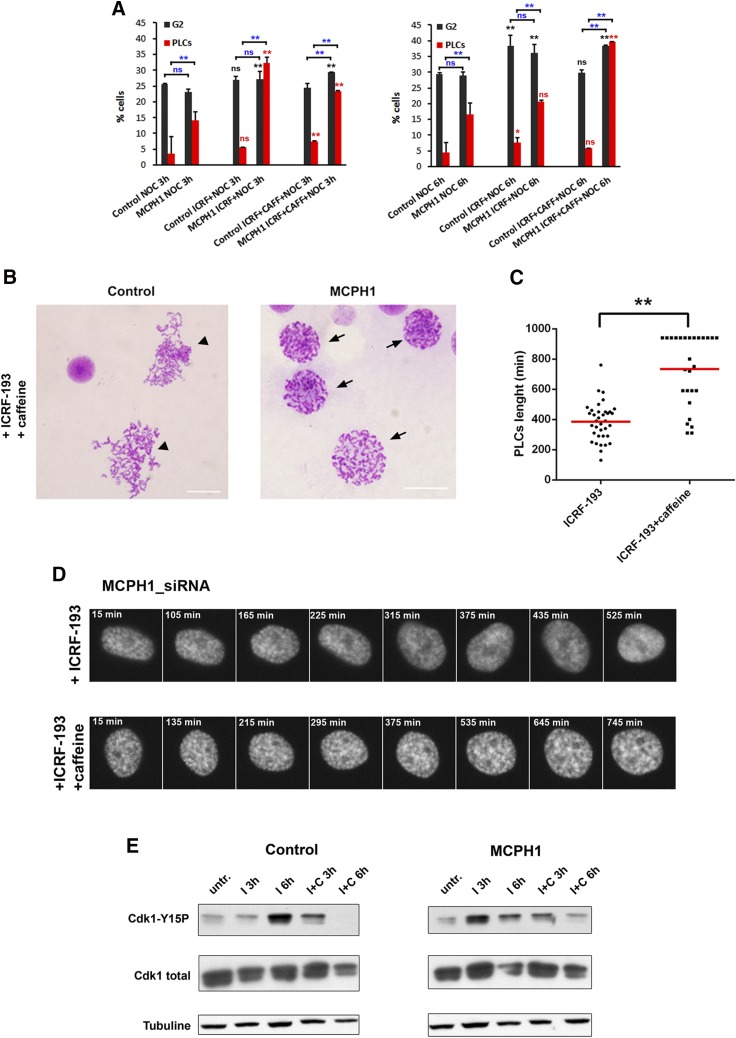
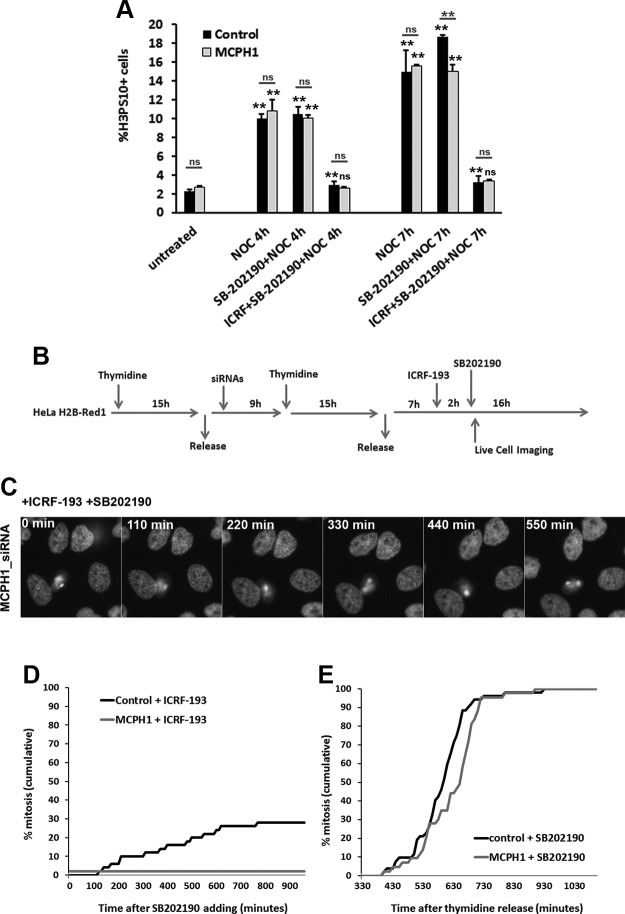
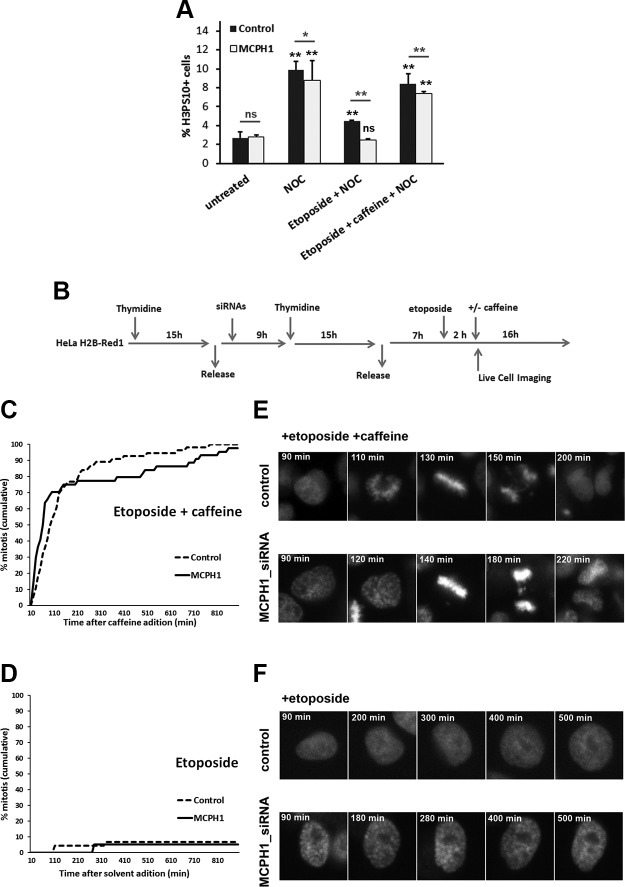
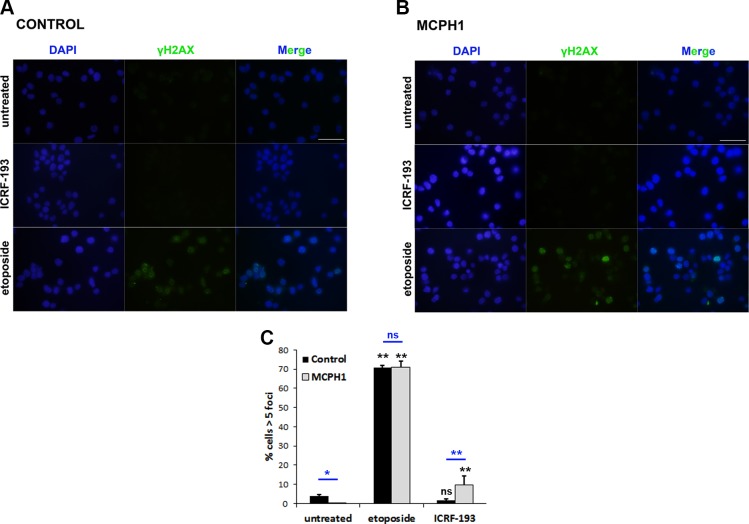
Cellular checkpoints controlling entry into mitosis monitor the integrity of the DNA and delay mitosis onset until the alteration is fully repaired. However, this canonical response can weaken, leading to a spontaneous bypass of the checkpoint, a process referred to as checkpoint adaptation. Here, we have investigated the contribution of microcephalin 1 (MCPH1), mutated in primary microcephaly, to the decatenation checkpoint, a less-understood G2 pathway that delays entry into mitosis until chromosomes are properly disentangled. Our results demonstrate that, although MCPH1 function is dispensable for activation and maintenance of the decatenation checkpoint, it is required for the adaptive response that bypasses the topoisomerase II inhibition----mediated G2 arrest. MCPH1, however, does not confer adaptation to the G2 arrest triggered by the ataxia telangiectasia mutated- and ataxia telangiectasia and rad3 related-based DNA damage checkpoint. In addition to revealing a new role for MCPH1 in cell cycle control, our study provides new insights into the genetic requirements that allow cellular adaptation to G2 checkpoints, a process that remains poorly understood.-Arroyo, M., Kuriyama, R., Guerrero, I., Keifenheim, D., Cañuelo, A., Calahorra, J., Sánchez, A., Clarke, D. J., Marchal, J. A. MCPH1 is essential for cellular adaptation to the G2-phase decatenation checkpoint.

Keywords: MCPH1; cell cycle control; checkpoint adaptation; chromosome condensation; topoisomerase II.


Conflict of interest statement

The authors express gratitude to H. Neitzel (Charite Virchow-Klinikum Hospital, Berlin, Germany) for providing the lymphoblast cell lines used in this study, G. Marques (University of Minnesota–Minneapolis, Minneapolis, MN, USA) for technical assistance, and J. F. Gimenez-Abián [Centre for Biological Research (CIB), Madrid, Spain] and V. Rodriguez-Bravo (Sidney Kimmel Cancer Center, Baltimore, MD, USA) for helpful discussions. Technical and human support provided by Centro de Instrumentación Científico-Técnica [CICT; Universidad de Jaén, Ministry of Economy and Competitiveness (MINECO), Junta de Andalucía, Federación Española de Enfermedades Raras (FEDER)] is gratefully acknowledged. This work was supported by Junta de Andalucía (funding program Ayudas a Grupos de Investigación, BIO 220). M.A. was provided with travelling grants to perform short-term stays at the University of Minnesota by EMBO and Escuela de Doctorado (UJA), respectively. Research at the laboratory of R.K. was financially supported by the National Science Foundation (MCB1140033). Studies performed in the laboratory of D.J.C. were funded by U.S. National Institutes of Health (NIH), National Institute of General Medical Sciences Grants R01GM112793 and R01GM130858. The authors declare no conflicts of interest.

Figures

Figure 1
Figure 1
AD) Frequency of histone H3PS10–positive cells in control and MCPH1 cells determined by flow cytometry after incubation with nocodazole alone (A) or combined with either ICRF-193 (B), caffeine (C), or both (D) for the indicated time points. Mean and range (bars) data from 2 independent experiments are presented. Pooled data from control and patient cells were compared by χ2 test of independence. EH) Fold increase of G2 cell fraction, related to untreated samples, in control and MCPH1 cells incubated as described in AD during 3 h (E), 6 h (F), 10 h (G), and 13 h (H). Mean and range (bars) data from 2 independent experiments are presented. For each time point, pooled data for each treatment were compared independently in control and patient cells by χ2 test of independence to nocodazole-treated cells. Furthermore, for each treatment and time point, control and patient data were pairwise compared by χ2 test of independence (underlined). CAFF, caffeine; NOC, nocodazole; ns, nonsignificant. *P < 0.01, **P < 0.001.
Figure 2
Figure 2
A) Description of the experimental procedure employed. HeLa cells stably expressing fluorescent histone H2B fused to Red1 were synchronized at the G1/S border by double thymidine block. Transfection with siRNAs was performed during the release from the first thymidine block. ICRF-193 was added 7 h after release from the second thymidine block to coincide with the occurrence of PLCs during G2 in the siRNA-treated cells. Caffeine (or an equal volume of medium) was added 1 h after ICRF-193 treatment. Time-lapse images were collected using a Nikon Biostation IM Cell Incubator immediately after caffeine (or medium) adding. B) Cumulative frequency chart showing the timing (min) of mitosis onset after the indicated treatments in cells transfected with either control scrambled or MCPH1 siRNAs and monitored in A. Time after caffeine (or solvent) addition is shown. Timing data were obtained after visual inspection of mitosis onset, revealed by nuclear envelope breakdown, of a minimum of 50 cells. Cells treated under the same conditions but without adding siRNAs to the transfection mixture showed cell cycle dynamics similar to the scrambled siRNA–transfected cells (unpublished results). C, D) Selected frames showing the mitotic progression of representative control and MCPH1-depleted HeLa cells treated with ICRF-193 alone (C) or combined with caffeine (D) as indicated in A. Time form caffeine (or medium) addition is indicated in minutes. E) Cumulative frequency chart showing the timing (min) of mitosis onset after incubation with caffeine or solvent (untreated). Time after release from the second thymidine block is shown. Caffeine was added 200 min after the release. At least 50 cells were analyzed in each case. Control cells were treated under the same conditions as MCPH1-siRNA–treated cells but without adding siRNAs to the transfection mixture.
Figure 3
Figure 3
A) Percentage of PLCs and G2 cells in control and MCPH1 lymphoblastoid cells observed after either 3 h (left) or 6 h (right) with the indicated treatments. PLCs were determined by microscopic analysis of cytogenetic preparations prepared simultaneously from the same samples shown in Fig. 1. More than 500 cells were scored per sample. G2 fraction was obtained by flow cytometry. Mean and range (bars) data from 2 independent experiments are presented. For each time point, pooled data for each treatment were compared independently in control and patient cells by c2 test of independence to nocodazole-treated cells. Furthermore, for each treatment and time point, control and patient data were pairwise compared by c2 test of independence (underlined). *P < 0.01, **P < 0.001. B) Representative images from cytogenetic preparations of control and MCPH1 cells treated simultaneously with ICRF-193 and caffeine. Arrows point to PLCs, a cellular phenotype characteristic of MCPH1 lack of function that is defined by visible chromosome condensation and intact nuclear envelope. Arrow heads point to cells with tangled, unresolved, and uncondensed chromosomes, characteristic of cells entering mitosis without topo II function. Scale bars, 5 μM. C) Box-plots showing the time (in minutes) that PLCs from MCPH1-siRNA–treated HeLa cells required to completely decondense their chromosomes after adding ICRF-193 alone or combined with caffeine. The red line indicates the mean value. Thirty PLCs were monitored. Statistical comparisons for the mean and median data were done by Student’s t and Wilcoxon tests, respectively. **P < 0.01. D) Selected frames showing the condensation dynamics of MCPH1-siRNA–treated HeLa cells while incubated with ICRF-193 alone or combined with caffeine as explained in Fig. 2A. Note that the PLC phenotype of the cells, visible from the first frames, is progressively reduced in ICRF-193–treated but not in ICRF-193– and caffeine-treated cells. Time from caffeine addition is indicated in minutes. I, ICRF-193; C, caffeine; ns, nonsignificant; untr., untreated. E) Immunoblot analyses of CDK1 levels in control and MCPH1 cells after incubation with ICRF-193 or combined with caffeine.
Figure 4
Figure 4
A) Frequency of histone H3PS10–positive cells in control and MCPH1 cells determined by flow cytometry after incubation with nocodazole alone or combined with either SB202190 or SB202190 and ICRF-193 for the indicated time points. Mean and range (bars) data from 2 independent experiments are presented. For each time point, pooled data for each treatment were compared independently in control and patient cells by χ2 test of independence to untreated cells. Furthermore, for each treatment and time point, control and patient data were pairwise compared by χ2 test of independence (underlined). B) Experimental procedure employed in HeLa H2B-Red1 cells to monitor cell cycle progression by live-cell microscopy after incubation with ICRF-193 and SB202190. C) Selected frames showing the cell cycle dynamic of MCPH1 siRNA–treated HeLa cells while incubated with ICRF-193 and SB202190. Time from SB202190 addition is indicated in minutes. D) Cumulative frequency chart showing the timing (in minutes) of mitosis onset for cells transfected with either control scrambled or MCPH1 siRNAs and treated as explained in B. Time after SB202190 addition is shown. At least 50 cells were analyzed in each case. Cells treated under the same conditions but without adding siRNAs to the transfection mixture showed similar cell cycle dynamics to the scrambled siRNA–transfected cells (unpublished results). E) Cumulative frequency chart showing the timing (min) of mitosis onset after single incubation with SB202190. Time after release from the second thymidine block is shown. SB202190 was added 300 min after the release. Control cells were treated under the same conditions as MCPH1-siRNA–treated cells but without adding siRNAs to the transfection mixture. At least 50 cells were analyzed in each case. Note that all cells were later arrested in mitosis as a consequence of p38 inhibition. NOC, nocodazole; ns, nonsignificant. **P < 0.001.
Figure 5
Figure 5
A) Fraction of histone H3PS10–positive cells, determined by flow cytometry, in control and MCPH1 cells after 4 h of incubation with nocodazole alone or combined with either etoposide or etoposide and caffeine. Mean and range (bars) data from 2 independent experiments are presented. Pooled data for each treatment were compared independently in control and patient cells by χ2 test of independence to untreated cells. Furthermore, for each treatment control and patient, data were pairwise compared by χ2 test of independence (underlined). B) Experimental procedures employed in HeLa H2B-Red1 cells to monitor cell cycle progression by live-cell microscopy after incubation with etoposide alone or combined with caffeine. C) Cumulative frequency chart showing the timing (in minutes) of mitosis onset for cells transfected with either control scrambled or MCPH1- siRNAs and treated with etoposide and caffeine as explained in B. Time after caffeine addition is shown. At least 50 cells were analyzed in each case. Cells treated under the same conditions but without adding siRNAs to the transfection mixture showed similar cell cycle dynamics to scrambled siRNA–transfected cells (unpublished results). D) Cumulative frequency chart showing the timing (min) of mitosis onset after single incubation with etoposide. Time after solvent addition, which replaced caffeine, is shown. Control cells were treated under the same conditions as MCPH1-siRNA–treated cells but without adding siRNAs to the transfection mixture. At least 50 cells were analyzed in each case. E, F) Selected frames showing the mitotic progression of representative control and MCPH1-depleted HeLa cells treated with etoposide and caffeine (E) or etoposide alone (F) as indicated in B. Time from etoposide addition is indicated in minutes. Note that in control and MCPH1-depleted cells treated with etoposide and caffeine, cells enter mitosis immediately, and chromosome segregation is further altered probably as a consequence of the DNA damage induced by etoposide. NOC, nocodazole; ns, nonsignificant. *P < 0.01, **P < 0.001.
Figure 6
Figure 6
A, B) Representative images from immunofluorescence analyses using an antibody against γ-H2AX (MilliporeSigma) in proliferating lymphoblasts from control (A) and MCPH1 cells (B) treated with either DMSO (untreated), ICRF-193, or etoposide. Scale bars, 5 μM. C) Fraction of cells containing more than 5 γ-H2AX foci from the described analyses in A, B. At least 200 cells from 2 independent experiments were counted; mean and range (bars) data are presented. Pooled data for each treatment were compared independently in control and patient cells by χ2 test of independence to untreated cells. Furthermore, for each treatment, control and patient data were pairwise compared by χ2 test of independence (underlined). Ns, nonsignificant. *P < 0.01, **P < 0.001.

References

    1. Van Vugt M. A. T. M., Brás A., Medema R. H. (2004) Polo-like kinase-1 controls recovery from a G2 DNA damage-induced arrest in mammalian cells. Mol. Cell 15, 799–811 - PubMed
    1. Paulovich A. G., Toczyski D. P., Hartwell L. H. (1997) When checkpoints fail. Cell 88, 315–321 - PubMed
    1. Serrano D., D’Amours D. (2016) Checkpoint adaptation: keeping Cdc5 in the T-loop. Cell Cycle 15, 3339–3340 - PMC - PubMed
    1. Neitzel H., Neumann L. M., Schindler D., Wirges A., Tönnies H., Trimborn M., Krebsova A., Richter R., Sperling K. (2002) Premature chromosome condensation in humans associated with microcephaly and mental retardation: a novel autosomal recessive condition. Am. J. Hum. Genet. 70, 1015–1022 - PMC - PubMed
    1. Trimborn M., Bell S. M., Felix C., Rashid Y., Jafri H., Griffiths P. D., Neumann L. M., Krebs A., Reis A., Sperling K., Neitzel H., Jackson A. P. (2004) Mutations in microcephalin cause aberrant regulation of chromosome condensation. Am. J. Hum. Genet. 75, 261–266 - PMC - PubMed

Publication types

MeSH terms