. 2019 Jun 19;10(6):2707-2717.
doi: 10.1021/acschemneuro.8b00558. Epub 2019 Apr 19.

Palmitoylation by Multiple DHHC Enzymes Enhances Dopamine Transporter Function and Stability

Affiliations

Palmitoylation by Multiple DHHC Enzymes Enhances Dopamine Transporter Function and Stability

Danielle E Bolland et al. ACS Chem Neurosci. .

Abstract

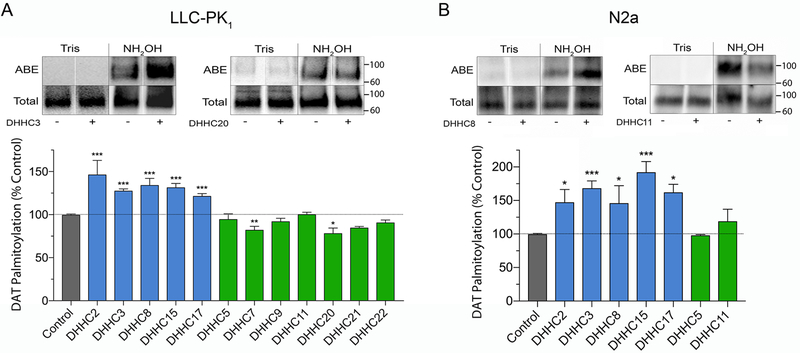
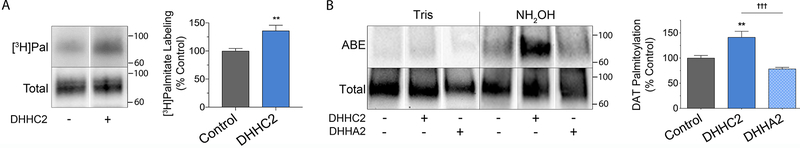
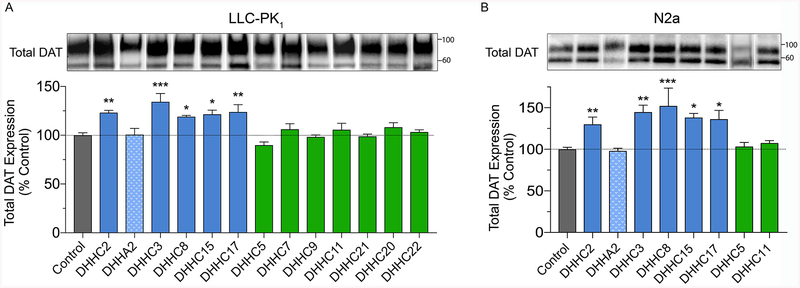
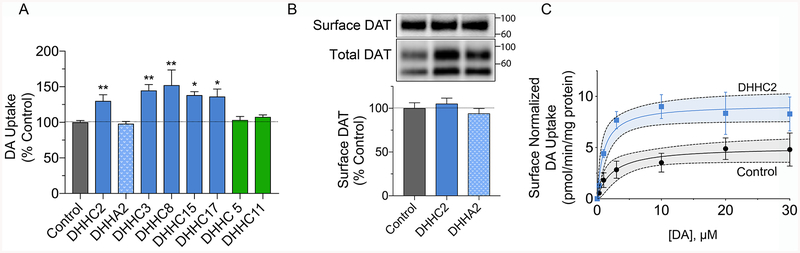
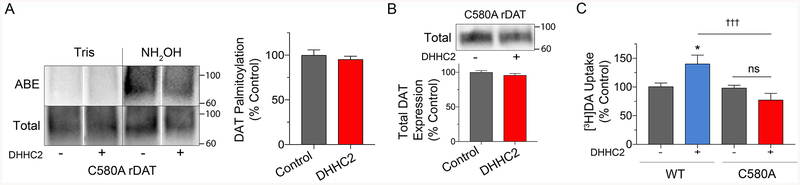
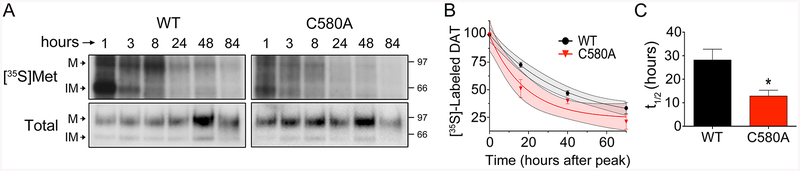
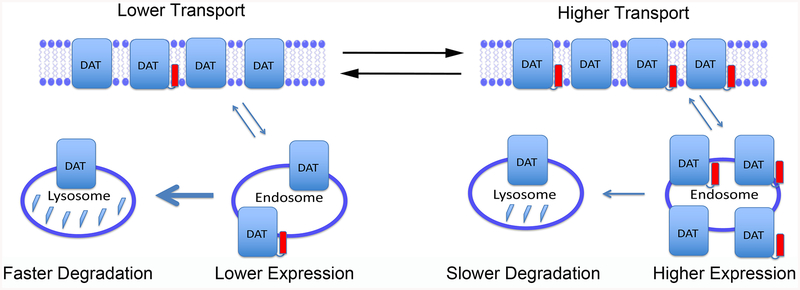
The dopamine transporter (DAT) is a plasma membrane protein that mediates the reuptake of extracellular dopamine (DA) and controls the spatiotemporal dynamics of dopaminergic neurotransmission. The transporter is subject to fine control that tailors clearance of transmitter to physiological demands, and dysregulation of reuptake induced by psychostimulant drugs, transporter polymorphisms, and signaling defects may impact transmitter tone in disease states. We previously demonstrated that DAT undergoes complex regulation by palmitoylation, with acute inhibition of the modification leading to rapid reduction of transport activity and sustained inhibition of the modification leading to transporter degradation and reduced expression. Here, to examine mechanisms and outcomes related to increased modification, we coexpressed DAT with palmitoyl acyltransferases (PATs), also known as DHHC enzymes, which catalyze palmitate addition to proteins. Of 12 PATs tested, DAT palmitoylation was stimulated by DHHC2, DHHC3, DHHC8, DHHC15, and DHHC17, with others having no effect. Increased modification was localized to previously identified palmitoylation site Cys580 and resulted in upregulation of transport kinetics and elevated transporter expression mediated by reduced degradation. These findings confirm palmitoylation as a regulator of multiple DAT properties crucial for appropriate DA homeostasis and identify several potential PAT pathways linked to these effects. Defects in palmitoylation processes thus represent possible mechanisms of transport imbalances in DA disorders.

Keywords: [S]-methionine labeling; acyl protein thioesterase; palmitoyl acyl transferase; post-translational modification; protein degradation; protein palmitoyl thioesterase.


Conflict of interest statement

Conflict of interest: The authors declare that they have no conflicts of interest with the content of this article.

Figures

Figure 1.
Figure 1.. Effect of DHHC enzymes on DAT palmitoylation.
A, rDAT-LLCPK1 or B, rDAT-N2a cells were transfected with indicated DHHC plasmids and equal amounts of DAT protein were assessed for palmitoylation. Blots show representative ABE (palmitoylated) and total DAT samples and histograms show quantification of DAT palmitoylation (% Control, means ± S.E), *p<0.05, **p<0.01, ***p<0.001 vs Control (ANOVA with Dunnett’s posttest, n=3–4). Shading indicates DAT palmitoylation values for vector control (gray), DHHC enzymes that increased DAT palmitoylation (blue), and DHHC enzymes that did not increase DAT palmitoylation (green). Vertical white dividing lines indicate the rearrangement of lane images from the same blot. Mr markers for all gels are shown at right.
Figure 2.
Figure 2.. DAT palmitoylation specificity controls.
A, rDAT-LLCPK1 cells transfected with control or DHHC2 plasmids were labeled for 18h with [3H]palmitic acid. Equal amounts of DAT were immunoprecipitated and subjected to SDS-PAGE/autofluorography. Left, representative autoradiogram and matching immunoblot. Right, quantification of [3H]palmitate labeling (% Control, means ± S.E.). **p<0.01 DHHC2 vs control (Student’s t-test, n=3). B, rDAT-LLCPK1 cells were transfected with indicated plasmids and equal amounts of DAT analyzed for palmitoylation. Left, representative ABE and total DAT blots. Right, quantification of palmitoylation (% Control, means ± S.E). **p<0.01, DHHC2 vs Control; †††p<0.001 DHHA2 vs DHHC2 (ANOVA with Tukey’s posttest, n=4). Shading indicates DAT palmitoylation responses for vector control (gray), DHHC2 (blue) and catalytically inactive DHHA2 (stippled blue). Vertical white dividing lines indicate rearrangement of lane images from the same immunoblot or autoradiogram.
Figure 3.
Figure 3.. Effect of DHHC enzymes on DAT expression.
A, rDAT-LLCPK1 or B, rDAT-N2a cells were transfected with indicated DHHC plasmids and equal amounts of protein were immunoblotted for DAT. Top panels show representative blots (lanes ordered as in graphs), and histograms show quantification of band densities (% Control, means ± S.E.) *p<0.05, **p<0.01, ***p<0.001 vs Control (ANOVA with Dunnett’s posttest, n=4). Shading indicates DAT expression values for vector control (gray), DHHC enzymes that increased DAT palmitoylation (blue), DHHC enzymes that did not increase DAT palmitoylation (green), and catalytically inactive DHHA2 (stippled blue). Vertical white dividing lines indicate rearrangement of lane images from the same blot.
Figure 4.
Figure 4.. Effect of DHHC enzymes on DA transport.
A, rDAT-N2a cells transfected with the indicated DHHC plasmids were assayed for [3H]DA uptake, and transport values were normalized to total protein and expressed as % control, means ± S.E. *p<0.05, **p<0.01 vs Control (ANOVA with a Dunnett’s post-hoc test, n=3–5). Shading indicates DA uptake values for cells transfected with vector control (gray), DHHC enzymes that increased DAT palmitoylation (blue), DHHC enzymes that did not increase DAT palmitoylation (green), and catalytically inactive DHHA2 (stippled blue). B, Surface biotinylation analysis of rDAT-N2a cells transfected with Control, DHHC2, or DHHA2 plasmids. Upper and lower panels show representative blots of surface or total DATs from 100 μg or 25 μg protein, respectively, and histogram shows quantification of surface band densities (% Control, means ± S.E.), all samples p>0.05 vs control (ANOVA with Dunnett’s posttest, n=5–8). C, Transport saturation analysis of rDAT-N2a cells transfected with Control or DHHC2 plasmids. Each point represents means ± S.E. of three independent experiments, normalized to surface DAT, and results were fit to Michaelis-Menten kinetics. Gray and blue shading indicates 95% confidence intervals for each curve.
Figure 5.
Figure 5.. Cys580 mediates DHHC2 effects.
A, LLCPK1 cells, or B and C, N2a cells expressing WT or C580A DAT as indicated, were transfected with control or DHHC2 plasmids and assessed for palmitoylation (A), expression (B), or uptake (C). A, Left, representative ABE and total C580A DAT blots; Right, quantification of palmitoylation (% Control, means ± S.E). p>0.05, Student’s t-test (n=4). B, Representative immunoblot and quantification of band densities for C580A DAT expression (% Control, mean ± S.E., n=3). C, [3H]DA uptake in WT- or C580A-DAT cells. (% Control for each form, means ± S.E.) *p<0.05, WT/DHHC2 vs WT Control; †††p<0.001 C580A/DHHC2 vs WT/DHHC2; ns, no significant difference (Two-way ANOVA with Tukey’s post-test; C580A: F(1, 29) = 15.30; DHHC: F(1, 29) = 1.257; interaction: F(1, 29) = 13.13; p < 0.001; n=3–5). Gray shading indicates responses of WT or C580 DAT to control conditions, red shading indicates C580A DAT responses to DHHC2, and blue shading indicates WT DAT responses to DHHC2. Vertical white dividing lines indicate rearrangement of lane images from the same blot.
Figure 6.
Figure 6.. Cys580 palmitoylation regulates DAT turnover.
WT and C580A rDAT-LLCPK1 cells were labeled with [35S]Met for 30 min followed by chase with unlabeled medium, and samples were collected at the indicated times post-pulse. DAT levels were determined by immunoblotting and equal amounts immunoprecipitated for analysis of [35S]Met labeling. A, Representative autoradiograms of [35S]Met-labeled DATs with matching immunoblots. M, mature form; IM, immature form. B, Quantification of [35S]Met labeling in 90kDa (M) bands of WT and C580A DAT forms, normalized to peak levels for each form at 8h post-pulse. Curves were fit to One Phase Decay, (goodness of fit WT DAT r = 0.97; C580A DAT, r2 = 0.91; Two-way ANOVA; C580A: F(1, 4) = 4.6; Time: F(1.348, 4.942) = 181.5; interaction: F(3, 11) = 3.8; p<0.05). Gray and red shading indicates 95% confidence intervals for WT and C580A decay curves, respectively. C, Half-life of WT and C580A DAT proteins obtained from decay curves (means ± S.E., three independent experiments). * p<0.05 C580A vs WT (Student’s t-test, n=3).
Figure 7.
Figure 7.. Model of DAT palmitoylation functions.
Schematic representation of DAT populations with lower (left) or higher (right) stoichiometries of Cys580 palmitoylation (red rectangles). Total transporter expression is indicated by number of DAT symbols, with equal numbers of transporters at the surface in both conditions, and higher numbers of transporters in internal endosome or vesicular compartments on the right. Relative rates of transport activity are indicated at top, and large and small arrows leading from vesicles to lysosomes represent relative rates of transporter degradation.

References

    1. Torres GE, Gainetdinov RR, and Caron MG (2003) Plasma membrane monoamine transporters: structure, regulation and function, Nat Rev Neurosci 4, 13–25. - PubMed
    1. Iversen SD, and Iversen LL (2007) Dopamine: 50 years in perspective, Trends Neurosci 30, 188–193. - PubMed
    1. Eriksen J, Jorgensen TN, and Gether U (2010) Regulation of dopamine transporter function by protein-protein interactions: new discoveries and methodological challenges, J Neurochem 113, 27–41. - PubMed
    1. Kristensen AS, Andersen J, Jorgensen TN, Sorensen L, Eriksen J, Loland CJ, Stromgaard K, and Gether U (2011) SLC6 neurotransmitter transporters: structure, function, and regulation, Pharmacol Rev 63, 585–640. - PubMed
    1. Rudnick G, Kramer R, Blakely RD, Murphy DL, and Verrey F (2014) The SLC6 transporters: perspectives on structure, functions, regulation, and models for transporter dysfunction, Pflugers Arch 466, 25–42. - PMC - PubMed

Publication types