. 2019 Apr 8;16(7):1252.
doi: 10.3390/ijerph16071252.

Using Low-Cost Air Quality Sensor Networks to Improve the Spatial and Temporal Resolution of Concentration Maps

Affiliations

Using Low-Cost Air Quality Sensor Networks to Improve the Spatial and Temporal Resolution of Concentration Maps

Faraz Enayati Ahangar et al. Int J Environ Res Public Health. .

Abstract

We present an approach to analyzing fine particulate matter (PM2.5) data from a network of "low cost air quality monitors" (LCAQM) to obtain a finely resolved concentration map. In the approach, based on a dispersion model, we first identify the probable locations of the sources, and then estimate the magnitudes of the emissions from these sources by fitting model estimates of concentrations to corresponding measurements. The emissions are then used to estimate concentrations on a grid covering the domain of interest. The residuals between model estimates at the monitor locations and the measured concentrations are then interpolated to the grid points using Kriging. We illustrate this approach by applying it to a network of 20 LCAQMs located in the Imperial Valley of Southern California. Estimating the underlying mean concentration field with a dispersion model provides a more realistic estimate of the spatial distribution of PM2.5 concentrations than that from the Kriging observations directly.

Keywords: Kriging; LCAQM; PM2.5; dispersion modeling; imperial valley; spatial interpolation.


Conflict of interest statement

The authors declare no conflict of interests.

Figures
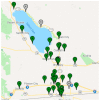
Figure 1
Figure 1
Map of IVAN low-cost sensors in the Imperial Valley for a particular day [28]. Green pins are monitors operating on the day, grey pins are monitors that were offline.
Figure 2
Figure 2
Daily averaged concentrations over the year 2017 of the IVAN sensor in Calexico compared with the regulatory agency Calexico-Ethel St. street station.
Figure 3
Figure 3
Locations of sources (blue dashed lines) and IVAN air monitors (red dots) used in dispersion modeling.
Figure 4
Figure 4
Wind rose of hourly winds from Imperial County Airport (KIPL) for 2017.
Figure 5
Figure 5
Annually average measured PM2.5 concentrations at selected sensors in the IVAN system for 2017.
Figure 6
Figure 6
(a) Model performance for annually averaged data (red lines show factor of 1.5 deviations about observations). (b) Annual emission rates for different source categories inferred from the modeling.
Figure 7
Figure 7
(a) Model performance for monthly averaged data (red lines show factor of 1.5 of observation). (b) Emission rates from different source categories.
Figure 8
Figure 8
Model performance for different sensors for monthly averaged concentrations at (a) Brawley, (b) El Centro, (c) Calexico, and (d) Westmorland.
Figure 9
Figure 9
Monthly averaged model concentrations compared to measurements at the Calexico-Ethel St. regulatory station.
Figure 10
Figure 10
Model determined annual emission rates of different sources versus different prescribed inputs of initial plume spread (σz0).
Figure 11
Figure 11
Map of residuals of annually averaged model minus measured concentrations. Map produced by Kriging residuals of model minus measured concentrations computed at IVAN receptors over the valley. See Section 3.3 for discussion.
Figure 12
Figure 12
Annually averaged PM2.5 concentration maps for the year 2017 produced using (a) simple Kriging and (b) residual Kriging.
Figure 12
Figure 12
Annually averaged PM2.5 concentration maps for the year 2017 produced using (a) simple Kriging and (b) residual Kriging.
Figure 13
Figure 13
Histograms of PM2.5 concentrations over the 1000 m resolved receptors used to construct maps in Figure 12, calculated using (a) Simple Kriging, left panel, and (b) Residual Kriging, right panel.
Figure 14
Figure 14
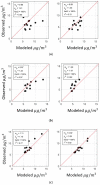
Cross-validation using simple Kriging model (left panels) and residual Kriging (right panels) at (a) Westmorland, (b) Seeley, and (c) Holtville.

References

    1. Brook R.D., Newby D.E., Rajagopalan S. The global threat of outdoor ambient air pollution to cardiovascular health: Time for intervention. JAMA Cardiol. 2017;2:353–354. doi: 10.1001/jamacardio.2017.0032. - DOI - PubMed
    1. Khreis H., Kelly C., Tate J., Parslow R., Lucas K., Nieuwenhuijsen M. Exposure to traffic-related air pollution and risk of development of childhood asthma: A systematic review and meta-analysis. Environ. Int. 2017;100:1–31. doi: 10.1016/j.envint.2016.11.012. - DOI - PubMed
    1. Pope C.A., III Lung Cancer, Cardiopulmonary Mortality, and Long-term Exposure to Fine Particulate Air Pollution. JAMA J. Am. Med. Assoc. 2002 doi: 10.1001/jama.287.9.1132. - DOI - PMC - PubMed
    1. Hagler G.S.W., Solomon P.A., Hunt S.W. EM Air Waste Manag. Assoc. Mag. Environ. Manag. Air Waste Manag. Assoc.; Pittsburgh, PA, USA: 2014. New technology for low-cost, real-time air monitoring.
    1. Wang Y., Li J., Jing H., Zhang Q., Jiang J., Biswas P. Laboratory evaluation and calibration of three low-cost particle sensors for particulate matter measurement. Aerosol Sci. Technol. 2015;49:1063–1077. doi: 10.1080/02786826.2015.1100710. - DOI

Publication types