. 2019 Apr 8;8(4):329.
doi: 10.3390/cells8040329.

Neuroprotection, Recovery of Function and Endogenous Neurogenesis in Traumatic Spinal Cord Injury Following Transplantation of Activated Adipose Tissue

Affiliations

Neuroprotection, Recovery of Function and Endogenous Neurogenesis in Traumatic Spinal Cord Injury Following Transplantation of Activated Adipose Tissue

Stephana Carelli et al. Cells. .

Abstract

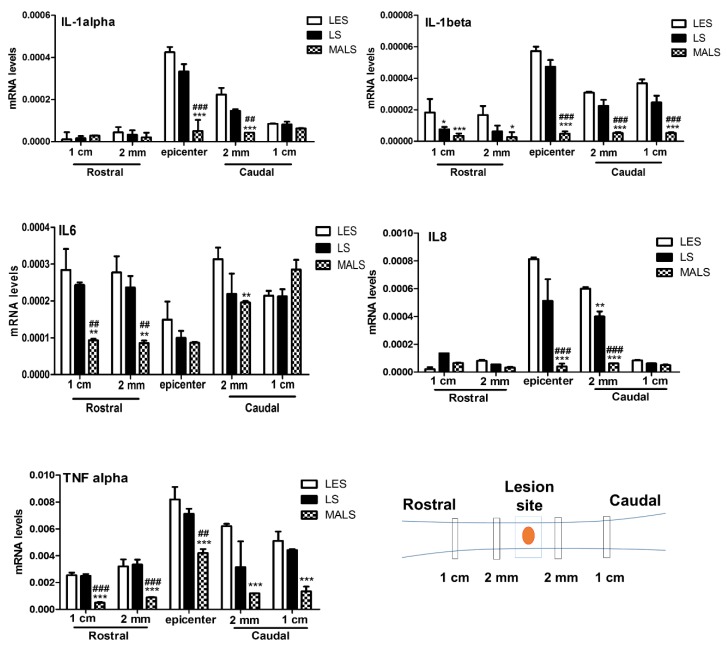
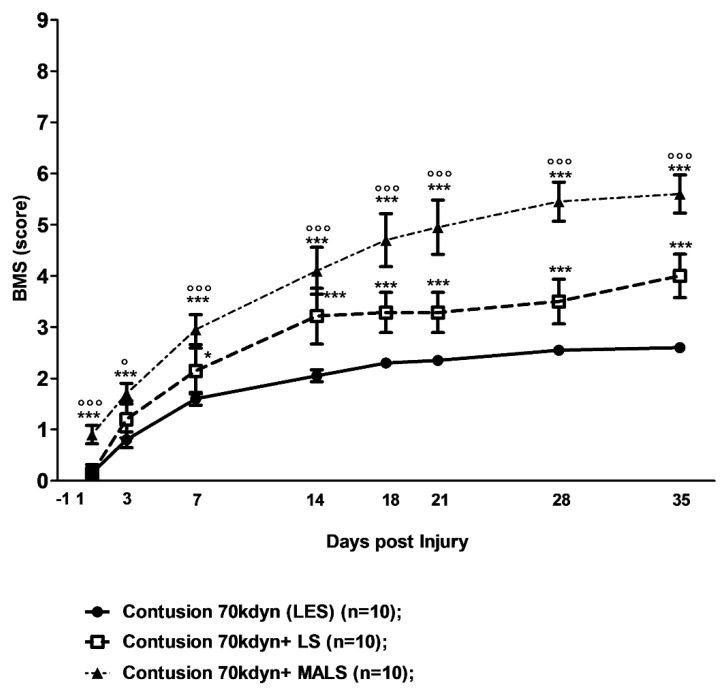
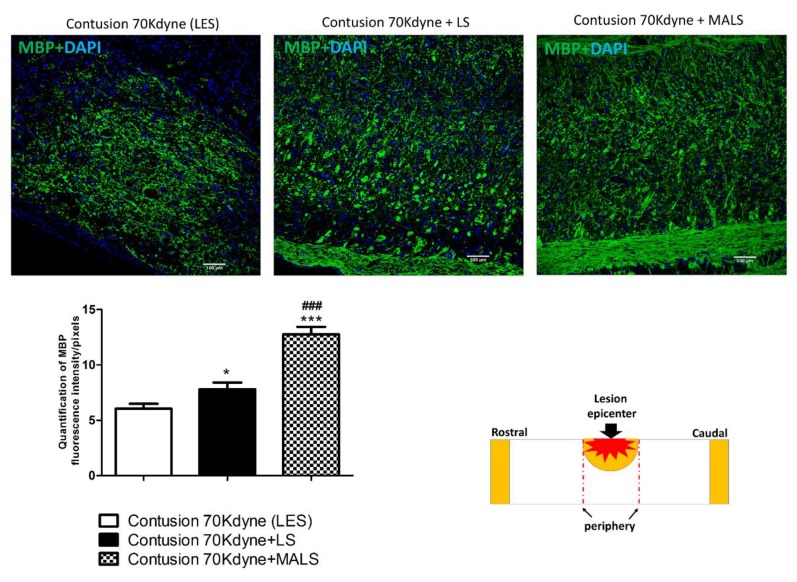
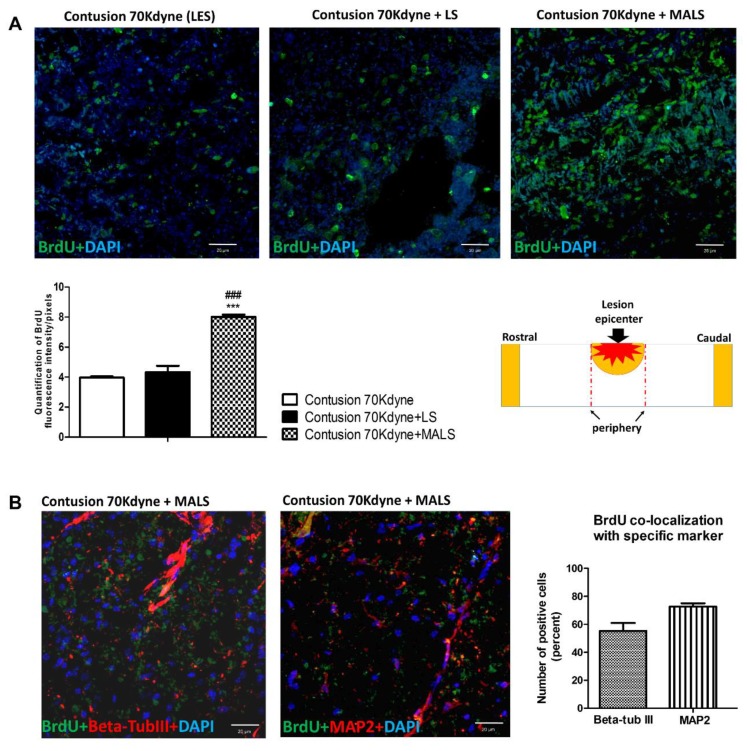
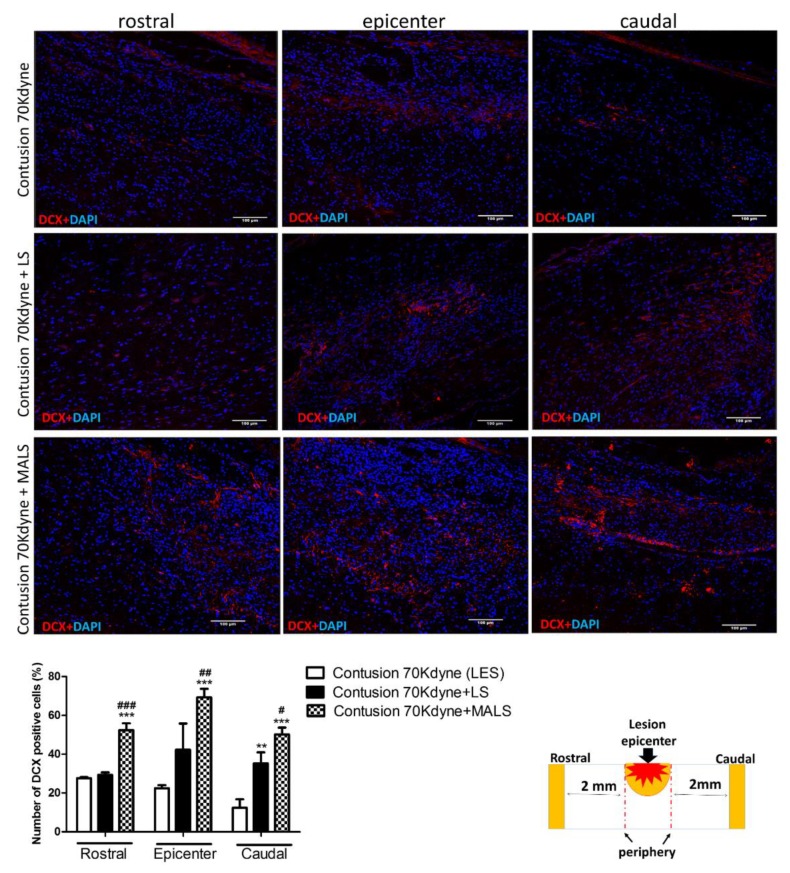
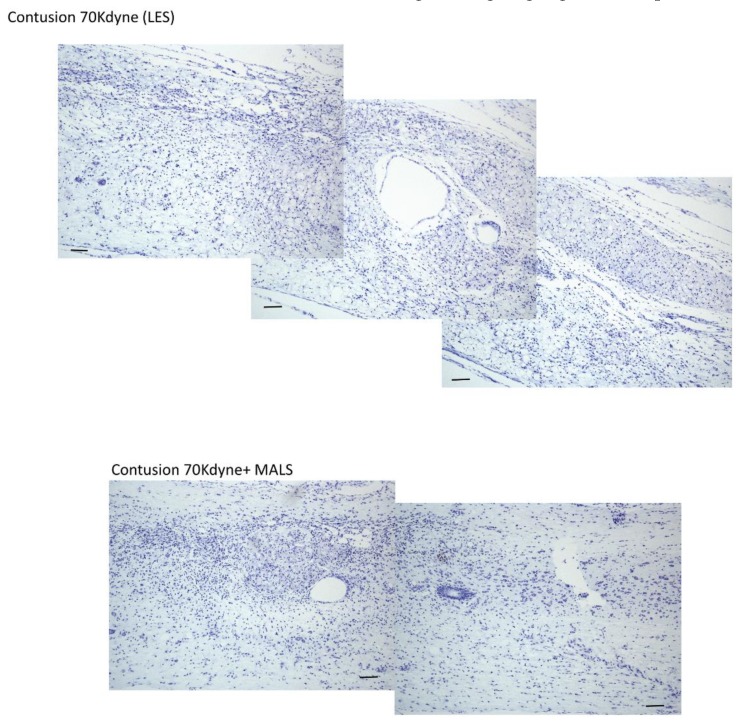
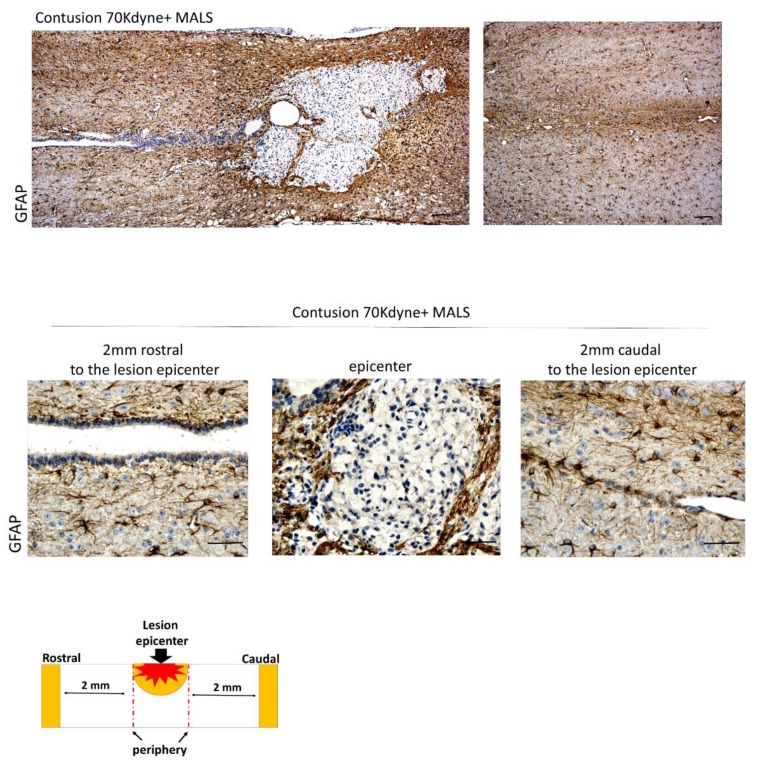
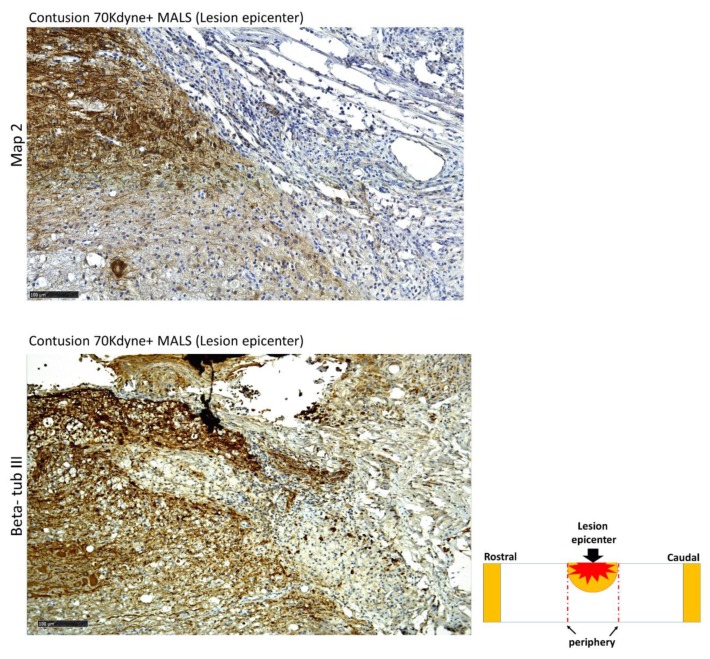
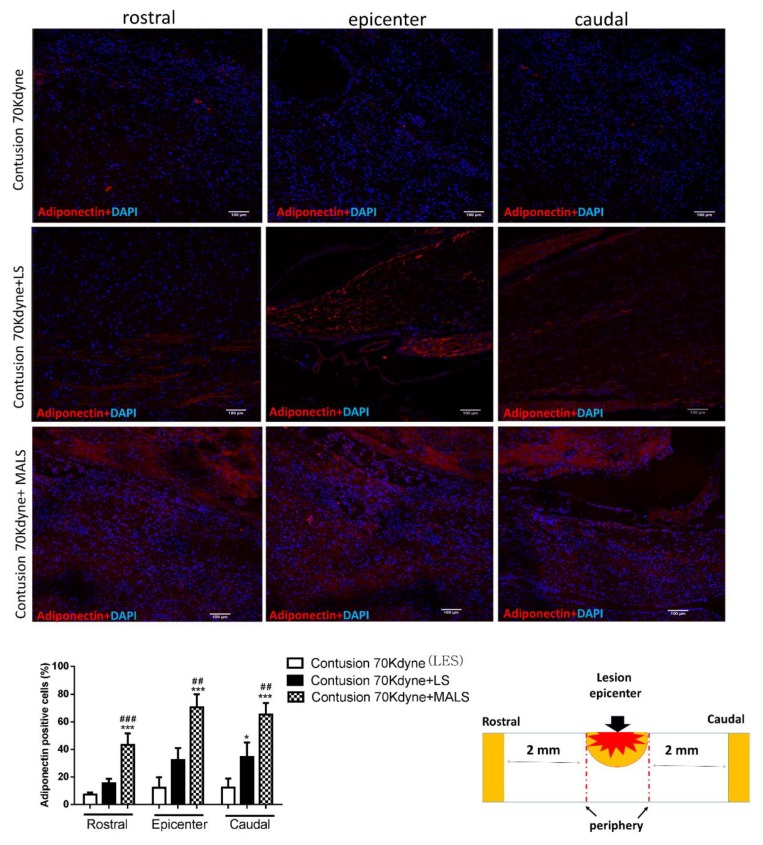
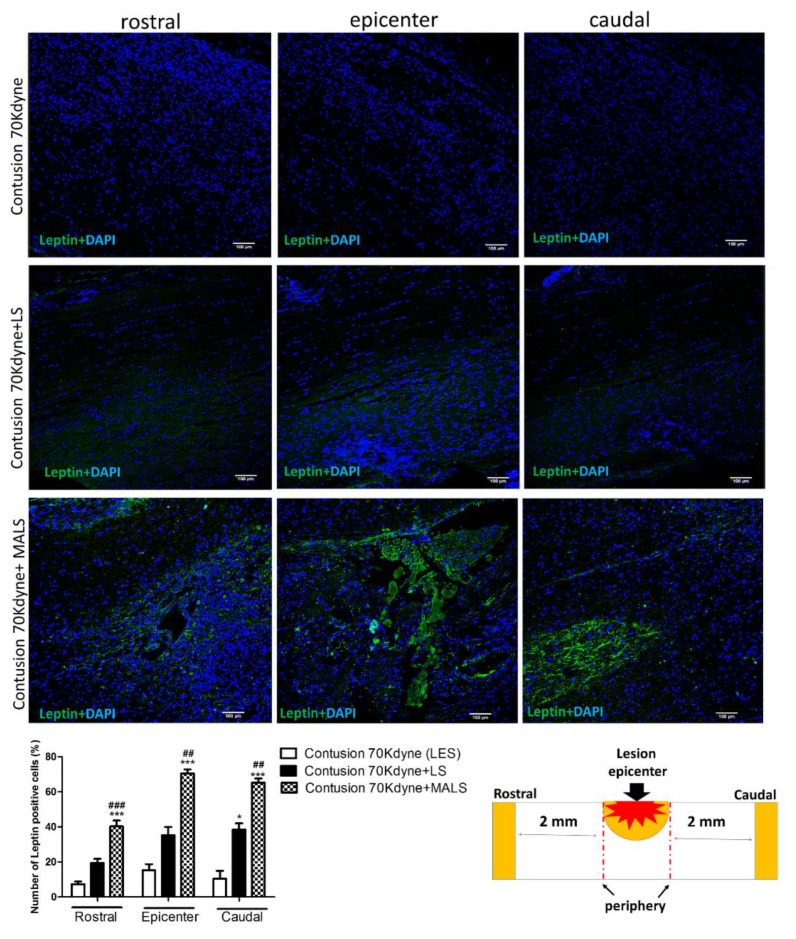
Spinal cord injury (SCI) is a devastating disease, which leads to paralysis and is associated to substantially high costs for the individual and society. At present, no effective therapies are available. Here, the use of mechanically-activated lipoaspirate adipose tissue (MALS) in a murine experimental model of SCI is presented. Our results show that, following acute intraspinal MALS transplantation, there is an engraftment at injury site with the acute powerful inhibition of the posttraumatic inflammatory response, followed by a significant progressive improvement in recovery of function. This is accompanied by spinal cord tissue preservation at the lesion site with the promotion of endogenous neurogenesis as indicated by the significant increase of Nestin-positive cells in perilesional areas. Cells originated from MALS infiltrate profoundly the recipient cord, while the extra-dural fat transplant is gradually impoverished in stromal cells. Altogether, these novel results suggest the potential of MALS application in the promotion of recovery in SCI.

Keywords: adipose tissue; cell therapies; inflammation; mechanical activation; neurogenesis; neuroprotection; spinal cord injury.


Conflict of interest statement

The authors declare no conflict of interest.

Figures

Figure 1
Figure 1
MALS tissue administration reduces the expression of pro-inflammatory cytokines. 35 days after transplantation, mRNA levels of IL-1 alpha, IL-1 beta, TNF-alpha, IL-6 and IL-8 were quantified at the lesion epicenter and 2 mm and 1 cm caudal and rostral to the lesion site of animals transplanted with Mechanically activated lipoaspirate (MALS), or with lipoaspirated tissue (LS) or in lesioned non- treated animals (LES). 18S was used as housekeeping gene. The evaluation was performed in triplicate on six different spinal cord samples for each condition. The data reported in the histogram are expressed as mean ± SD and statistical analysis was performed with Student’s t-test (n = 6). ***p < 0.001; ** p < 0.01; * p < 0.05 vs. LES. ### p < 0.001; ## p < 0.01 vs LS.
Figure 2
Figure 2
MALS promotes recovery of hind limb function. The evaluation of hind limb motor functional recovery was determined by the open field locomotion test [37]. Lesioned mice showed a remarkable and long-lasting improvement when treated with MALS. The groups were randomized, and the analysis was performed in double-blind fashion. Values represent mean ± SD (n = 10). Statistical differences were evaluated by means of two-way ANOVA test followed by Bonferroni’s post-test. *** p < 0.001; * p < 0.05 versus LES (lesioned untreated mice); °°° p < 0.001; ° p < 0.05 versus LS (lesioned mice treated with lipoaspirate).
Figure 3
Figure 3
Protective action of MALS on myelin sparing in the injured cord. The image shows the protective action of MALS tissue in the epicenter of the injured cord (please see schematic representation). After animal perfusion, spinal cords were dissected, postfixed, and longitudinally sectioned by means of a cryostat. Spinal cord tissue sections were stained for myelin basic protein (MBP, green). The confocal microscope images for the spinal cord of lesioned animals and transplanted with LS or MALS tissue were obtained using the same intensity, pinhole, wavelength, and thickness of the acquisition. Scale bar: 100 µm. The graph reported shows the quantification of fluorescence with reference to MBP staining. Data is expressed as mean of twelve different fields (n = 4 mice; 3 fields/mouse for each condition). Values represent mean ± SD. We determined the statistical differences by means of one-way ANOVA test followed by Bonferroni’s post-test. *** p < 0.001; *p < 0.05 vs. LES; ### p < 0.001 vs. LS.
Figure 4
Figure 4
Transplanted MALS promotes an increase of BrdU labeled cells positive to neuronal markers. (A) The images show the BrdU positive cells (green) at the lesion epicenter (please see schematic representation) of contused not treated animals (LES), contused animals treated with lipoaspirate tissue, or contused animals treated with MALS tissue. Nuclei are stained with DAPI. The confocal microscope images for the spinal cord of the three groups were obtained using the same intensity, pinhole, wavelength, and thickness of the acquisition. Scale bar 20 µm. The graph reported shows the quantification of fluorescence with reference to BrdU staining. Data is expressed as mean of nine different fields (n = 3 mice; 3 fields/mouse for each condition). Values represent mean ± SD. We determined the statistical differences by means of one-way ANOVA test followed by Bonferroni’s post-test (*** p < 0.001 vs. LES; ### p < 0.001 vs. LS). (B) Spinal cord sections of MALS treated animals labelled with BrdU (green) were counterstained with anti-beta-tubIII or anti-Map2 antibodies (in red). The graph shows the percentage of BrdU-positive cells expressing the above neuronal markers. Data is expressed as mean of nine different fields (n = 3 mice; 3 fields/mouse). Values represent mean ± SD.
Figure 5
Figure 5
MALS engraftment leads to increased neurogenesis in the grafted cord. The image shows an increase in neural precursor cells at the lesion site of MALS transplanted animals, as demonstrated by the increase in Nestin positive cells. The graph reported shows the quantification of the distribution of Nestin’s expression along the grafted cord. Data is expressed as mean of twelve different fields (n = 4 mice; 3 fields/mouse). Values represent mean ± SD. We determined the statistical differences by means of ANOVA test followed by Bonferroni’s post-test. *** p < 0.001 vs. LES; °° p < 0.01 of LES caudal vs. LES epicenter. Symbols ($;°;*) indicate the corresponding area in Figure S2.
Figure 6
Figure 6
MALS tissue promotes re-growth of neurons. Spinal cord longitudinal sections were examined for DCX (red) expression 35 days after MALS transplant. Scale bar: 100 µm. The graph shows the quantification of positive cells (percentage) in sections taken at the lesion epicenter, 2 mm rostral or caudal to the lesion epicenter (please see schematic representation). Values represent mean ± SD. We determined the statistical differences by means of one-way ANOVA test followed by Bonferroni’s post-test. ** p < 0.01, *** p < 0.001 vs. LES, # p < 0.05, ## p < 0.01, ### p < 0.001 vs. LS. (n = 4 mice; 2 sections/mouse; 3 fields/section area).
Figure 7
Figure 7
MALS transplanted spinal cords show increased neuronal presence cresyl violet staining of the lesioned spinal cord. The staining shows the presence of Nissl substance in the cytoplasm of neurons, more abundant at the epicenter of animals transplanted with MALS respect to LES. Scale bar: 100 µm. The picture is representative of labeling performed in two different sections (n = 4 mice; 2 sections/mouse for each condition).
Figure 8
Figure 8
Spinal cords engrafted with MALS show neuronal presence at lesion site. The epicenter of the lesion and the surrounding areas (2 mm rostral and 2 mm caudal) were evaluated for the presence of neuronal markers expression beta-tub III. It is possible to appreciate beta-tub III positive cells in the analyzed regions. Scale bars: 100 and 50 µm. (n = 4 mice; 2 sections/mouse; 3 field/section).
Figure 9
Figure 9
In vivo axonal transport recovery. (A) Qualitative images of anterograde axonal transport 35 days after contusion in lesioned non-treated animals (LES), or lesioned animals treated with LS and MALS. As described in Materials and Methods, Fluoro-Ruby was injected at T6/T7 25 days after lesioning and animal sacrificed 10 days later. Schematic reconstruction of spinal cord longitudinal sections of lesioned, lesioned + LS, and lesioned + MALS treated animals. Nuclei were stained with DAPI (blue). (B) The graph shows the quantification of fluorescence 2 mm rostral and caudal to the lesion and at the epicenter of the lesion. Quantification was performed in three animals per group 35 days after lesion. Statistical differences were determined by means of one-way ANOVA test followed by Bonferroni’s post-test. *** p < 0.001 vs. LES; ### p < 0.001 vs. LS.
Figure 10
Figure 10
Glial scarring at the lesion site. The epicenter of the lesion and the surrounding areas (2 mm rostral and 2 mm caudal) were evaluated for the presence of GFAP. This indicates an ongoing scarring process. Scale bar: 100 and 50 µm. (n = 4 mice; 2 sections/mouse; 3 fields/section).
Figure 11
Figure 11
Synergistic interaction between MALS tissue and surrounding spinal cord microenvironment. The contact area between the lesion site and the MALS tissue shows positivity for two neuronal markers: Map2 and beta-tubulin III. Scale bar 100 µm. (n = 4 mice; 2 sections/mouse; 3 fields/section).
Figure 12
Figure 12
Engraftment of the LS and MALS tissue in the spinal cord-lesioned area. The images show the presence of adiponectin (red), a hormone typically produced by the adipose tissue. The staining was performed at the lesion epicenter and 2 mm caudal and rostral to the lesion site of animals transplanted with LS and MALS tissues. Scale bar: 100 µm. The graph reports the percentage of cells positive to the marker in the analyzed sections (please see schematic representation). Values represent the mean ± SD. We determined the statistical differences by means of ANOVA test followed by Bonferroni’s post-test * p < 0.05, *** p < 0.001 vs. LES; ## p < 0.01, ### p < 0.001 vs. LS.
Figure 13
Figure 13
Engraftment of the MALS tissue in the spinal cord-lesioned area. The images show the presence of leptin (green), hormone typically produced by the adipose tissue. The staining was performed at the lesion epicenter and 2 mm caudal and rostral to the lesion site of animals transplanted with LS and MALS tissue. Scale bar: 100 µm. The graph reports the percentage of cells positive to the marker 2 mm rostral or caudal to the lesion epicenter (please see schematic representation). Values represent mean ± SD. We determined the statistical differences by means of ANOVA test followed by Bonferroni’s post-test. * p < 0.05, *** p < 0.001 vs. LES; ## p < 0.01, ### p < 0.001 vs. LS.

References

    1. Xu P., Yang X. The Efficacy and Safety of Mesenchymal Stem Cell Transplantation for Spinal Cord Injury Patients: A Meta-Analysis and Systematic Review. Cell Transplant. 2018:963689718808471. doi: 10.1177/0963689718808471. - DOI - PMC - PubMed
    1. Sekhon L.H., Fehlings M.G. Epidemiology, demographics, and pathophysiology of acute spinal cord injury. Spine (Phila Pa 1976) 2001;26:S2–S12. doi: 10.1097/00007632-200112151-00002. - DOI - PubMed
    1. Fehlings M.G., Cadotte D.W., Fehlings L.N. A series of systematic reviews on the treatment of acute spinal cord injury: A foundation for best medical practice. J Neurotrauma. 2011;28:1329–1333. doi: 10.1089/neu.2011.1955. - DOI - PMC - PubMed
    1. White B.A.B., Dea N., Street J.T., Cheng C.L., Rivers C.S., Attabib N., Kwon B.K., Fisher C.G., Dvorak M.F. The Economic Burden of Urinary Tract Infection and Pressure Ulceration in Acute Traumatic Spinal Cord Injury Admissions: Evidence for Comparative Economics and Decision Analytics from a Matched Case-Control Study. J. Neurotrauma. 2017;34:2892–2900. doi: 10.1089/neu.2016.4934. - DOI - PubMed
    1. Wyndaele M., Wyndaele J.J. Incidence, prevalence and epidemiology of spinal cord injury: What learns a worldwide literature survey? Spinal Cord. 2006;44:523–529. doi: 10.1038/sj.sc.3101893. - DOI - PubMed

Publication types