. 2017 Oct 24;9(10):547.
doi: 10.3390/polym9100547.

Deformation-Induced Phase Transitions in iPP Polymorphs

Affiliations

Deformation-Induced Phase Transitions in iPP Polymorphs

Harm J M Caelers et al. Polymers (Basel). .

Abstract

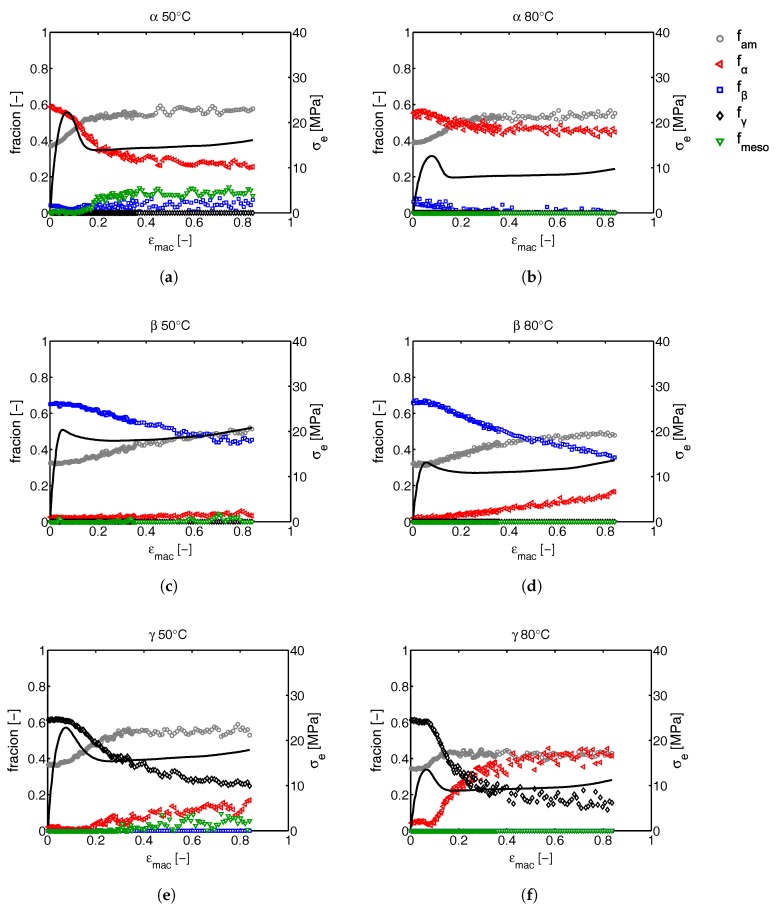
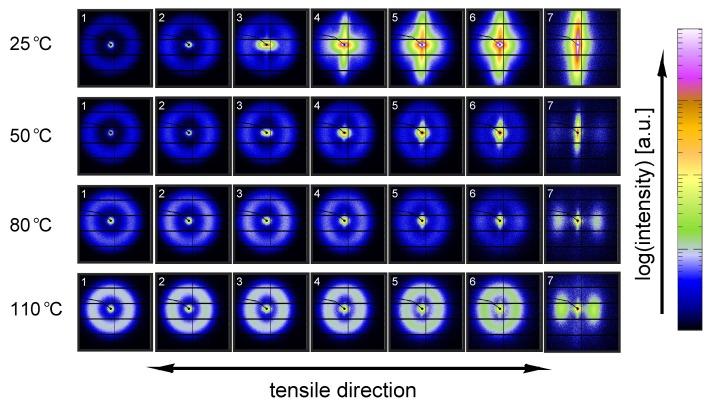
This detailed study reveals the relation between structural evolution and the mechanical response of α -, β - and γ -iPP. Uni-axial compression experiments, combined with in situ WAXD measurements, allowed for the identification of the evolution phenomena in terms of phase composition. Tensile experiments in combination with SAXS revealed orientation and voiding phenomena, as well as structural evolution in the thickness of the lamellae and amorphous layers. On the level of the crystallographic unit cell, the WAXD experiments provided insight into the early stages of deformation. Moreover, transitions in the crystal phases taking place in the larger deformation range and the orientation of crystal planes were monitored. At all stretching temperatures, the crystallinity decreases upon deformation, and depending on the temperature, different new structures are formed. Stretching at low temperatures leads to crystal destruction and the formation of the oriented mesophase, independent of the initial polymorph. At high temperatures, above T α c , all polymorphs transform into oriented α -iPP. Small quantities of the initial structures remain present in the material. The compression experiments, where localization phenomena are excluded, show that these transformations take place at similar strains for all polymorphs. For the post yield response, the strain hardening modulus is decisive for the mechanical behavior, as well as for the orientation of lamellae and the evolution of void fraction and dimensions. β -iPP shows by far the most intense voiding in the entire experimental temperature range. The macroscopic localization behavior and strain at which the transition from disk-like void shapes, oriented with the normal in tensile direction, into fibrillar structures takes place is directly correlated with the strain hardening modulus.

Keywords: cavitation; deformation; in situ X-ray; isotactic polypropylene; phase transitions; polymorphism; temperature; uniaxial compression; uniaxial tensile deformation.


Conflict of interest statement

The authors declare no conflict of interest. The founding sponsors had no role in the design of the study; in the collection, analyses or interpretation of data; in the writing of the manuscript; nor in the decision to publish the results.

Figures

Figure A1
Figure A1
The crystal phase fractions obtained from the WAXD experiments. In (a,c,e), we see the evolution of the crystallinity and phase fractions upon stretching at 50 °C. Figure (b,d,f) show the result of the tensile experiments performed at 80 °C. From top to bottom, we see α, β and γ-iPP.
Figure A2
Figure A2
Long period, amorphous layer thickness and lamellar thickness determined via Bragg’s law and the 1D autocorrelation function versus the macroscopic strain for α-iPP, elongated at 25, 50, 80 and 110 °C.
Figure A3
Figure A3
Long period, amorphous layer thickness and lamellar thickness determined via Bragg’s law and the 1D autocorrelation function versus the macroscopic strain for β-iPP, elongated at 25, 50, 80 and 110 °C.
Figure A4
Figure A4
Long period, amorphous layer thickness and lamellar thickness determined via Bragg’s law and the 1D autocorrelation function versus the macroscopic strain for γ-iPP, elongated at 25, 50, 80 and 110 °C.
Figure 1
Figure 1
Schematic of the pressure-temperature protocol, used to prepare γ-iPP samples.
Figure 2
Figure 2
Schematic representation of the compression setup, combined with in situ X-ray experiments.
Figure 3
Figure 3
Schematic representation of the tensile setup, combined with in situ X-ray experiments.
Figure 4
Figure 4
2D WAXD patterns of iPP, characteristic for (a) α-iPP; (b) β-iPP and (c) γ-iPP, as prepared for this study . The diffraction peak unique for α-iPP is the third clear one going from the center towards outside of the pattern. The same holds for γ-iPP, whereas the diffraction ring specific for β-iPP is the most clear one in the β pattern. All characteristic peaks are indicated in the figure.
Figure 5
Figure 5
(a) An example of a deconvoluted undeformed γ-iPP sample and (b) a deformed γ-iPP sample, stretched at 25 °C. The dashed black line is the amorphous halo, the dotted gray lines are the peak fittings, the solid gray line represents the mesophase and the solid black line is the sum of the fitted peaks. The red markers represent the radially integrated pattern obtained from the experiments.
Figure 6
Figure 6
Regions used for radial integration of the SAXS patterns.
Figure 7
Figure 7
(a) Example of a WAXD pattern measured with the Frelon detector. In the inset the WAXD pattern measured simultaneously with SAXS is put into the 2D WAXD pattern; (b) An example of a figure used to find the minimal difference between the two WAXD patterns. Numbers on the axes indicate the frame number.
Figure 8
Figure 8
(a,c,e) The engineering stress as a function of the apparent strain for α-, β- and γ-iPP tensile experiments respectively, stretched at different temperatures and a rate of 12 µm/s; (b,d,f) The true stress as a function of true strain, corresponding to figure (a,c,e). The thick solid lines are calculated for the assumption of uni-axial deformation and the thin lines for plane strain. The markers in the figures correspond to the 2D WAXD and SAXS images, shown in the following sections.
Figure 9
Figure 9
(a) True stress-true strain curves for α-, β- and γ-iPP. The results are obtained from uni-axial compression experiments at a strain rate of 103 s1 and a temperature of 23 °C on samples with a dimension of Ø6 × 6 mm2 (β- and γ-iPP) or Ø3 × 3 mm2 (α-iPP). The dashed lines are the true stress-true strain response obtained on thermally rejuvenated samples; (b) The corresponding Gaussian plots for α-, β- and γ-iPP. The dotted lines represent the strain hardening moduli Gr.
Figure 10
Figure 10
(a) The solid lines are the true stress as a function of the true strain obtained from uniaxial compression experiments on α-, β- and γ-iPP, measured at a strain rate of 103 s1 and a temperature of 110 °C on samples with a dimension of Ø6 × 6 mm2 (β- and γ-iPP) or Ø3 × 3 mm2 (α-iPP); (b) The corresponding Gaussian plots for α-, β- and γ-iPP. The dotted lines represent the strain hardening moduli Gr.
Figure 11
Figure 11
Normalized 2D WAXD patterns of α-iPP stretched at temperatures of 25, 50, 80 and 110 °C from top to bottom. The true strains, determined with the assumption of fully uni-axial deformation, are given as well. The macroscopic strains at which the patterns were taken are indicated by the markers in Figure 8. The stretching direction is horizontal.
Figure 12
Figure 12
Azimuthal spread of the (110) diffraction of α-iPP at various strains; (a) uni-axial stretching at 25 °C and (b) 110 °C. The numbers in the legend correspond to the 2D patterns in Figure 11.
Figure 13
Figure 13
Normalized 2D-patterns of β-iPP stretched at temperatures of 25, 50, 80 and 110 °C from top to bottom. The true strains, determined with the assumption of fully uni-axial deformation, are given as well. The macroscopic strains at which the patterns were taken are indicated by the markers in Figure 8. The stretching direction is horizontal.
Figure 14
Figure 14
Azimuthal spread of the (300) diffraction of β-iPP at various strains. (a) uni-axial stretching at 25 °C and (b) 110 °C. The numbers in the legend correspond to the 2D patterns in Figure 13.
Figure 15
Figure 15
Normalized 2D-patterns of γ-iPP stretched at temperatures of 25, 50, 80 and 110 °C from top to bottom. The true strains, determined with the assumption of fully uni-axial deformation, are given as well. The macroscopic strains at which the patterns were taken are indicated by the markers in Figure 8. The stretching direction is horizontal.
Figure 16
Figure 16
Azimuthal spread of the (111) diffraction of γ-iPP at various strains. (a) uni-axial stretching at 25 °C and (b) 110 °C. The numbers in the legend correspond to the 2D patterns in Figure 15.
Figure 17
Figure 17
The integrated intensity as a function of the scattering vector q. From (ac) we see the evolution of the crystallinity upon stretching at 25 °C of the α-, β- and γ-iPP respectively. Similar results, obtained from stretching experiments performed at 110 °C, are shown in (df). The structural evolution is given as a function of the true strain.
Figure 18
Figure 18
The crystal phase fractions obtained from the WAXD experiments. In (a,c,e) we see the evolution of the crystallinity and phase fractions upon stretching at 25 °C. Figure (b,d,f) show the result of the tensile experiments performed at 110 °C. From top to bottom we see α-, β- and γ-iPP. The solid lines are the macroscopic engineering stress as a function of the apparent macroscopic strain.
Figure 19
Figure 19
The increase of the distance between crystal planes of (a,b) α-iPP; (c,d) β-iPP and (e,f) γ-iPP. The strain at which the distance between the crystal planes no longer increases following the initial slope is associated with the onset of the plastic deformation. Figure (a,c,e) are obtained from tensile tests performed at 25 °C, while (b,d,f) are taken at 110 °C.
Figure 20
Figure 20
The crystal phase fractions obtained from the WAXD experiments. From top to bottom we see α-, β- and γ-iPP. From left to right we see the evolution of the crystallinity and phase fractions upon compressing at 25 and 110 °C. The true stress as a function of the true strain obtained at a true strain rate of 102 s1 is shown with the solid black lines.
Figure 21
Figure 21
Normalized 2D SAXS patterns of α-iPP stretched at temperatures of 25, 50, 80 and 110 °C from top to bottom. The true strains, determined with the assumption of fully uni-axial deformation, are given as well. The macroscopic strains at which the patterns were taken are indicated by the markers in Figure 8. The stretching direction is horizontal.
Figure 22
Figure 22
Azimuthal intensity of the lamellar scattering at various strains of α-iPP. (a) uni-axial stretching at 25 °C and (b) 110 °C. The numbers in the legend correspond to the 2D patterns in Figure 21.
Figure 23
Figure 23
Normalized 2D SAXS patterns of β-iPP stretched at temperatures of 25, 50, 80 and 110 °C from top to bottom. The true strains, determined with the assumption of fully uni-axial deformation, are given as well. The macroscopic strains at which the patterns were taken are indicated by the markers in Figure 8. The stretching direction is horizontal.
Figure 24
Figure 24
Azimuthal intensity of the lamellar scattering at various strains of β-iPP. (a) uni-axial stretching at 25 °C and (b) 110 °C. The numbers in the legend correspond to the 2D patterns in Figure 23.
Figure 25
Figure 25
Normalized 2D SAXS patterns of γ-iPP stretched at temperatures of 25, 50, 80 and 110 °C from top to bottom. The true strains, determined with the assumption of fully uni-axial deformation, are given as well. The macroscopic strains at which the patterns were taken are indicated by the markers in Figure 8. The stretching direction is horizontal.
Figure 26
Figure 26
Azimuthal intensity of the lamellar scattering at various strains of γ-iPP. (a) uni-axial stretching at 25 °C and (b) 110 °C. The numbers in the legend correspond to the 2D patterns in Figure 25.
Figure 27
Figure 27
Void volume fraction as a function of the macroscopic strain for α-iPP (a), β-iPP (b) and γ-iPP (c), elongated at 25, 50, 80 and 110 °C.
Figure 28
Figure 28
(a) Crystal phases in γ-iPP upon stretching at 110 °C; and (b), The evolution of the long period, lamellar thickness, and amorphous layer thickness.
Figure 29
Figure 29
Suggested deformation of a γ-crystal with the orthorhombic unit cell structure at a temperature of 110 °C. The newly formed lamellar crystal is comprised of a monoclinic alpha unit cell structure.

References

    1. Brückner S., Meille S., Petraccone V., Pirozzi B. Polymorphism in isotactic polypropylene. Prog. Polym. Sci. 1991;16:361–404. doi: 10.1016/0079-6700(91)90023-E. - DOI
    1. Lotz B., Wittmann J., Lovinger A. Structure and morphology of poly(propylenes): A molecular analysis. Polymer. 1996;37:4979–4992. doi: 10.1016/0032-3861(96)00370-9. - DOI
    1. De Rosa C., Auriemma F., Di Capua A., Resconi L., Guidotti S., Camurati I., Nifant’ev I., Laishevtsev I. Structure-property correlations in polypropylene from metallocene catalysts: Stereodefective, regioregular isotactic polypropylene. J. Am. Chem. Soc. 2004;126:17040–17049. doi: 10.1021/ja045684f. - DOI - PubMed
    1. Varga J. β-modification of isotactic polypropylene: Preparation, structure, processing, properties, and application. J. Macromol. Sci. Phys. 2002;41:1121–1171. doi: 10.1081/MB-120013089. - DOI
    1. Roozemond P., Van Erp T., Peters G. Flow-induced crystallization of isotactic polypropylene: Modeling formation of multiple crystal phases and morphologies. Polymer. 2016;89:69–80. doi: 10.1016/j.polymer.2016.01.032. - DOI

LinkOut - more resources