

Low-Dose Anti-Thymocyte Globulin Preserves C-Peptide, Reduces HbA1c, and Increases Regulatory to Conventional T-Cell Ratios in New-Onset Type 1 Diabetes: Two-Year Clinical Trial Data
- PMID: 30967424
- PMCID: PMC6610026
- DOI: 10.2337/db19-0057
Low-Dose Anti-Thymocyte Globulin Preserves C-Peptide, Reduces HbA1c, and Increases Regulatory to Conventional T-Cell Ratios in New-Onset Type 1 Diabetes: Two-Year Clinical Trial Data
Abstract
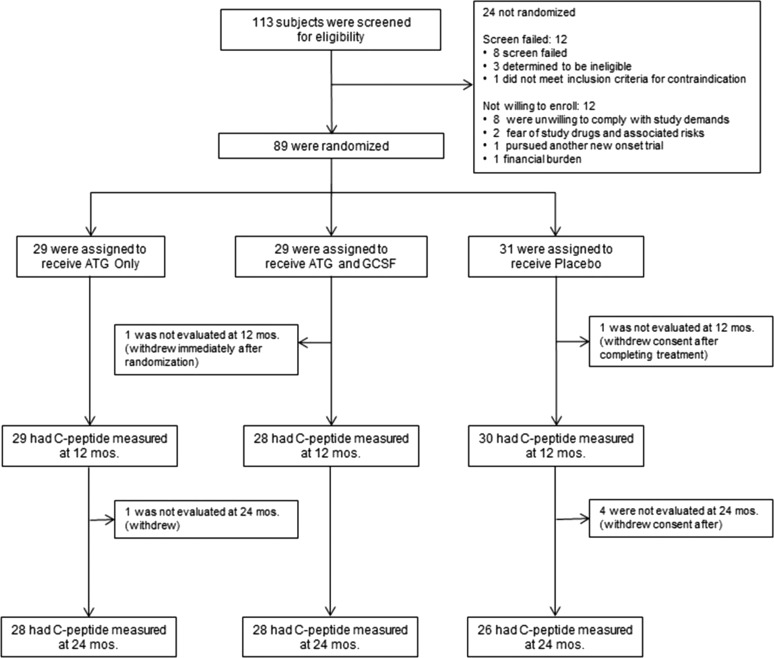
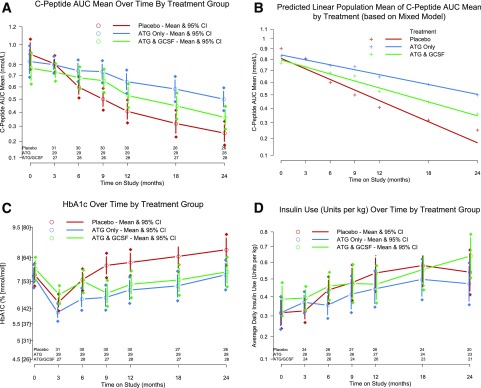
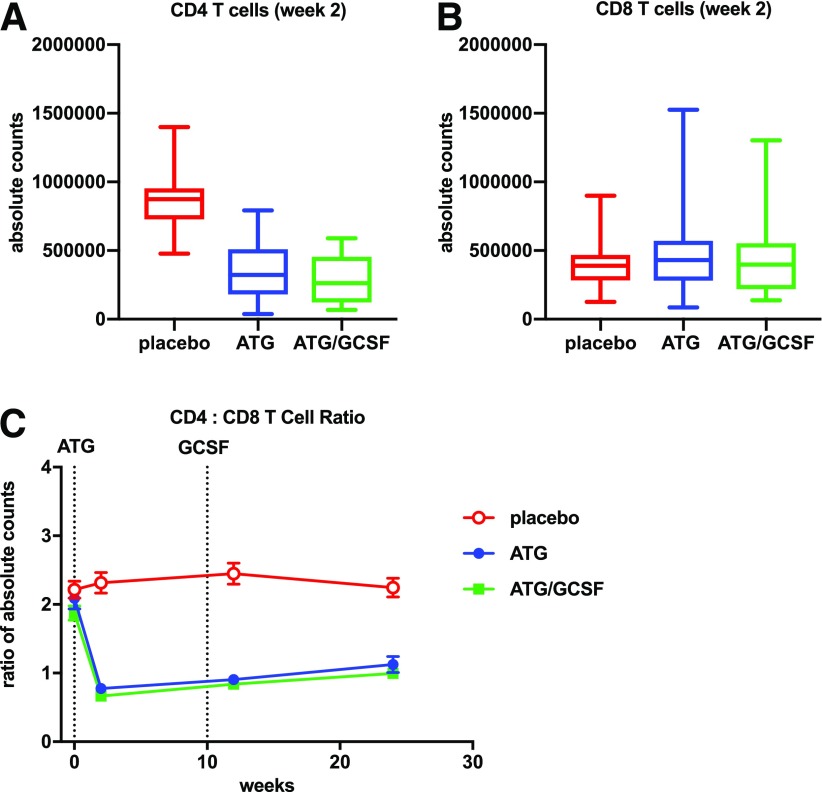
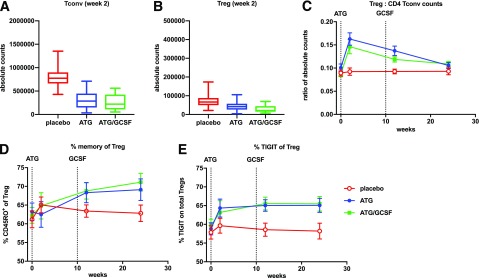
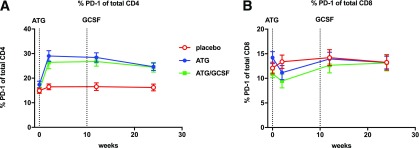
A three-arm, randomized, double-masked, placebo-controlled phase 2b trial performed by the Type 1 Diabetes TrialNet Study Group previously demonstrated that low-dose anti-thymocyte globulin (ATG) (2.5 mg/kg) preserved β-cell function and reduced HbA1c for 1 year in new-onset type 1 diabetes. Subjects (N = 89) were randomized to 1) ATG and pegylated granulocyte colony-stimulating factor (GCSF), 2) ATG alone, or 3) placebo. Herein, we report 2-year area under the curve (AUC) C-peptide and HbA1c, prespecified secondary end points, and potential immunologic correlates. The 2-year mean mixed-meal tolerance test-stimulated AUC C-peptide, analyzed by ANCOVA adjusting for baseline C-peptide, age, and sex (n = 82) with significance defined as one-sided P < 0.025, was significantly higher in subjects treated with ATG versus placebo (P = 0.00005) but not ATG/GCSF versus placebo (P = 0.032). HbA1c was significantly reduced at 2 years in subjects treated with ATG (P = 0.011) and ATG/GCSF (P = 0.022) versus placebo. Flow cytometry analyses demonstrated reduced circulating CD4:CD8 ratio, increased regulatory T-cell:conventional CD4 T-cell ratios, and increased PD-1+CD4+ T cells following low-dose ATG and ATG/GCSF. Low-dose ATG partially preserved β-cell function and reduced HbA1c 2 years after therapy in new-onset type 1 diabetes. Future studies should determine whether low-dose ATG might prevent or delay the onset of type 1 diabetes.
Trial registration: ClinicalTrials.gov NCT02215200.
© 2019 by the American Diabetes Association.
Figures
References
-
- Silverstein J, Maclaren N, Riley W, Spillar R, Radjenovic D, Johnson S. Immunosuppression with azathioprine and prednisone in recent-onset insulin-dependent diabetes mellitus. N Engl J Med 1988;319:599–604 - PubMed
-
- Ludvigsson J, Krisky D, Casas R, et al. . GAD65 antigen therapy in recently diagnosed type 1 diabetes mellitus. N Engl J Med 2012;366:433–442 - PubMed
Publication types
MeSH terms
Substances
Associated data
Grants and funding
- U01 DK085476/DK/NIDDK NIH HHS/United States
- UL1 TR000445/TR/NCATS NIH HHS/United States
- U01 DK061010/DK/NIDDK NIH HHS/United States
- UL1 TR001857/TR/NCATS NIH HHS/United States
- U01 DK103266/DK/NIDDK NIH HHS/United States
- UC4 DK106993/DK/NIDDK NIH HHS/United States
- U01 DK107014/DK/NIDDK NIH HHS/United States
- UL1 TR001085/TR/NCATS NIH HHS/United States
- U01 DK061042/DK/NIDDK NIH HHS/United States
- U01 DK085509/DK/NIDDK NIH HHS/United States
- UL1 TR002243/TR/NCATS NIH HHS/United States
- UC4 DK117009/DK/NIDDK NIH HHS/United States
- P01 AI042288/AI/NIAID NIH HHS/United States
- UM1 AI109565/AI/NIAID NIH HHS/United States
- U01 DK085466/DK/NIDDK NIH HHS/United States
- UL1 TR001872/TR/NCATS NIH HHS/United States
- U01 DK103153/DK/NIDDK NIH HHS/United States
- U01 DK061058/DK/NIDDK NIH HHS/United States
- UL1 TR002529/TR/NCATS NIH HHS/United States
- UL1 TR001863/TR/NCATS NIH HHS/United States
- U01 DK106984/DK/NIDDK NIH HHS/United States
- UL1 TR000114/TR/NCATS NIH HHS/United States
- U01 DK085499/DK/NIDDK NIH HHS/United States
- UL1 TR001427/TR/NCATS NIH HHS/United States
- U01 DK103282/DK/NIDDK NIH HHS/United States
- U01 DK061034/DK/NIDDK NIH HHS/United States
- UL1 TR001082/TR/NCATS NIH HHS/United States
- U01 DK085461/DK/NIDDK NIH HHS/United States
- UC4 DK097835/DK/NIDDK NIH HHS/United States
- U01 DK085465/DK/NIDDK NIH HHS/United States
- P30 DK017047/DK/NIDDK NIH HHS/United States
- UL1 TR003142/TR/NCATS NIH HHS/United States
LinkOut - more resources
Full Text Sources
Medical
Research Materials
Miscellaneous
