. 2019 Apr 9;10(1):1626.
doi: 10.1038/s41467-019-09586-z.

Global identification of functional microRNA-mRNA interactions in Drosophila

Affiliations

Global identification of functional microRNA-mRNA interactions in Drosophila

Hans-Hermann Wessels et al. Nat Commun. .

Abstract

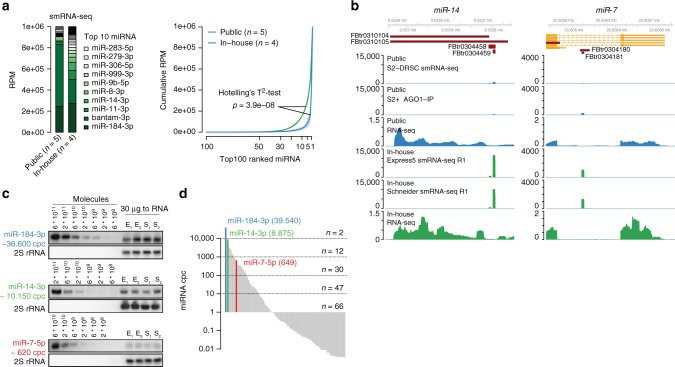
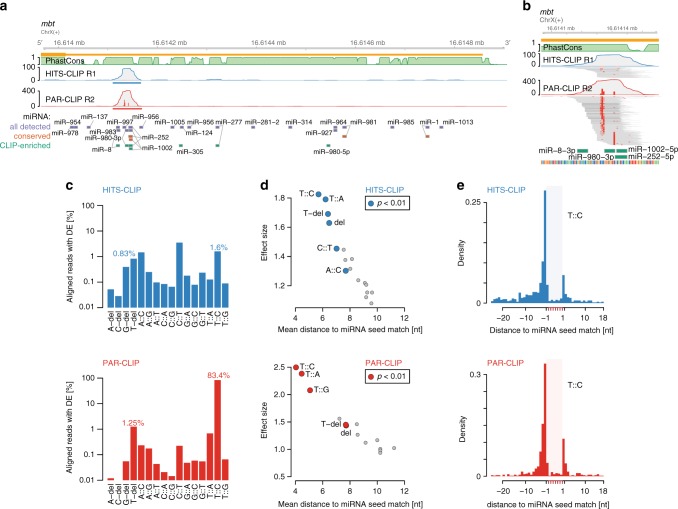
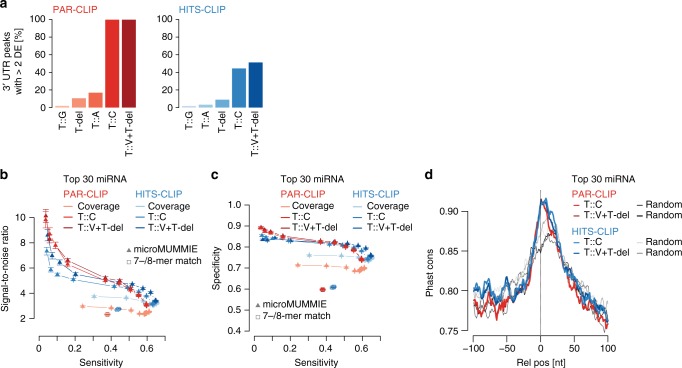
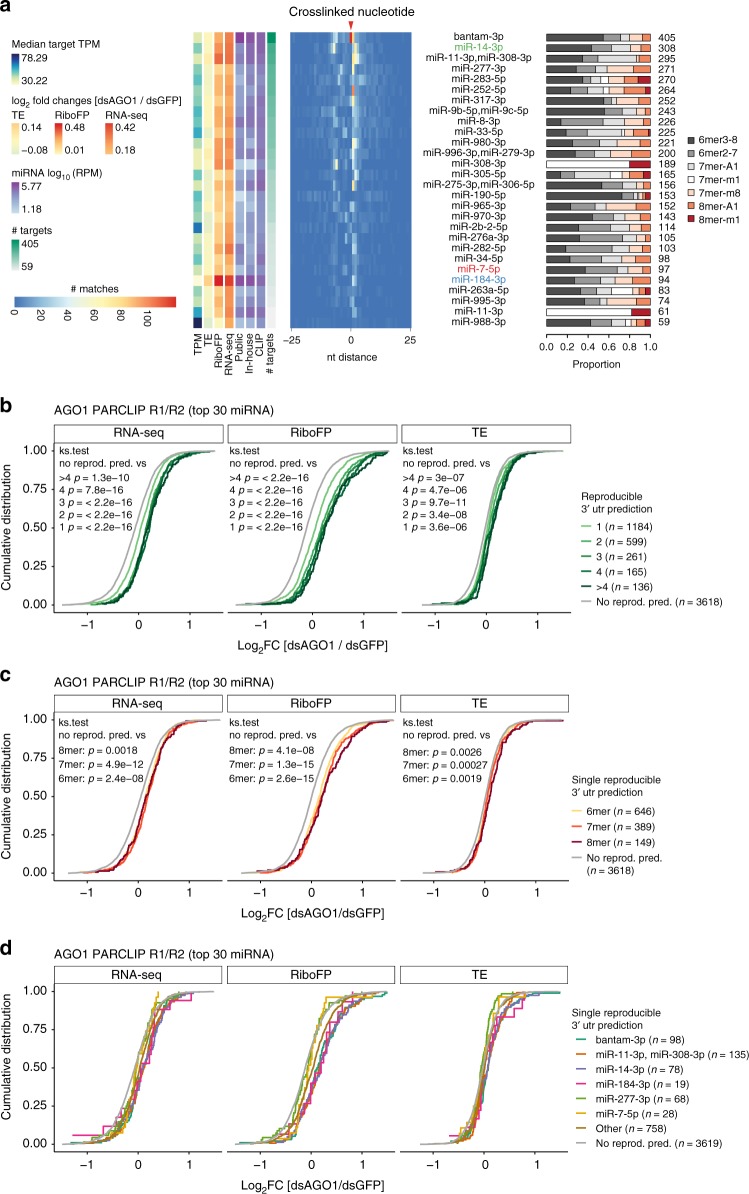
MicroRNAs (miRNAs) are key mediators of post-transcriptional gene expression silencing. So far, no comprehensive experimental annotation of functional miRNA target sites exists in Drosophila. Here, we generated a transcriptome-wide in vivo map of miRNA-mRNA interactions in Drosophila melanogaster, making use of single nucleotide resolution in Argonaute1 (AGO1) crosslinking and immunoprecipitation (CLIP) data. Absolute quantification of cellular miRNA levels presents the miRNA pool in Drosophila cell lines to be more diverse than previously reported. Benchmarking two CLIP approaches, we identify a similar predictive potential to unambiguously assign thousands of miRNA-mRNA pairs from AGO1 interaction data at unprecedented depth, achieving higher signal-to-noise ratios than with computational methods alone. Quantitative RNA-seq and sub-codon resolution ribosomal footprinting data upon AGO1 depletion enabled the determination of miRNA-mediated effects on target expression and translation. We thus provide the first comprehensive resource of miRNA target sites and their quantitative functional impact in Drosophila.


Conflict of interest statement

The authors declare no competing interests.

Figures

Fig. 1
Fig. 1
miRNA expression in Drosophila S2 cells is more complex than previously reported. a miRNA quantification in publicly available and in-house smRNA-seq samples. miRNA annotated reads were normalized to reads per million (RPM). (Left) Barplot representing the mean RPM across replicates and sorted by in-house RPM. (Right) Cumulative miRNA RPM distribution of top 100 detected and RPM-ranked miRNAs. The solid line represents the mean across libraries, shades represent the standard deviation (Supplementary Data 1). b Genome browser shot showing miR-14 and miR-7 reads and their respective RNA-seq coverage at miRNA loci of representative libraries normalized to total library size. Two S2 cell sub-clones have been used for new small RNA sequencing, denoted as Express5 and Schneider, respectively. c Quantitative miRNA northern blot for miR-184-3p, miR-14-3p, and miR-7-5p, including their experimentally determined cpc. 2S rRNA served as a loading control for total RNA samples. Source data are provided as a Source Data file. d Ranked distribution of fitted cpc values (Supplementary Data 1). Y-axis is in log10-scale.
Fig. 2
Fig. 2
AGO1 HITS-CLIP and PAR-CLIP diagnostic event comparison. a Genome browser shot of the Drosophila gene mbt, depicting AGO1 HITS-CLIP (blue) and PAR-CLIP (red) coverage tracks along its 3′UTR as well as 27way PhastCons scores (green). Blue and red bars indicate IDR-selected peak calls. Below, 7mer and 8mer seed matches for all miRNA in TargetScan 6.2 (conserved and non-conserved families), conserved miRNA (predicted conserved targets), and top 59 CLIP-enriched miRNA (see Supplementary Figure 1A) are indicated (y-axis shows the number of detected CLIP reads). b Similar to (a), genome browser shot of HITS-CLIP and PAR-CLIP peak in mbt 3′UTR including alignments. Red squares in individual read alignments indicate T-to-C mismatches to the dm6 reference. Red bars within coverage tracks indicates the T-to-C conversion proportion at nucleotide resolution. Below, 7mer/8mer seed matches of CLIP-enriched miRNAs are indicated. c Percentages of diagnostic events relative to all uniquely aligning reads. d Results according to Supplementary Figure 2M. Scatterplot of mean distance to miRNA start (x-axis) relative to its effect size (y-axis). e T-to-C conversion example according to (d). Density of T-to-C conversion positional maxima relative to unique 7mer or 8mer matches in top 3000 IDR-selected 3′UTR peaks
Fig. 3
Fig. 3
microMUMMIE assigned miRNA seed matches on PAR-CLIP and HITS-CLIP. a Proportion of IDR-selected peaks forming clusters (≥2 DEs per 3′UTR peak) depending on individual or combined DEs. b SNR estimate for HITS-CLIP and PAR-CLIP-derived DE signal for miRNA seed match predictions given the top 30 CLIP-enriched miRNAs relative to 30 shuffled decoy miRNAs. In each case, the top 1500 clusters were used. The results are depicted as mean across 100 individual shuffling experiments, with error bars representing SEM. Individual triangles indicate changes in chosen microMUMMIE variance levels. Squares show basic 7mer-A1, 7mer-m8, or 8mer-A1 matches anywhere within clusters. X-axis depicts sensitivity. Coverage = inferred single nucleotide peak summit position. c Similar to (b), but depicting specificity vs. sensitivity. d UCSC 27way PhastCons scores relative to the inferred crosslinked nucleotides for Clusters with miRNA seed match (at microMUMMIE variance 0.01; viterbi mode) prediction or a random nucleotide within the same peak
Fig. 4
Fig. 4
Functional evaluation of canonical miRNA seed match predictions. a Heatmap showing positional miRNA prediction prevalence relative to the identified crosslinked nucleotide for the top 30 CLIP-enriched miRNAs within PARalyzer-derived 3′UTR clusters. Only miRNA seed match prediction reproducible in both AGO1 PAR-CLIP replicates were considered (Supplementary Data 10). miRNAs are ranked by the number of predicted targets. The proportion of seed match types is shown on the right. On the left, the medians of steady state target expression levels (TPM), log2 fold changes of dsAGO1 vs. dsGFP treated samples for TE, RiboFP and RNA-seq are shown for all miRNA targeted genes (Supplementary Data 4), followed by the mean miRNA RPM expression levels in public and in-house smRNA-seq as well as CLIP data sets (Supplementary Data 1). Results shown were derived at microMUMMIE variance 0.01 using viterbi mode. b Cumulative distribution of RNA-seq, RiboFP and TE log2 fold changes for genes with 1, 2, 3, 4 or more than four reproducible miRNA seed match predictions relative to genes without reproducible predictions. P value was calculated in a two-sided Kolmogorov–Smirnov test versus genes without reproducible miRNA seed match predictions. c Similar as in (b) but isolating genes with exactly one reproducible miRNA seed match prediction stratified by 6mer, 7mer, or 8mer binding mode. d Similar as in (c) but depicting log2 fold changes for individual miRNAs (miR-184-3p, miR-14-3p, and miR-7-5p compared with three other miRNAs with the most miRNA predictions). RNA-seq, RiboFP, and TE log2 fold changes are available in Supplementary Data 4
Fig. 5
Fig. 5
miRNAs in S2 cells collectively target genes involved in development. a Overview of S2 miRNA targetome. The inset on the left shows the number of detected genes with unique (=1) to up to 13 reproducible 3′UTR miRNA binding sites. Upset plot showing all possible miRNA target overlaps with minimally four shared genes (n = 88 combination > = 4 genes). Barplot on the left indicates the number of all targets per miRNA. The barplot on top indicates the size of the unique target set. The largest target gene sets exist for individual miRNAs. The largest intersect for co-targeting miRNA has a size of nine targets. The sets are indicated by red dots, connected by red lines. b Biological process gene ontology (GOBP) enrichment for all miRNA targets (all miR: n = 2601), top decile of genes upregulated on mRNA level upon AGO1 depletion (mRNA), top decile of genes upregulated on ribosomal footprinting level upon AGO1 depletion (RiboFP), top decile of genes upregulated on translational efficiency level upon AGO1 depletion (TE; each n = 597), and all individual miRNA target sets, relative to all genes considered during functional analysis previously (n = 5963). All significantly enriched (p < 0.001; Fisher’s exact test; n = 501) GO terms for all miRNA targets were selected, merged to the corresponding enrichments in all other sets, and row-wise clustered (distance = maximum, clustering function = ward) after p value −log10-transformation, resulting in two main clusters. miRNAs are sorted by the number of targets. We did not observe enriched GO terms for individual miRNA target sets, which were not already covered by enrichments in all miR (Supplementary Data 14). c Pair-wise GO-term similarities using GOSemSim, for the top 100 enriched GOBP terms given p < 0.001 (Fisher’s exact test), and clustered (distance = euclidean, clustering = ward)

Similar articles

Cited by

References

    1. Bartel DP. MicroRNAs: target recognition and regulatory functions. Cell. 2009;136:215–233. doi: 10.1016/j.cell.2009.01.002. - DOI - PMC - PubMed
    1. Agarwal V, Bell GW, Nam JW, Bartel DP. Predicting effective microRNA target sites in mammalian mRNAs. Elife. 2015;4:1–38. doi: 10.7554/eLife.05005. - DOI - PMC - PubMed
    1. Kim VN, Han J, Siomi MC. Biogenesis of small RNAs in animals. Nat. Rev. Mol. Cell Biol. 2009;10:126–139. doi: 10.1038/nrm2632. - DOI - PubMed
    1. Ha M, Kim VN. Regulation of microRNA biogenesis. Nat. Rev. Mol. Cell Biol. 2014;15:509–524. doi: 10.1038/nrm3838. - DOI - PubMed
    1. Brennecke J, Hipfner DR, Stark A, Russell RB, Cohen SM. bantam encodes a developmentally regulated microRNA that controls cell proliferation and regulates the proapoptotic gene hid in Drosophila. Cell. 2003;113:25–36. doi: 10.1016/S0092-8674(03)00231-9. - DOI - PubMed

Publication types

MeSH terms