. 2019 Apr 9;10(1):1644.
doi: 10.1038/s41467-019-09537-8.

The sponge microbiome within the greater coral reef microbial metacommunity

Affiliations

The sponge microbiome within the greater coral reef microbial metacommunity

Daniel F R Cleary et al. Nat Commun. .

Abstract

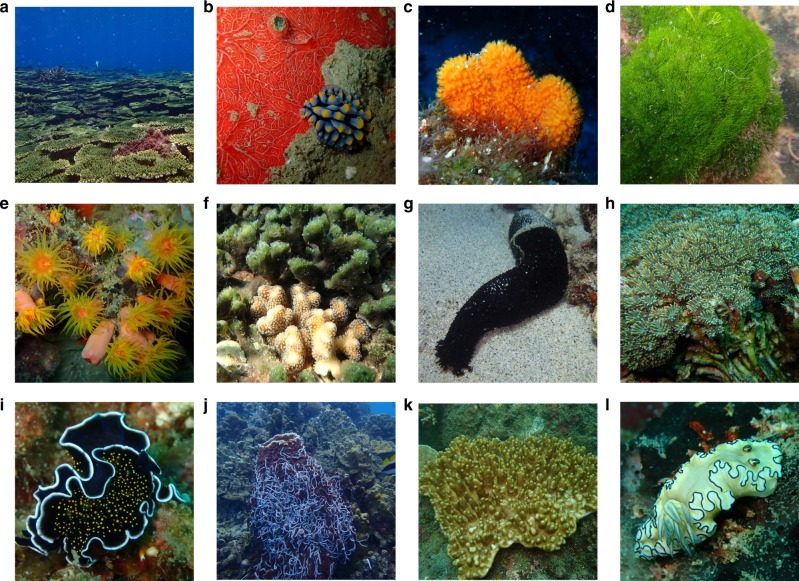
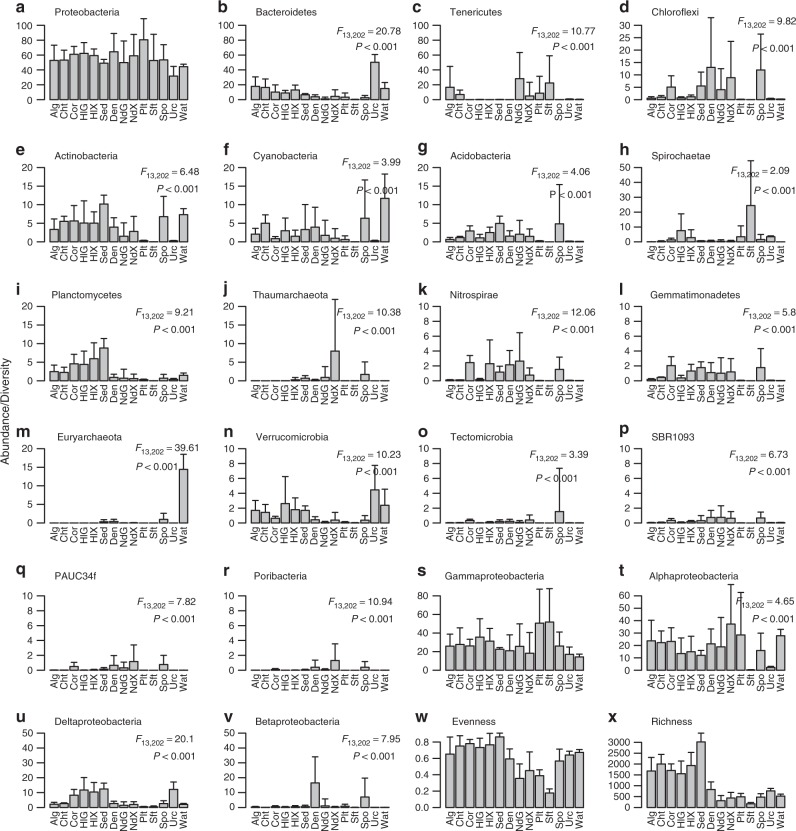
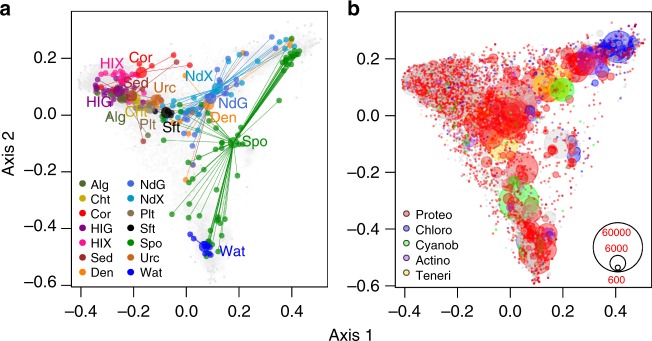
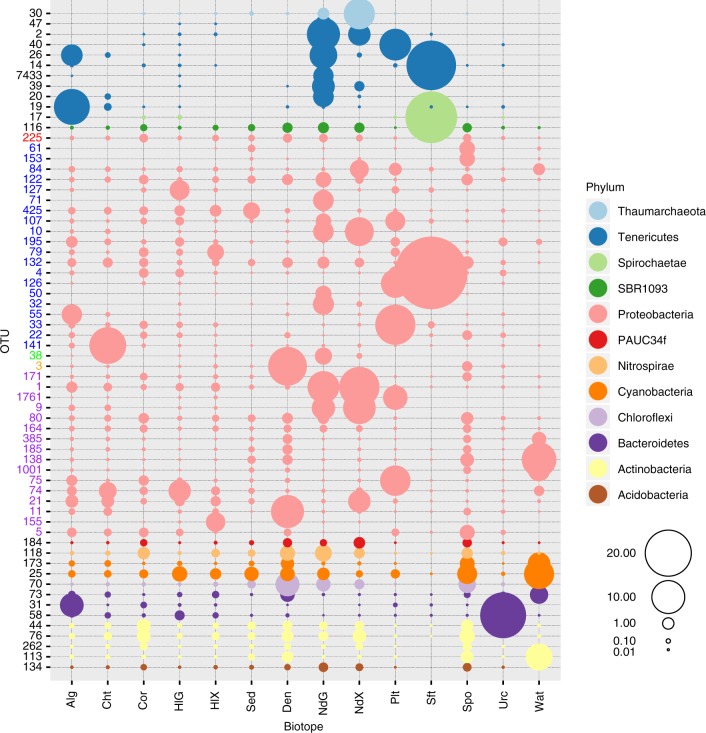
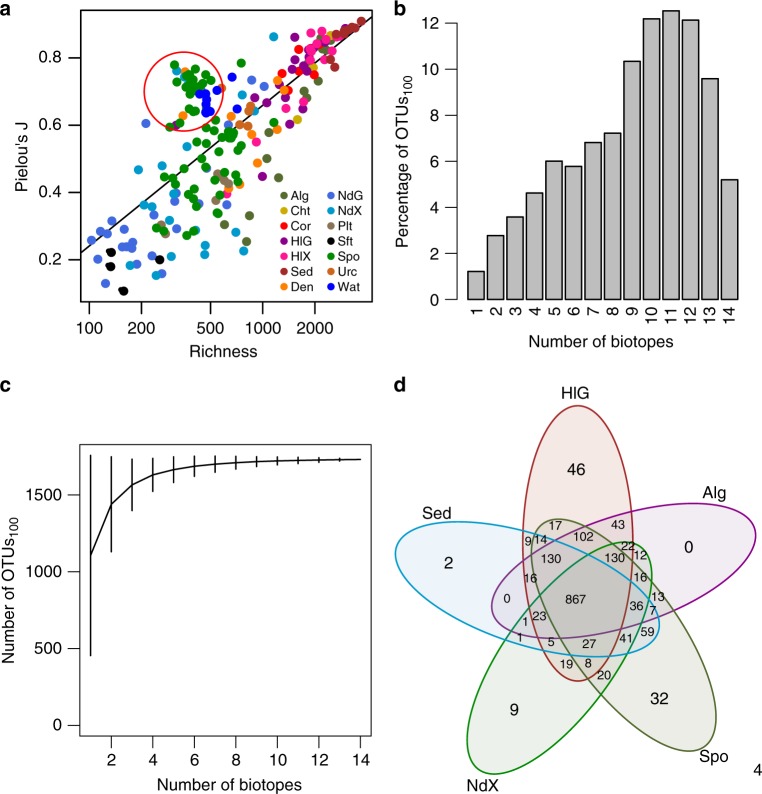
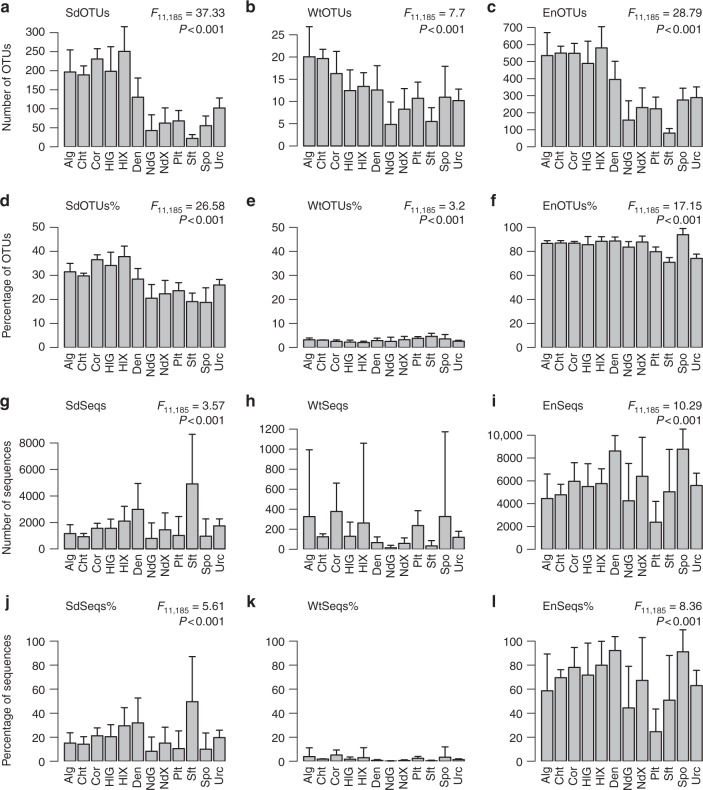
Much recent marine microbial research has focused on sponges, but very little is known about how the sponge microbiome fits in the greater coral reef microbial metacommunity. Here, we present an extensive survey of the prokaryote communities of a wide range of biotopes from Indo-Pacific coral reef environments. We find a large variation in operational taxonomic unit (OTU) richness, with algae, chitons, stony corals and sea cucumbers housing the most diverse prokaryote communities. These biotopes share a higher percentage and number of OTUs with sediment and are particularly enriched in members of the phylum Planctomycetes. Despite having lower OTU richness, sponges share the greatest percentage (>90%) of OTUs with >100 sequences with the environment (sediment and/or seawater) although there is considerable variation among sponge species. Our results, furthermore, highlight that prokaryote microorganisms are shared among multiple coral reef biotopes, and that, although compositionally distinct, the sponge prokaryote community does not appear to be as sponge-specific as previously thought.


Conflict of interest statement

The authors declare no competing interests.

Figures

Fig. 1
Fig. 1
Pictures of sampling sites and organisms sampled during the present study. a Coral reef in the southern Penghu islands, Taiwan, b the nudibranch Phyllidia cf. coelestis, c the sponge Ptilocaulis spiculifer, d the green alga Chlorodesmis fastigiata in shallow water, e the sun coral Tubastraea coccinea, f the green sponge Haliclona cymaeformis, g the sea cucumber Holothuria leucospilota, h the stony coral Galaxea astreata, i the spotted flatworm Thysanozoon nigropapillosum, j the barrel sponge Xestospongia testudinaria covered by sea cucumbers (Synaptula sp.), k the soft coral Cladiella sp. and l the nudibranch Doriprismatica atromarginata. All photographs were taken by D.F.R. Cleary or N.J. de Voogd
Fig. 2
Fig. 2
Mean relative abundance of the most abundant phyla, proteobacterial classes, OTU richness and evenness. Error bars represent a single standard deviation. a Proteobacteria, b Bacteroidetes, c Tenericutes, d Chloroflexi, e Actinobacteria, f Cyanobacteria, g Acidobacteria, h Spirochaetae, i Planctomycetes, j Thaumarchaeota, k Nitrospirae, l Gemmatimonadetes, m Euryarchaeota, n Verrucomicrobia, o Tectomicrobia, p SBR1093, q PAUC34f, r Poribacteria, s Gammaproteobacteria, t Alphaproteobacteria, u Deltaproteobacteria, v Betaproteobacteria and diversity components, w Evenness and x Richness in the following biotopes: algae (Alg), chitons (Cht), stony corals (Cor), sea cucumber gut (HlG), sea cucumber mantle (HlX), sediment (Sed), sponge denizens (Den), nudibranch gut (NdG), nudibranch mantle (NdX), flatworms (Plt), soft corals (Sft), sponges (Spo), sea urchins (Urc) and seawater (Wat). When significant (P < 0.0023; Bonferroni corrected α value), results of the GLM analyses are presented in the top right of the subfigures. Source data are provided as a Source Data file
Fig. 3
Fig. 3
Ordination showing the first two axes of the PCO analysis. a Symbols represent samples of algae (Alg), chitons (Cht), stony corals (Cor), sea cucumber gut (HlG), sea cucumber mantle (HlX), sediment (Sed), sponge denizens (Den), nudibranch gut (NdG), nudibranch mantle (NdX), flatworms (Plt), soft corals (Sft), sponges (Spo), sea urchins (Urc) and seawater (Wat). Samples from biotopes are connected to group centroids; the figure was produced using the ordispider function in the vegan package. b OTU symbols colour-coded according to their taxonomic assignment to selected phyla: Proteobacteria (Proteo), Chloroflexi (Chloro), Cyanobacteria (Cyanob), Actinobacteria (Actino) and Tenericutes (Teneri). The first two axes explain 22% of the variation in the data set. The circle size of the OTU is proportional to their abundance (number of sequences) as indicated by the symbol legend in the bottom right corner of b. Source data are provided as a Source Data file
Fig. 4
Fig. 4
Relative abundance of significantly discriminating OTUs (P < 0.001) identified using Simper. Symbols are colour-coded according to prokaryote phylum. Codes on the x-axis represent algae (Alg), chitons (Cht), stony corals (Cor), sea cucumber gut (HlG), sea cucumber mantle (HlX), sediment (Sed), sponge denizens (Den), nudibranch gut (NdG), nudibranch mantle (NdX), flatworms (Plt), soft corals (Sft), sponges (Spo), sea urchins (Urc) and seawater (Wat). The circle size of the OTU is proportional to the mean percentage of sequences per biotope as indicated by the symbol legend in the bottom right corner of the figure. The y-axis shows the OTU id number. The y-axis numbers have been colour coded for the proteobacterial OTUs to identify class assignment; red: JTB23, blue: Gammaproteobacteria, green: Epsilonproteobacteria, orange: Betaproteobacteria and purple: Alphaproteobacteria. Source data are provided as a Source Data file
Fig. 5
Fig. 5
Diversity components and distribution of OTUs among biotopes. a Relationship between richness and evenness. OTUs representing HMA sponges have been encircled in red. b Percentage of OTUs100 recorded in from 1 to 14 biotopes. For example, 1.2% of OTUs100 (21 OTUs100) were recorded in one biotope, 2.8% (48 OTUs100) in two biotopes, 3.6% (62 OTUs100) in three biotopes and 5.2% (90 OTUs100) in all 14 of the main biotopes. c Rarefied OTU richness (error bars represent 95% confidence intervals) as a function of the number of biotopes sampled and estimated using the specaccum function in vegan with the ‘method’ argument set to ‘random’ and 999 permutations. d Venn diagram, obtained using the vennCounts and vennDiagram functions of the limma package in R, showing the number of OTUs shared among the following five biotopes: algae (Alg), holothurian gut (HlG), sponges (Spo), sediment (Sed) and nudibranch mantle (NdX). Source data are provided as a Source Data file
Fig. 6
Fig. 6
Mean counts and percentages of sediment, seawater and environmental OTUs in selected hosts. Error bars represent a single standard deviation. Codes on the x-axis represent algae (Alg), chitons (Cht), stony corals (Cor), sea cucumber gut (HlG), sea cucumber mantle (HlX), sponge denizens (Den), nudibranch gut (NdG), nudibranch mantle (NdX), flatworms (Plt), soft corals (Sft), sponges (Spo) and sea urchins (Urc). a Number of OTUs100 shared with sediment only (SdOTUs), b number of OTUs100 shared with seawater only (WtOTUs), c number of OTUs100 shared with sediment and/or seawater (EnOTUs), d percentage of OTUs100 shared with sediment only (SdOTUs%), e percentage of OTUs100 shared with seawater only (WtOTUs%), f percentage of OTUs100 shared with sediment and/or seawater (EnOTUs%), g number of sequences shared with sediment only (SdSeqs), h number of sequences shared with seawater only (WtSeqs), i number of sequences shared with sediment and/or seawater only (EnSeqs), j percentage of sequences shared with sediment only (SdSeqs%), k percentage of sequences shared with seawater only (WtSeqs%) and l percentage of sequences shared with sediment and/or seawater (EnSeqs%). Results of the GLM analyses are presented in the top right of the subfigures when significant. Source data are provided as a Source Data file

Similar articles

Cited by

References

    1. Douglas AE. Symbiosis as a general principle in eukaryotic evolution. Cold Spring Harb. Perspect. Biol. 2014;6:a016113. doi: 10.1101/cshperspect.a016113. - DOI - PMC - PubMed
    1. Thomas T, et al. Diversity, structure and convergent evolution of the global sponge microbiome. Nat. Commun. 2016;7:11870. doi: 10.1038/ncomms11870. - DOI - PMC - PubMed
    1. Taylor MW, Radax R, Steger D, Wagner M. Sponge-associated microorganisms: evolution, ecology, and biotechnological potential. Microbiol. Mol. Biol. Rev. 2007;71:295–347. doi: 10.1128/MMBR.00040-06. - DOI - PMC - PubMed
    1. Hentschel U, Piel J, Degnan SM, Taylor MW. Genomic insights into the marine sponge microbiome. Nat. Rev. Microbiol. 2012;10:641–654. doi: 10.1038/nrmicro2839. - DOI - PubMed
    1. Hentschel U, et al. Molecular evidence for a uniform microbial community in sponges from different oceans. Appl. Environ. Microbiol. 2002;68:4431–4440. doi: 10.1128/AEM.68.9.4431-4440.2002. - DOI - PMC - PubMed

Publication types