. 2019 Apr 9;9(1):132.
doi: 10.1038/s41398-019-0465-y.

Deletion of Dtnbp1 in mice impairs threat memory consolidation and is associated with enhanced inhibitory drive in the amygdala

Affiliations

Deletion of Dtnbp1 in mice impairs threat memory consolidation and is associated with enhanced inhibitory drive in the amygdala

Cathy C Y Huang et al. Transl Psychiatry. .

Abstract

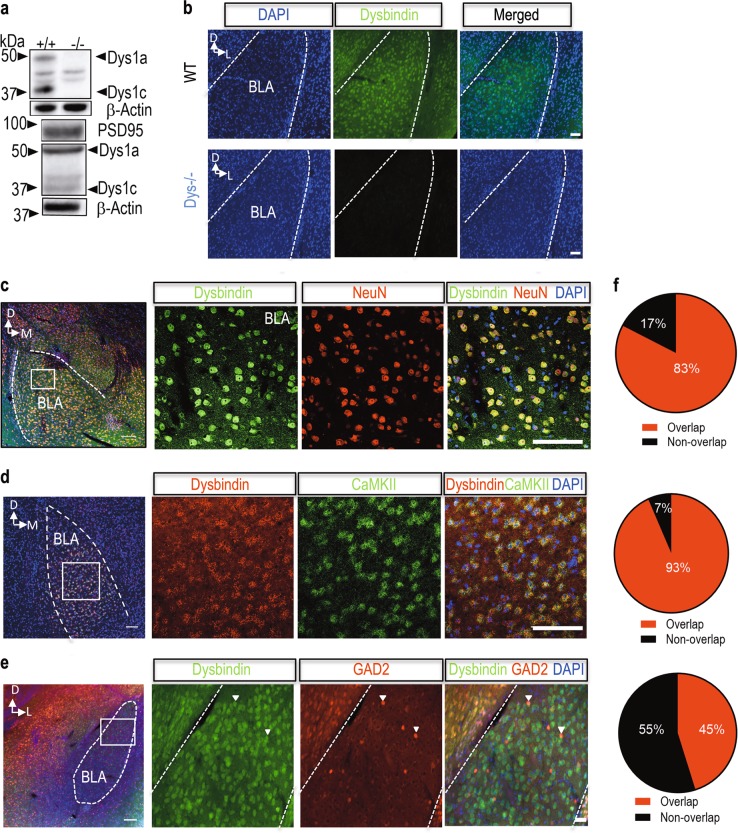
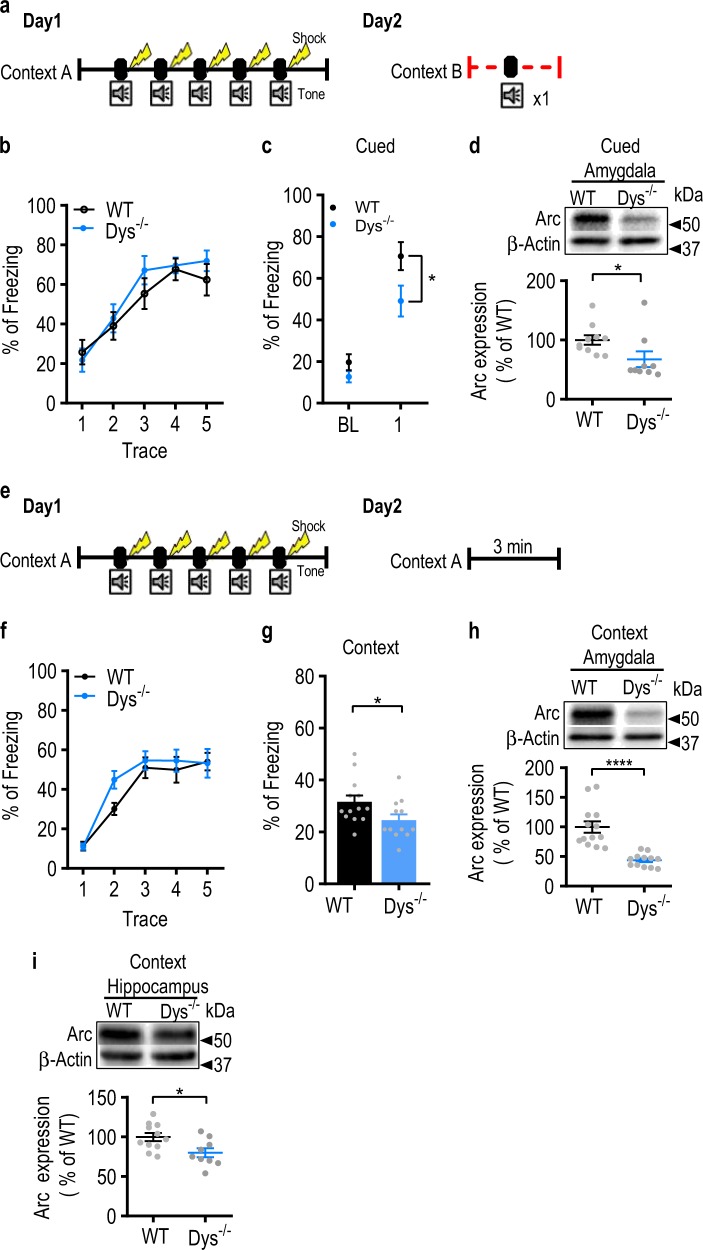
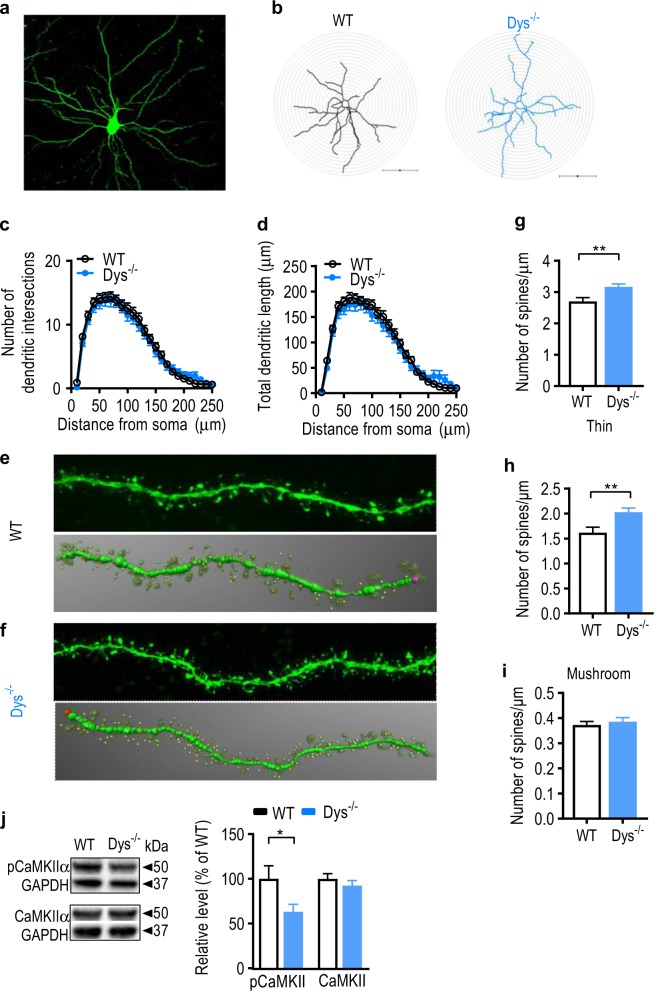
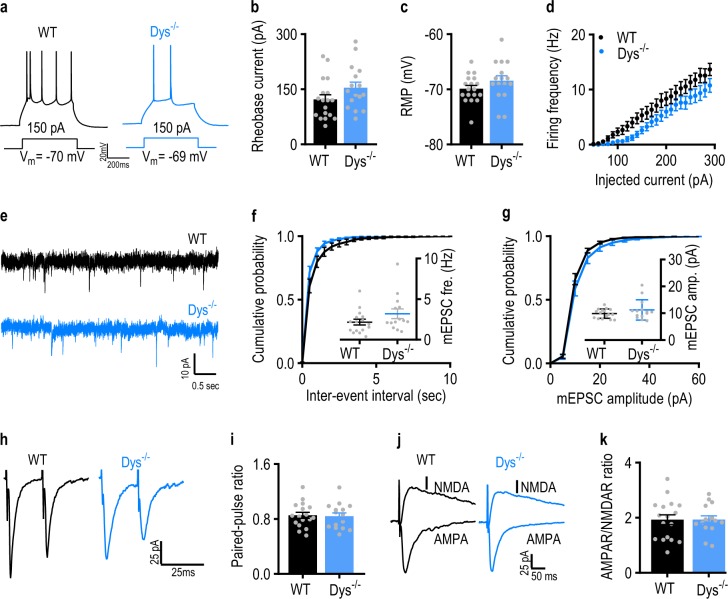
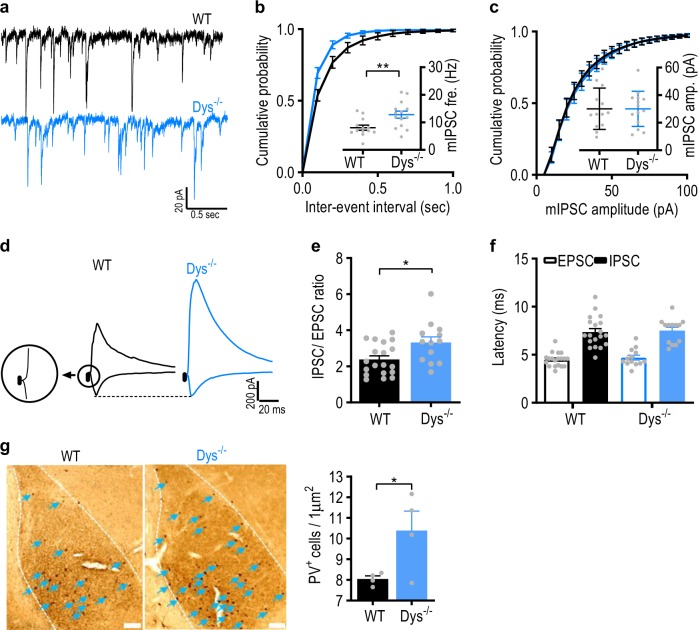
Schizophrenia is a severe and highly heritable disorder. Dystrobrevin-binding protein 1 (DTNBP1), also known as dysbindin-1, has been implicated in the pathophysiology of schizophrenia. Specifically, dysbindin-1 mRNA and protein expression are decreased in the brains of subjects with this disorder. Mice lacking dysbinidn-1 also display behavioral phenotypes similar to those observed in schizophrenic patients. However, it remains unknown whether deletion of dysbindin-1 impacts functions of the amygdala, a brain region that is critical for emotional processing, which is disrupted in patients with schizophrenia. Here, we show that dysbindin-1 is expressed in both excitatory and inhibitory neurons of the basolateral amygdala (BLA). Deletion of dysbindin-1 in male mice (Dys-/-) impaired cued and context-dependent threat memory, without changes in measures of anxiety. The behavioral deficits observed in Dys-/- mice were associated with perturbations in the BLA, including the enhancement of GABAergic inhibition of pyramidal neurons, increased numbers of parvalbumin interneurons, and morphological abnormalities of dendritic spines on pyramidal neurons. Our findings highlight an important role for dysbindin-1 in the regulation of amygdalar function and indicate that enhanced inhibition of BLA pyramidal neuron activity may contribute to the weakened threat memory expression observed in Dys-/- mice.


Conflict of interest statement

D.T.B. served as a consultant for LifeSci Capital. The remaining authors declare that they have no conflict of interest.

Figures

Fig. 1
Fig. 1. Dysbindin-1 is expressed in excitatory and inhibitory neurons of the amygdala.
a Top: representative western blots from the amygdala showing that the dysbindin-1 antibody is able to differentiate between Dys1a and Dys1c isoforms in wild-type (WT) mice. These bands are completely eliminated in samples from dysbindin-1 knockout (Dys−/−) mice. Bottom: representative western blot images of PSD95 and dysbindin-1 in synaptoneurosome fractions of amygdala from WT mice. b Representative images showing dysbindin-1 immunoreactivity in the BLA from a wild-type mouse (upper panels). No such immunoreactivity was detected in a Dys−/− mouse (lower panels) with images taken under the same settings as the WT mouse. c Representative image containing the basolateral (BLA) showing dual antigen immunofluorescence for dysbindin-1 (green), NeuN (red; pan-neuronal marker), and DAPI (blue). High-power images of the inset boxes in panel (c) showing dysbindin-1 co-localized with NeuN in BLA. d Representative image of the BLA showing mRNA expression of both dysbindin-1 (red) and CaMKIIα (green). High-power images from the inset box on the left showing dysbindin mRNA co-localized with the excitatory neuronal marker, CaMKIIα. e Representative image of the BLA showing dysbindin-1 protein (green) in the BLA of GAD2-T2a-NLS-mCherry reporter mice. High-power images from the inset box on the left. f Pie charts showing the percentage of overlap of dysbindin-1 with other cellular markers (c–e). ce Scale bar: 100 µm. b, f Scale bar: 50 µm
Fig. 2
Fig. 2. Dys−/− mice display impairments in conditioned threat memory.
a Schematic illustration of the trace-threat conditioning protocol. b Wild-type (WT; n = 10 mice; black circles) and dysbindin-1 knockout (Dys−/−; n = 9 mice; blue circles) mice were subjected to a trace threat-conditioning paradigm on day 1 in context A. The amount of freezing during each of the five trace intervals was measured for each group. c Twenty-four hours after threat conditioning, mice were placed in context B and presented a conditioning tone without foot-shock. Freezing was measured during the first 3 min (baseline; BL) and during the 20 s after tone presentation. d Arc protein was measured in the amygdala of WT (n = 10 mice; black) and Dys−/− (n = 9 mice; blue) 30 min after cue retrieval. e Schematic illustrating the trace-threat conditioning protocol for context retrieval. f WT (n = 13 mice; black circles) and Dys−/− (n = 12 mice; blue circles) mice were subjected to a trace threat conditioning paradigm on day 1 in context A. The amount of freezing during each of the five trace intervals was measured for each group. g Twenty-four hours after conditioning, mice were returned back to context A. The amount of freezing was measured for the first 3 min of the trial. h Arc protein was measured in the amygdala of WT (n = 11 mice; black) and Dys−/− (n = 9 mice; blue) 30 min after contextual retrieval. (i) Arc expression was measured in the hippocampus from WT (n = 11 mice; black) and Dys−/− (n = 9 mice; blue) mice. Asterisk (*) indicates significant differences from the WT group (p < 0.05). All values represent the mean ± SEM
Fig. 3
Fig. 3. Dendritic spine structure of basolateral amygdala pyramidal neurons is altered in Dys−/− mice.
a Representative image showing a pyramidal neuron filled with Lucifer yellow in the basolateral amygdala. b Representative reconstructions of injected BLA neurons from WT and Dys−/− mice that were used for morphologic analysis. The radius of concentric circles used for Sholl analysis was increased at 10 µm intervals from the soma. Scale bar: 100 µm. Sholl analysis was performed on reconstructed WT (black circles) and Dys−/− (blue circles) mice neurons to analyze dendritic complexity (c: intersections; d: total dendritic length at each interval). e Top: representative confocal image showing a dendritic segment of a filled BLA pyramidal WT neuron used for spine analysis. Bottom: the dendritic segment showed above was traced in 3D using reconstructions obtained from NeuronStudio to analyze spines. Thin spine: yellow color; mushroom spine: brown color. f Top: representative confocal image showing a dendritic segment of a filled BLA pyramidal Dys−/− neuron used for spine analysis. Bottom: the dendritic segment showed above was traced in 3D using reconstructions obtained from NeuroStudio to analyze spines. Average g total spine density, h thin spine density, i mushroom spine density was calculated for WT (open bars) and Dys−/− (blue bars) neurons. gi For spine analysis, 4–6 dendritic segments per neurons were analyzed. A total of 23 neurons from 4 WT mice and 22 neurons from 4 Dys−/− mice were included for all analyses. j Left: representative western blot images showing phosphorylated CaMKIIα (pCaMKIIα) and total CaMKIIα in the amygdala from WT and Dys−/− mice. Right: levels of pCaMKIIα and CaMKIIα were measured in the amygdala from WT (open bars; n = 10 mice) and Dys−/− mice (blue bars; n = 9 mice). *p < 0.05; **p < 0.01. All values represent the mean ± SEM
Fig. 4
Fig. 4. Neuronal excitability is decreased but basal excitatory synaptic transmission is normal in Dys−/− mice.
a Representative action potential traces recorded from the basolateral amygdala (BLA) of a WT (black) and a Dys−/− mouse (blue) in response to injected current. b Bar graphs showing the rheobase current in the BLA of WT (black bar; n = 18 cells, six mice) and Dys−/− (blue bar; n = 16 cells, six mice) mice. c Bar graphs showing the resting membrane potential (RMP) in WT (black bar; n = 18 cells, six mice) and Dys−/− (blue bar; n = 16 cells, six mice) mice. d The evoked firing frequency was lower in the BLA of Dys−/− (blue circles; n = 16 cells, six mice) compared to WT (black circles; n = 18 cells, six mice) mice. e Representative mEPSC traces recorded from the BLA of a WT (black) and Dys−/− mouse (blue). Cumulative probability plots for the distributions of the mEPSC (f) inter-event intervals and (g) amplitudes from WT (16 cells, six mice) and Dys−/− mice (n = 14 cells, six mice). Inset bar graphs summarize the respective average mEPSC (f) frequency and (g) amplitude. h Representative traces of EPSCs evoked by paired presynaptic stimuli with a 50-ms inter-stimulus interval recorded in a WT (left; black) and a Dys−/− mouse (right; blue). i Summary plot of paired-pulse ratio measurements for EPSCs recorded in the BLA evoked by thalamic input stimulation in WT (17 cells, four mice) and Dys−/− mice (n = 15 cells, 4 mice). j Representative traces of AMPA and NMDA receptor-mediated EPSCs recorded in the WT and Dys−/− groups. k Bar graph showing the ratio of AMPAR/NMDAR EPSC amplitude ratio in slices from WT (17 cells, four mice; black bars) and Dys−/− mice (n = 15 cells, four mice; blue bars). All values represent the mean ± SEM
Fig. 5
Fig. 5. Inhibitory synaptic transmission is enhanced and the number of PV-positive interneurons is increased in the BLA of Dys−/− mice.
a Representative mIPSC traces recorded in BLA neurons in slices from WT (black) and Dys−/− (blue) mice. b, c Cumulative probability plots for the distribution of the mIPSC (b) inter-event interval and (c) amplitude from WT (n = 13 cells, 7 mice) and Dys−/− mice (n = 14 cells, seven mice). Inset bar graphs summarize the respective mIPSC (b) frequency and (c) amplitude measurements. d Representative traces of EPSCs and IPSCs recorded at −70 or 0 mV, respectively, in the BLA of WT (black) and Dys−/− (blue) mice. The inset circle showing the EPSC had a shorter latency than the IPSC. e Bar graph summarizing the IPSC/EPSC ratio values calculated by dividing the amplitude of IPSC by the amplitude of EPSC from WT (n = 19 cells, five mice; black bar) and Dys−/− mice (n = 13 cells, three mice; blue bar). f Summary of the latencies of evoked-EPSCs (open bars) and IPSCs (filled bars) from WT (n = 19 cells, five mice) and Dys−/− mice (n = 13 cells, three mice). g Left: Representative images demonstrating PV-immunoreactive neurons in the BLA from a WT and Dys−/− mouse, respectively. Right: Summary graph showing PV+ cells in the BLA of WT (n = 4 mice; black bar) and Dys−/− (n = 4 mice; blue bar) mice. *p < 0.05. All values represent the mean ± SEM

Similar articles

Cited by

References

    1. Perala J, et al. Lifetime prevalence of psychotic and bipolar I disorders in a general population. Arch. Gen. Psychiatry. 2007;64:19–28. doi: 10.1001/archpsyc.64.1.19. - DOI - PubMed
    1. Talbot K, et al. Dysbindin-1 is reduced in intrinsic, glutamatergic terminals of the hippocampal formation in schizophrenia. J. Clin. Invest. 2004;113:1353–1363. doi: 10.1172/JCI200420425. - DOI - PMC - PubMed
    1. Talbot K, et al. Synaptic dysbindin-1 reductions in schizophrenia occur in an isoform-specific manner indicating their subsynaptic location. PLoS ONE. 2011;6:e16886. doi: 10.1371/journal.pone.0016886. - DOI - PMC - PubMed
    1. Tang J. Dysbindin-1 in dorsolateral prefrontal cortex of schizophrenia cases is reduced in an isoform-specific manner unrelated to dysbindin-1 mRNA expression. Hum. Mol. Genet. 2009;18:3851–3863. doi: 10.1093/hmg/ddp329. - DOI - PMC - PubMed
    1. Weickert CS, et al. Human dysbindin (DTNBP1) gene expression in normal brain and in schizophrenic prefrontal cortex and midbrain. Arch. Gen. Psychiatry. 2004;61:544–555. doi: 10.1001/archpsyc.61.6.544. - DOI - PubMed

Publication types