. 2019 Apr 9;10(1):1629.
doi: 10.1038/s41467-019-09549-4.

Influenza A virus ribonucleoproteins form liquid organelles at endoplasmic reticulum exit sites

Affiliations

Influenza A virus ribonucleoproteins form liquid organelles at endoplasmic reticulum exit sites

Marta Alenquer et al. Nat Commun. .

Abstract

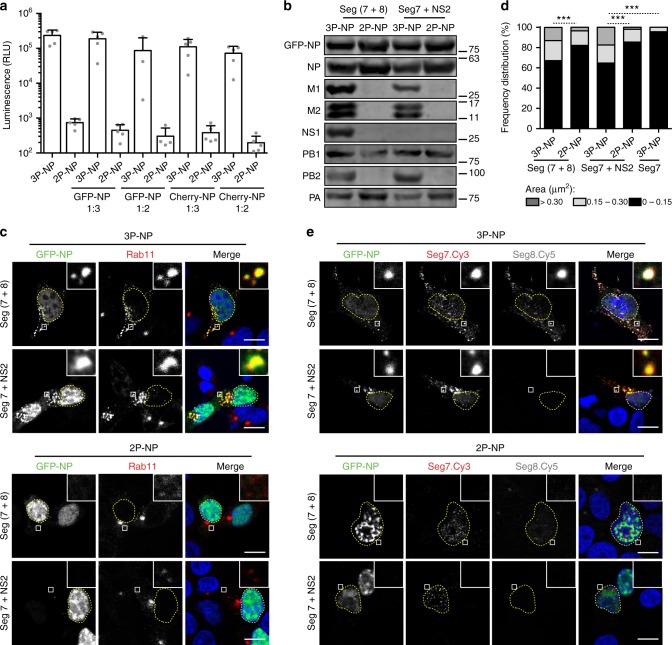
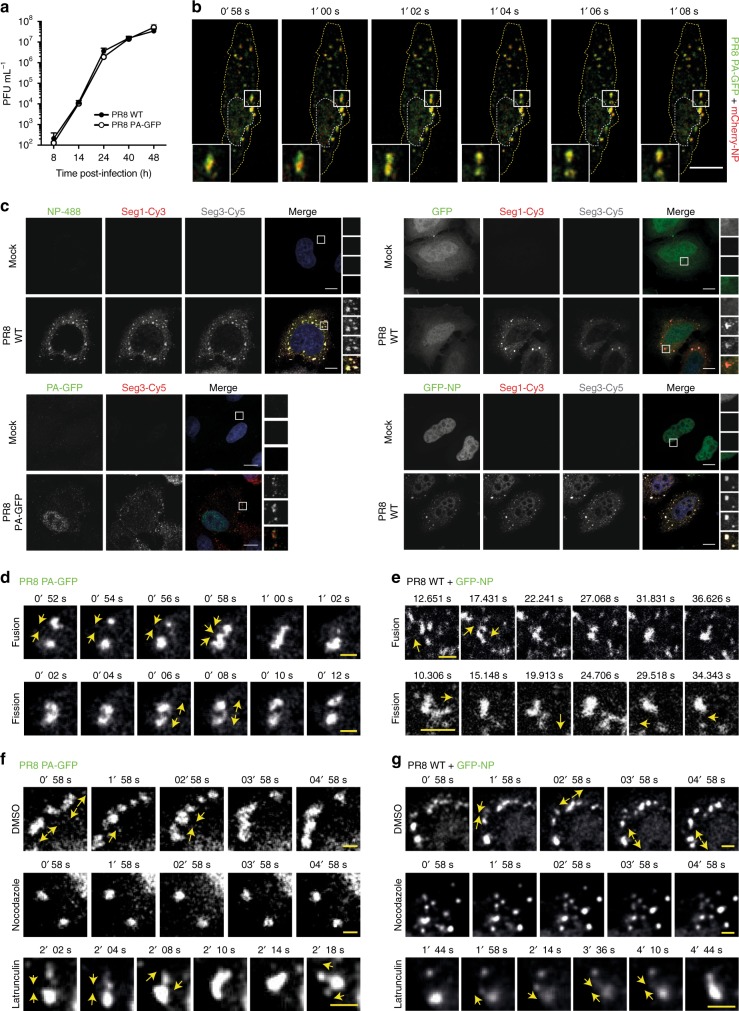
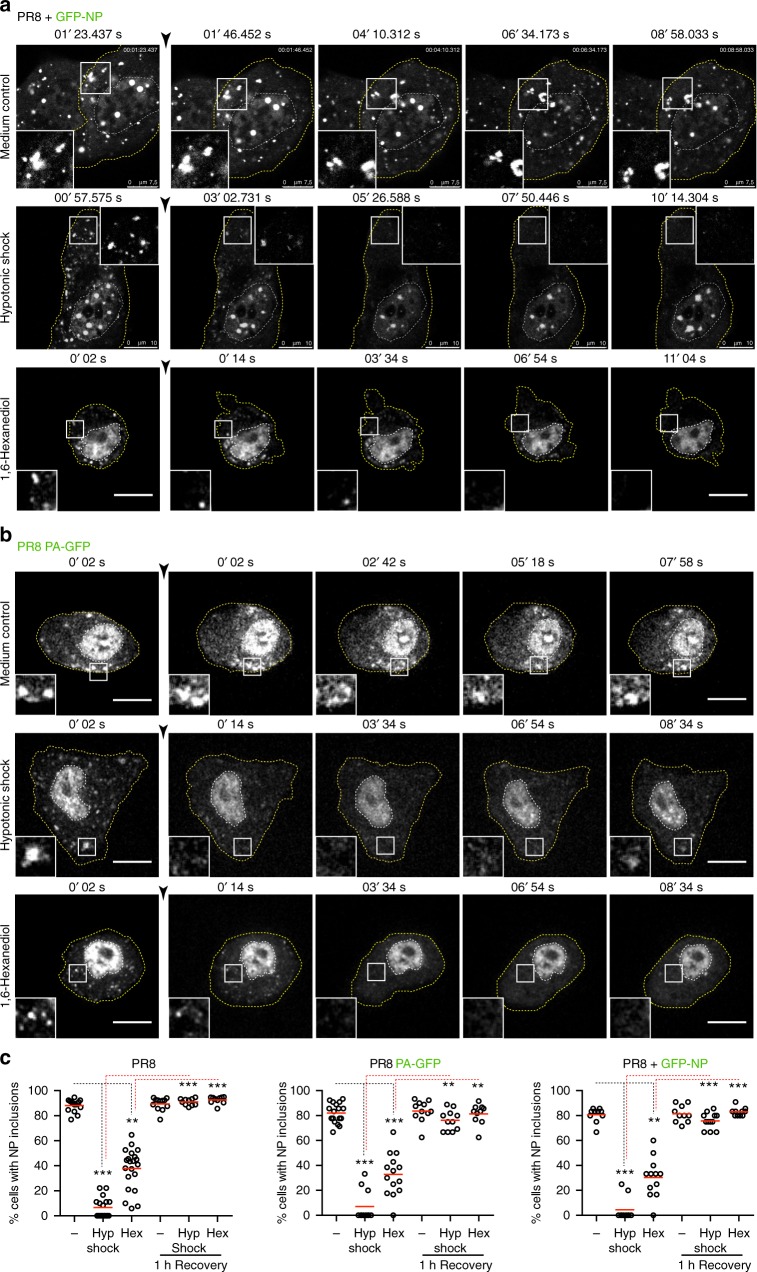
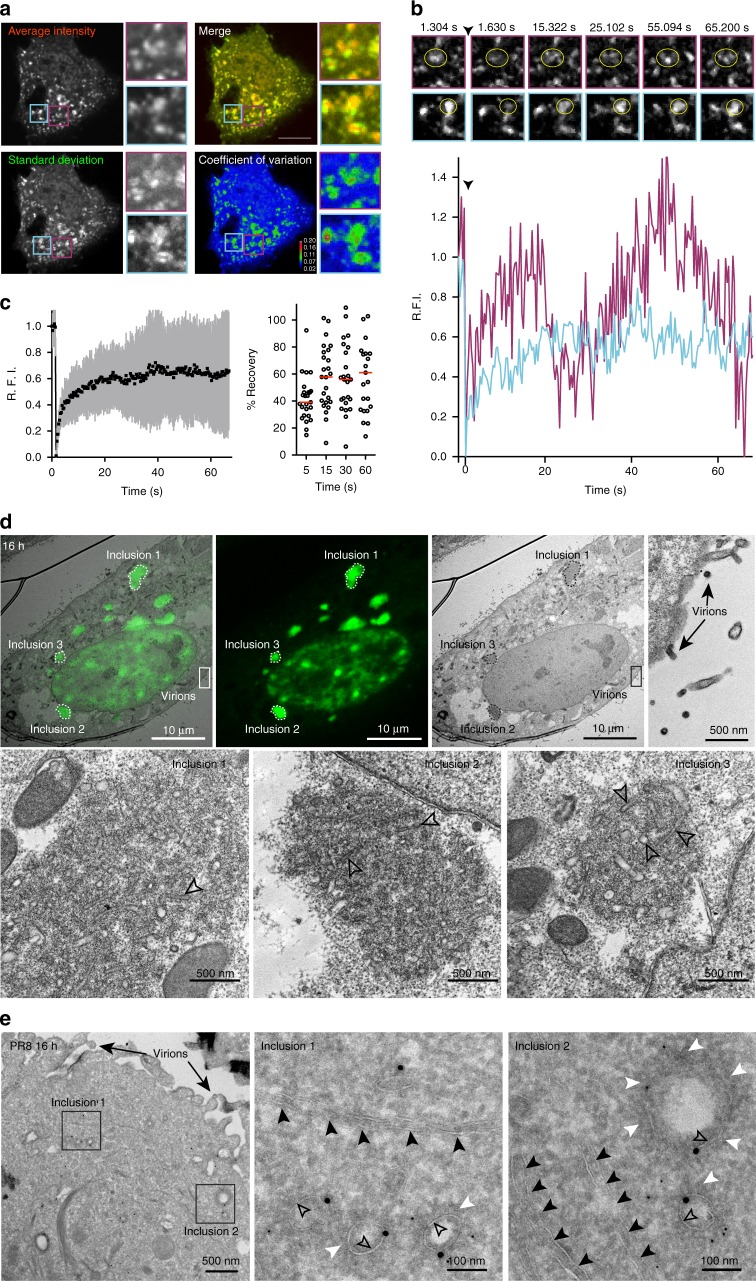
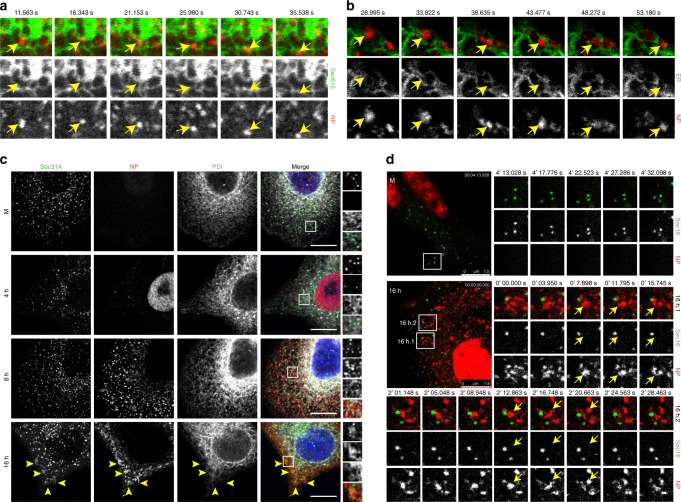
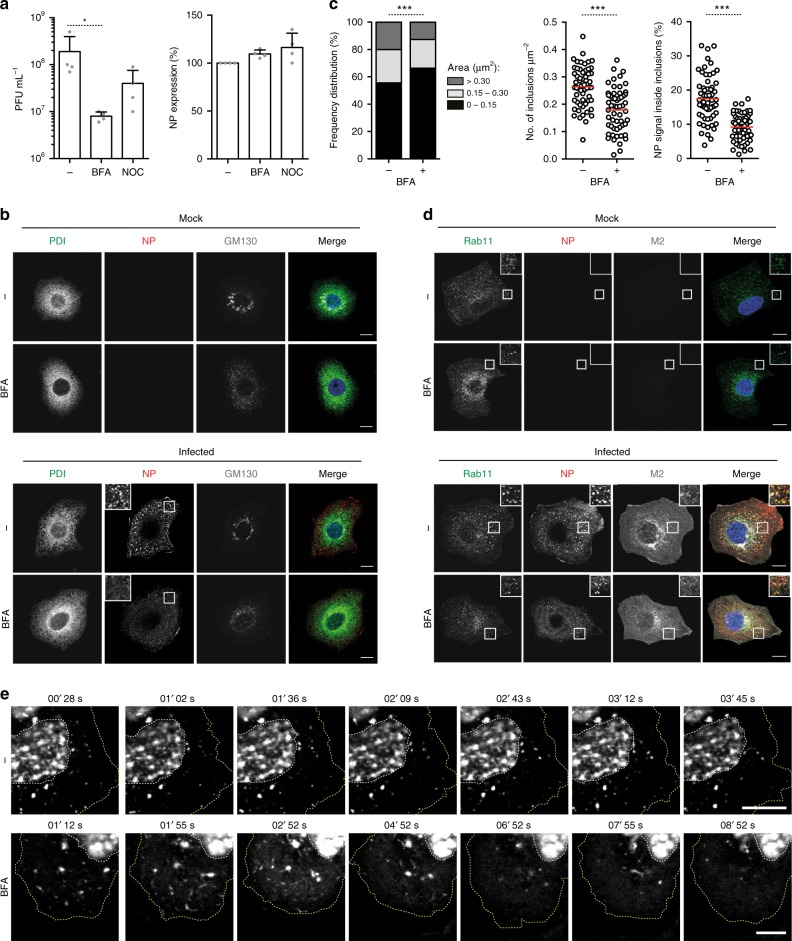
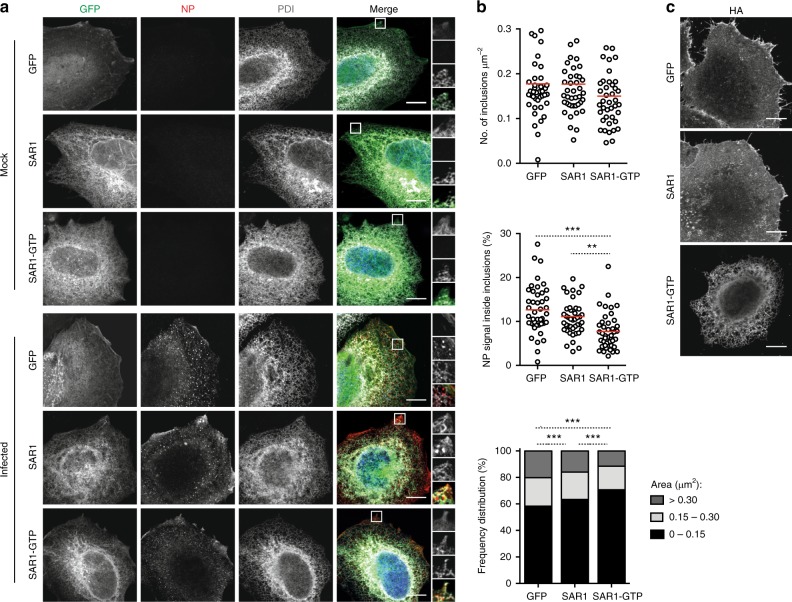
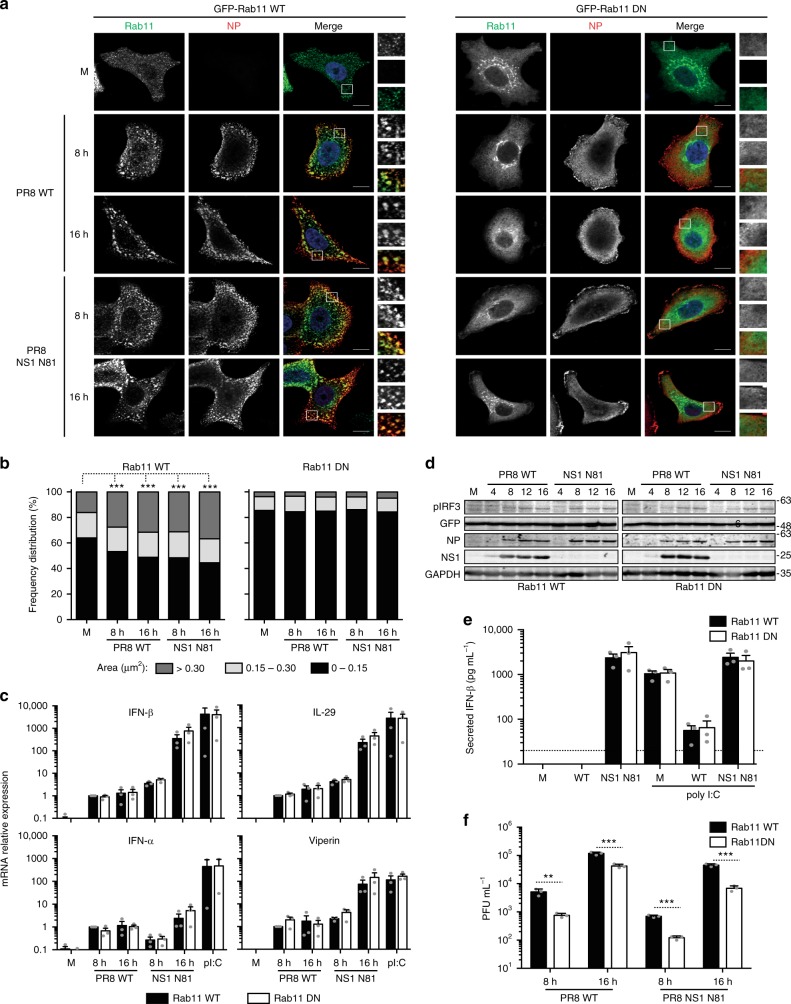
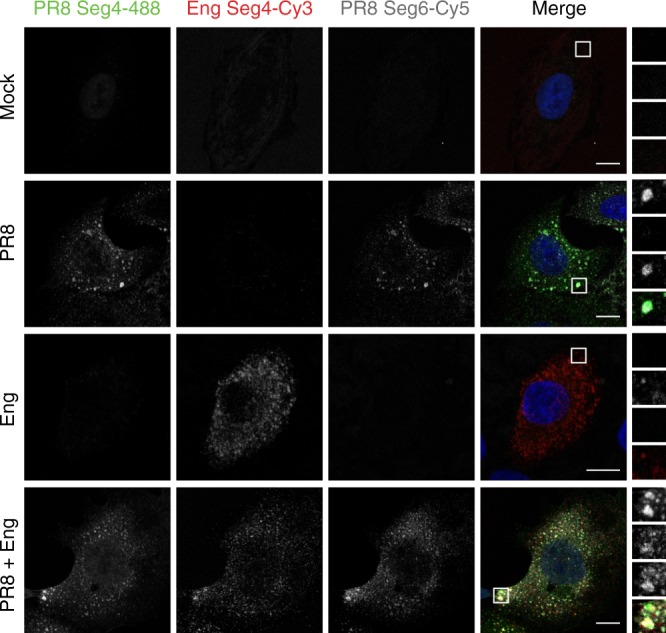
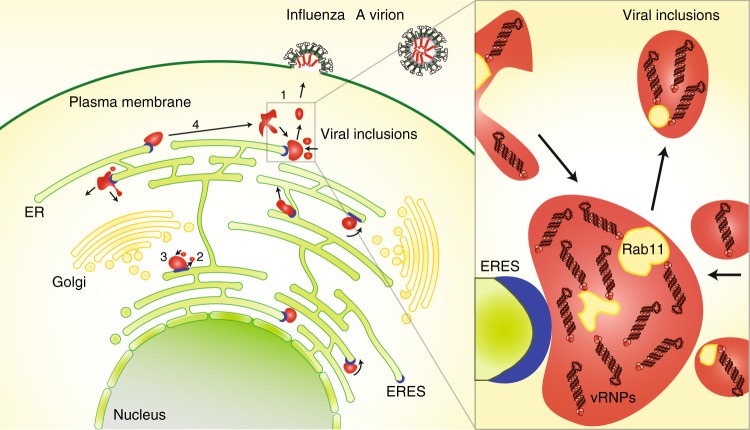
Influenza A virus has an eight-partite RNA genome that during viral assembly forms a complex containing one copy of each RNA. Genome assembly is a selective process driven by RNA-RNA interactions and is hypothesized to lead to discrete punctate structures scattered through the cytosol. Here, we show that contrary to the accepted view, formation of these structures precedes RNA-RNA interactions among distinct viral ribonucleoproteins (vRNPs), as they assemble in cells expressing only one vRNP type. We demonstrate that these viral inclusions display characteristics of liquid organelles, segregating from the cytosol without a delimitating membrane, dynamically exchanging material and adapting fast to environmental changes. We provide evidence that viral inclusions develop close to endoplasmic reticulum (ER) exit sites, depend on continuous ER-Golgi vesicular cycling and do not promote escape to interferon response. We propose that viral inclusions segregate vRNPs from the cytosol and facilitate selected RNA-RNA interactions in a liquid environment.


Conflict of interest statement

The authors declare no competing interests.

Figures

Fig. 1
Fig. 1
Viral inclusions form in the absence of intersegment RNA–RNA interactions. 293 T cells were transfected for 16 h with the minimal protein components of an influenza vRNP: the three polymerase proteins (3P) (or, as a nonfunctional control, two polymerase proteins lacking PB2 - 2P) and NP, as well as with plasmids expressing GFP-NP and a a luciferase reporter plasmid cloned in negative sense and flanked by influenza promoter. mCherry-NP was also used instead of GFP-NP, when indicated. Luminescence was determined for luciferase expression and the values plotted as mean ± standard error of the mean (SEM). Results are a pool of 2 independent experiments; or be 293 T cells were further transfected with plasmids expressing vRNA from segments 7 and 8, or segment 7 alone, and a plasmid encoding NS2 when segment 7 was expressed alone. b Cells were lysed and the indicated proteins were detected by western blotting. c Cells were fixed and stained for Rab11 (red). White boxes show areas of co-localization between NP and Rab11. Nuclei are delineated by yellow dashed lines. Bar = 10 μm. d The frequency distribution of Rab11 inclusions within the three area categories (in μm2) was plotted for each condition. Statistical analysis of data was performed using a non-parametric Kruskal–Wallis test, followed by Dunn’s multiple comparisons test (***p < 0.001). Between 30 and 70 cells were analyzed per condition and 3 independent experiments were performed. e Duplicate samples were processed to detect segment 7 (red) and segment 8 (gray) RNA by FISH. White boxes show areas of co-localization between NP and viral segments. Nuclei are delineated by yellow dashed lines. Bar = 10 μm
Fig. 2
Fig. 2
PA-GFP virus and GFP-NP/PR8 system form dynamic cytosolic viral inclusions. a A549 cells were infected at an MOI of 0.001 with PA-GFP encoding PR8 virus or a WT virus to follow their growth over 48 h on a multicycle assay. b A549 cells were transfected with a plasmid encoding mCherry-NP and co-infected with PA-GFP virus at an MOI of 5, for 16 h, and live-imaged. Images were extracted from Supplementary Movie 1. cg A549 cells were infected with PR8 WT virus, PA-GFP virus or transfected with a plasmid encoding GFP-NP or GFP and co-infected with PR8 virus, at an MOI of 5, for 16 h. c Cells were fixed, processed for FISH to detect segments 1 and 3, and imaged. In the upper left panel, cells were also stained for NP (green). At least 30 cells were analyzed per condition, from 2 independent experiments. dg Cells were imaged under time-lapse conditions. Individual frames show fusion/fission events for PA-GFP virus (d, f) or GFP-NP/PR8 system (e, g) in the absence (d, e) or presence of the cytoskeleton drugs nocodazole and latrunculin A (f, g). Nocodazole and latrunculin A were added at 4 h. p.i. Yellow arrows highlight fusion or fission movements. Images were extracted from Supplementary Movies 2 to 9. Bar = 2 μm. At least 30 cells, from 3 independent experiments, were analyzed per condition
Fig. 3
Fig. 3
Viral inclusions quickly respond to changes in the cellular environment. A549 cells were transfected with a plasmid encoding GFP-NP and infected with PR8 (a) or infected with PA-GFP virus (b) at an MOI of 5. At 10–16 hpi, cells were imaged under time-lapse conditions. The black arrowhead indicates addition of 80% water (hypotonic shock), 5% hexanediol or regular growth medium. White boxes highlight  viral inclusions in the cytoplasm in the individual frames. The dashed white line marks the cell nucleus, whereas the dashed yellow line delineates the cell periphery. Bar = 10 μm. Images were extracted from Supplementary Movies 10 to 15. Experiments were performed at least twice. c A549 cells were infected with PR8, with PA-GFP virus, or transfected with a plasmid encoding GFP-NP and infected with PR8 as above. At 16 hpi, cells were fixed and stained for NP. Percentage of cells with undissolved viral inclusions under the indicated treatments was calculated and plotted. Statistical analysis of data was performed using a non-parametric Kruskal–Wallis test, followed by Dunn’s multiple comparisons test (**p < 0.05; ***p < 0.001). At least 10 cells were analyzed per individual dot and 10 panels per condition
Fig. 4
Fig. 4
vRNP/Rab11 inclusions exchange material dynamically and form membraneless liquid organelles. A549 cells were transfected with a plasmid encoding GFP-NP and infected with PR8 virus, at an MOI of 5 for 10–16 h, and imaged under time-lapse conditions. a A representative cell is shown. The fluorescence signal of viral inclusions in this cell is depicted as: average intensity (in red), standard deviation (in green), the merge of both, and coefficient of variation. Two areas of viral NP inclusions, highlighted in purple and cyan boxes, were selected for fluorescence recovery after photobleaching (FRAP). Bar = 10 μm. b The photobleached regions are marked by a yellow circle. The black arrowhead indicates the time of photobleaching. Relative Fluorescence Intensity (R.F.I.) was plotted as a function of time for each particle. Images have been extracted from Supplementary Movie 16. c R.F.I. was plotted as a function of time for the means of 25 FRAP events (left graph). The means are shown (black) with error bars representing the standard deviation (gray). The percentage of recovery of each photobleached region is shown for specific times (right graph), with medians represented as red bars. A single experiment representative of two independent experiments is shown. d HeLa cells with the GFP-NP/PR8 system, infected for 16 h (MOI = 10), were imaged by confocal and electron microscopy, and the resultant images were superimposed. Areas of correlation, inclusions 1 to 3, are delineated by a dashed line in the upper panel and shown in greater detail in the lower panel. Progeny virions budding at the surface (black arrows) show that the cell is infected. Black delimited arrowheads show individual vesicles within the inclusion. e GFP-Rab11 WT cells were infected with PR8 virus (MOI = 5) for 16 h, and then stained for GFP (18 nm gold particles) and viral NP (6 nm gold particles). Inclusion areas are highlighted by black boxes. Black arrowheads indicate ER structures in the vicinity of viral inclusions. Black arrows show progeny virions budding at the cell surface. Black delimited arrowheads show vesicles. White arrowheads show electron-dense vRNPs. A single experiment representative of two independent experiments is shown
Fig. 5
Fig. 5
Viral inclusions are associated with ER exit sites. a Sec61β-Emerald cells were transfected with mCherry-NP and infected with PR8 virus, at an MOI of 10, for 16 h. b A549 cells were co-transfected with plasmids encoding mCherry-NP and ER-GFP and infected with PR8 virus, at an MOI of 10, for 16 h. a, b Cells were imaged under time-lapse conditions. Individual frames with single moving particles highlighted with yellow arrows are shown. Images were extracted from Supplementary Movies 17 and 18. More than 15 cells from 3 independent experiments were analyzed in each condition. c A549 cells were infected or mock-infected (M) with PR8 virus, at an MOI of 3, and fixed at the indicated times. Cells were stained for the ER proteins Sec31A (in green) and PDI (in gray) and the viral NP protein (in red). Areas highlighted by the white box are shown on the right of each panel. Yellow arrowheads indicate co-localization between Sec31A and NP. Bar = 10 μm. More than 30 cells from 2 independent experiments were analyzed. d A549 cells were co-transfected with plasmids encoding mCherry-NP and GFP-Sec16 and infected or mock-infected (M) with PR8 virus for 16 h. Cells were imaged under time-lapse conditions. Representative cells are shown in the left large images. Individual frames with single moving particles highlighted with yellow arrows are shown in the small panels. Two examples are provided for the infected cell (16 h.1 and 16 h.2). Bar = 7.5 μm. Images were extracted from Supplementary Movies 19 and 20. Images are representative of at least 15 cells, from 2 independent experiments
Fig. 6
Fig. 6
Disruption of ER-Golgi trafficking disassembles vRNP hotspots. A549 cells were infected or mock-infected with PR8 virus at an MOI of 3. a At 90 min p.i., 2 μg mL−1 of brefeldin A (BFA) or 10 μg mL−1 nocodazole (NOC) were added and incubated for 10 h until the supernatant was collected and viral titres determined or cells were harvested in Laemmli’s and NP levels detected by western blotting. Statistical analysis of data was performed using a non-parametric one-way ANOVA, followed by Friedman’s multiple comparisons test (*p < 0.05). bd At 8 hpi, cells were also treated or mock-treated with 2 μg mL−1 of BFA for 1 h. b Cells were immunostained for the ER marker PDI (in green), the viral protein NP (in red) and the cis-Golgi marker GM130 (in gray) and imaged by confocal microscopy. Selected areas of the cytoplasm are marked by white boxes and displayed on the top left corner of the images. Bar = 10 μm. c The frequency distribution of NP inclusions within the three size categories (in μm2), the number of inclusions per μm2, and the percentage of NP staining that is inside inclusions were plotted for each condition. Statistical analysis of data was performed using a non-parametric Kruskal–Wallis test, followed by Dunn’s multiple comparisons test (***p < 0.001). An average of 60 cells from 2 independent experiments was analyzed per condition. d Infected cells were stained for the host protein Rab11 (in green) and the viral proteins NP (in red) and M2 (in gray). Cells were imaged by confocal microscopy. Areas highlighted by the white box are shown on the right top corner of each image. e A549 cells were transfected with a plasmid encoding GFP-NP and co-infected with PR8 virus, at an MOI of 5, for 10 h. Cells were imaged under time-lapse conditions in the absence or immediately after adding 2 μg mL−1 of BFA. Bar = 10 μm. Images were extracted from Supplementary Movies 20 and 21 , and are representative of 9 videos from 2 independent experiments
Fig. 7
Fig. 7
Disruption of ER exit sites dissolves viral inclusions. HeLa cells were transfected with plasmids encoding GFP, SAR1 WT-GFP (SAR1) or SAR1-GTP-GFP (SAR1-GTP) and, 24 h later, infected or mock-infected with PR8 virus, at an MOI of 10. At 16 hpi, cells were fixed and processed for immunofluorescence. a Cells were stained for the viral protein NP (in red) and for the ER protein PDI (in gray). Areas highlighted by the white box are shown on the right of each panel. b The number of inclusions per μm2, the percentage of NP staining that is inside inclusions and the frequency distribution of NP inclusions within the three area categories (in μm2) were plotted for each condition. Statistical analysis of data was performed using a non-parametric Kruskal–Wallis test, followed by Dunn’s multiple comparisons test (***p < 0.001). More than 40 cells from 2 independent experiments were analyzed per condition. c Infected cells were stained for the viral protein HA and imaged by confocal microscopy. Bar = 10 μm
Fig. 8
Fig. 8
Interferon response is not affected by the formation of viral inclusions. a Stable cell lines expressing GFP-Rab11 WT or GFP-Rab11 DN were infected or mock-infected (M), at an MOI of 3, with PR8 WT or NS1-N81 viruses. a Cells were fixed at 8 and 16 hpi and stained for NP (in red). Bar = 10 μm. b The frequency distribution of NP inclusions within the three area categories (in μm2) was plotted for each cell line. Statistical analysis of data was performed using a non-parametric Kruskal–Wallis test, followed by Dunn’s multiple comparisons test (*** p < 0.001 for GFP-Rab11 WT cells; no statistical significance found for GFP-Rab11 DN cells). Statistical analysis compares the area of all inclusions between conditions. An average of 30 cells was analyzed per condition. A single experiment representative of two independent experiments is shown. c Expression of IFN-β, IFN-α, IL-29 and viperin was evaluated at the level of transcription by RT-qPCR in relation to GAPDH. Poly(I:C) was used as a positive control for maximum expression of these transcripts. Statistical analysis of data was performed using two-way ANOVA test, followed by Sidak multiple comparisons test (no statistical significance between conditions found). Data represents the average of three independent experiments. d Expression of phosphorylated IRF3, GFP, NP, NS1, and GAPDH was evaluated at the protein level by western blotting. e The levels of secreted IFN-β were quantified by ELISA in cell supernatants at 24 hpi. Poly(I:C) was used as a positive control for maximum expression of IFN-β protein. The limit of detection of this method is 30 pg mL−1 (dashed line). Statistical analysis of data was performed using two-way ANOVA test, followed by Sidak multiple comparisons test (no statistical significance between conditions found). Data represent the average of three independent experiments. f At the indicated times, supernatants were collected and viral production was evaluated by plaque assays using MDCK cells. Statistical analysis of data was performed using Holm–Sidak multiple comparisons test (**p < 0.01, ***p < 0.001). Data correspond to one representative experiment out of three independent experiments
Fig. 9
Fig. 9
Viral inclusions harbor vRNPs of two parental viruses in co-infections. A549 cells were mock infected or infected with PR8 and/or Eng2009, at an MOI of 3, each. At 16 hpi, cells were fixed and processed for FISH to detect segments 4 of both viruses and segment 6 of PR8. Inlets show magnifications with all segments colocalizing in co-infections, and segment 4 and 6 upon PR8 challenge. 10 cells were analyzed per condition
Fig. 10
Fig. 10
Proposed model. Viral inclusions (in red) have properties of liquid organelles, segregating from the cytosol without a delimitating membrane. Viral inclusions exchange material dynamically (1) and deform easily, exhibiting fission (2) and fusion (3) events. Viral inclusions can travel long distances before and after fusion/fission events (4), respectively. These organelles are formed in the vicinity of ERES (in blue) and their assembly is dependent on continuous ER-Golgi vesicular cycling. We propose that viral inclusions trigger nucleation of vRNP–vRNP interactions among the eight different segments to assemble a complete IAV genome. Inlet shows composition of viral inclusions close to ERES. These contain vRNPs of all types, Rab11 and host membranes are clustered, but not delimited by a lipid bilayer

Similar articles

Cited by

References

    1. Kumar B, et al. The emerging influenza virus threat: status and new prospects for its therapy and control. Arch. Virol. 2018;163:831–844. doi: 10.1007/s00705-018-3708-y. - DOI - PMC - PubMed
    1. Lee N, et al. Genome-wide analysis of influenza viral RNA and nucleoprotein association. Nucleic Acids Res. 2017;45:8968–8977. doi: 10.1093/nar/gkx584. - DOI - PMC - PubMed
    1. Lowen AC. Constraints, drivers, and implications of influenza A virus reassortment. Annu Rev. Virol. 2017;4:105–121. doi: 10.1146/annurev-virology-101416-041726. - DOI - PubMed
    1. Belshaw R, Gardner A, Rambaut A, Pybus OG. Pacing a small cage: mutation and RNA viruses. Trends Ecol. Evol. 2008;23:188–193. doi: 10.1016/j.tree.2007.11.010. - DOI - PMC - PubMed
    1. Ferhadian D, et al. Structural and functional motifs in influenza virus RNAs. Front. Microbiol. 2018;9:559. doi: 10.3389/fmicb.2018.00559. - DOI - PMC - PubMed

Publication types

MeSH terms