

Differentiating SGBS adipocytes respond to PPARγ stimulation, irisin and BMP7 by functional browning and beige characteristics
- PMID: 30967578
- PMCID: PMC6456729
- DOI: 10.1038/s41598-019-42256-0
Differentiating SGBS adipocytes respond to PPARγ stimulation, irisin and BMP7 by functional browning and beige characteristics
Abstract
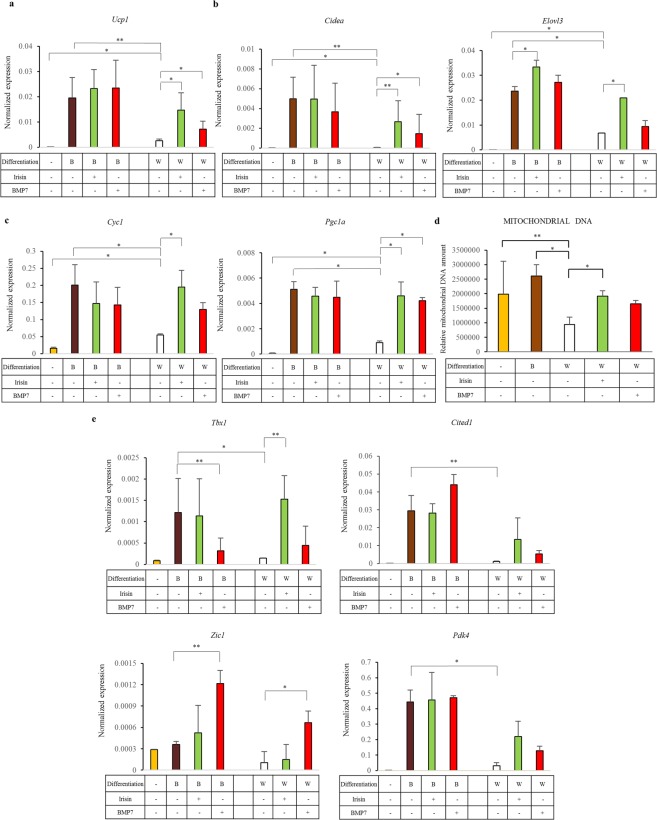
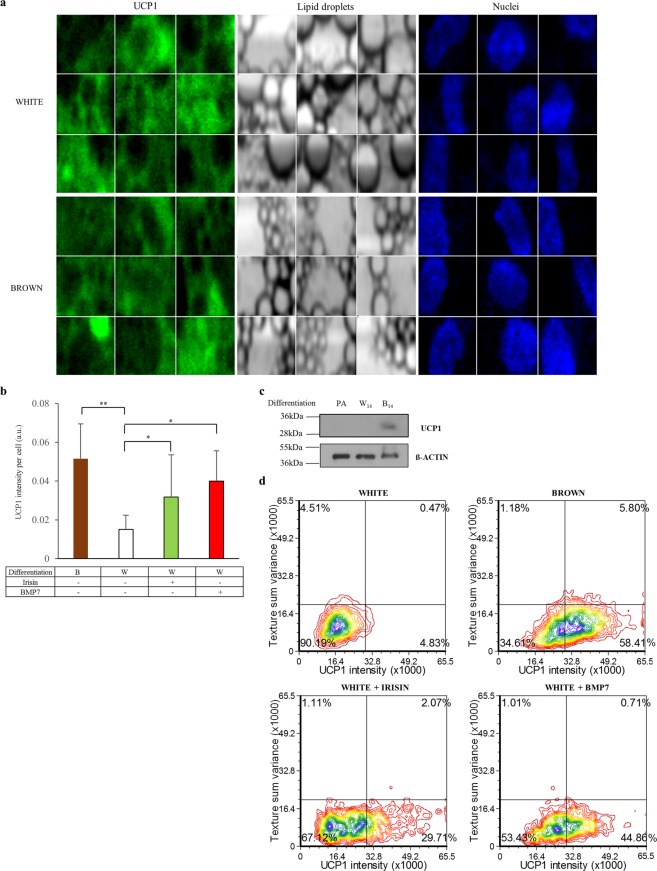
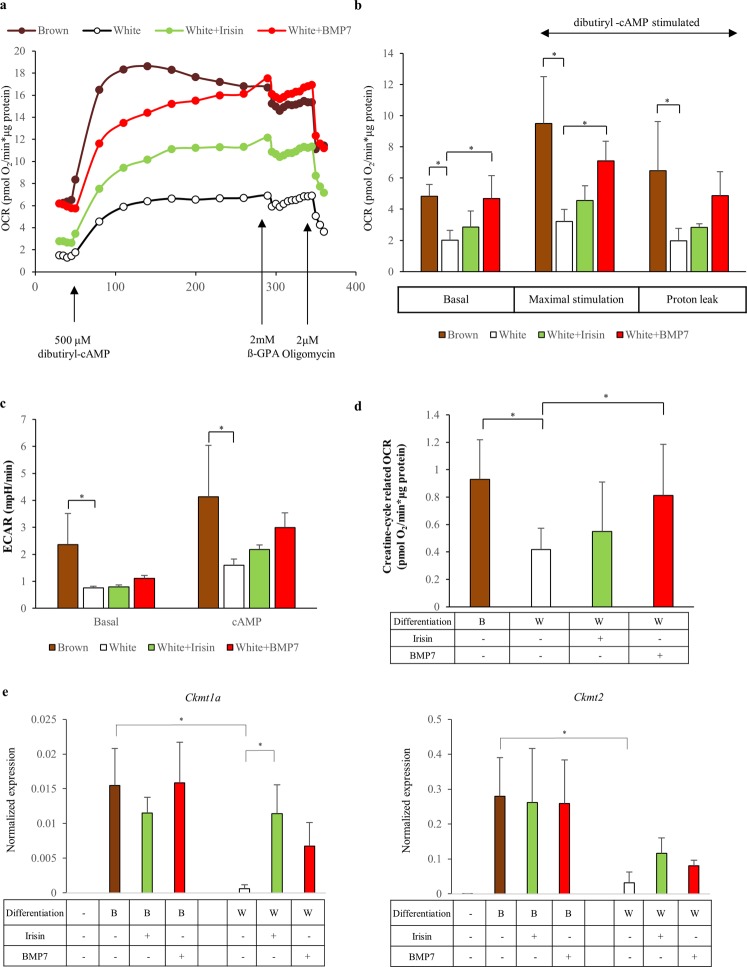
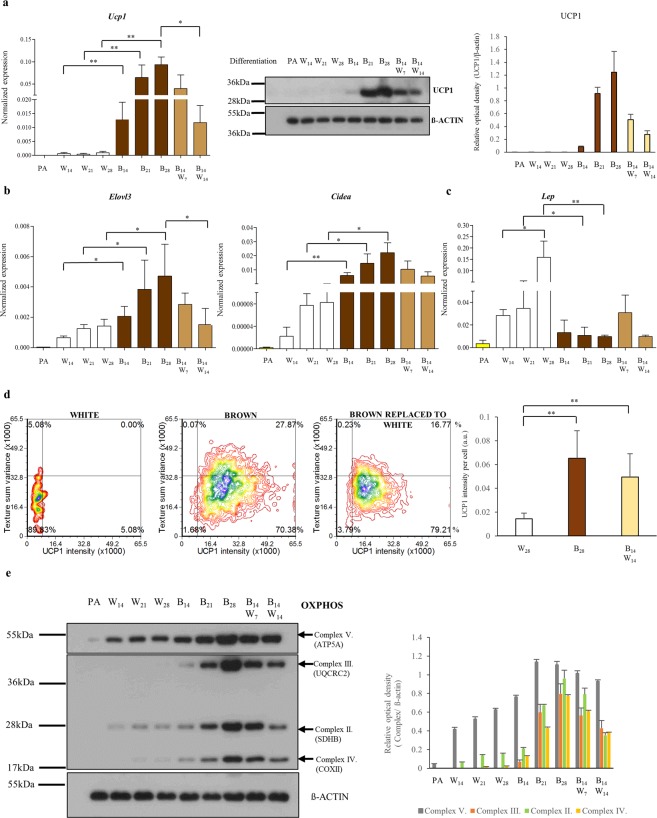
Brown and beige adipocytes are enriched in mitochondria with uncoupling protein-1 (UCP1) to generate heat instead of ATP contributing to healthy energy balance. There are few human cellular models to reveal regulatory networks in adipocyte browning and key targets for enhancing thermogenesis in obesity. The Simpson-Golabi-Behmel syndrome (SGBS) preadipocyte line has been a useful tool to study human adipocyte biology. Here we report that SGBS cells, which are comparable to subcutaneous adipose-derived stem cells, carry an FTO risk allele. Upon sustained PPARγ stimulation or irisin (a myokine released in response to exercise) treatment, SGBS cells differentiated into beige adipocytes exhibiting multilocular lipid droplets, high UCP1 content with induction of typical browning genes (Cidea, Elovl3) and the beige marker Tbx1. The autocrine mediator BMP7 led to moderate browning with the upregulation of the classical brown marker Zic1 instead of Tbx1. Thermogenesis potential resulted from PPARγ stimulation, irisin and BMP7 can be activated in UCP1-dependent and the beige specific, creatine phosphate cycle mediated way. The beige phenotype, maintained under long-term (28 days) conditions, was partially reversed by withdrawal of PPARγ ligand. Thus, SGBS cells can serve as a cellular model for both white and sustainable beige adipocyte differentiation and function.
Conflict of interest statement
The authors declare no competing interests.
Figures
Similar articles
-
Clozapine modifies the differentiation program of human adipocytes inducing browning.Transl Psychiatry. 2016 Nov 29;6(11):e963. doi: 10.1038/tp.2016.230. Transl Psychiatry. 2016. PMID: 27898069 Free PMC article.
-
Irisin exerts dual effects on browning and adipogenesis of human white adipocytes.Am J Physiol Endocrinol Metab. 2016 Aug 1;311(2):E530-41. doi: 10.1152/ajpendo.00094.2016. Epub 2016 Jul 19. Am J Physiol Endocrinol Metab. 2016. PMID: 27436609
-
BMP4 and BMP7 induce the white-to-brown transition of primary human adipose stem cells.Am J Physiol Cell Physiol. 2014 Mar 1;306(5):C431-40. doi: 10.1152/ajpcell.00290.2013. Epub 2013 Nov 27. Am J Physiol Cell Physiol. 2014. PMID: 24284793
-
Meaningful respirometric measurements of UCP1-mediated thermogenesis.Biochimie. 2017 Mar;134:56-61. doi: 10.1016/j.biochi.2016.12.005. Epub 2016 Dec 14. Biochimie. 2017. PMID: 27986537 Review.
-
[Evaluation of Naturally Occurring Compounds Regulating Brown/Beige Adipocyte Differentiation].Yakugaku Zasshi. 2019;139(6):861-866. doi: 10.1248/yakushi.18-00173-3. Yakugaku Zasshi. 2019. PMID: 31155526 Review. Japanese.
Cited by
-
Natural Extracts to Augment Energy Expenditure as a Complementary Approach to Tackle Obesity and Associated Metabolic Alterations.Biomolecules. 2021 Mar 10;11(3):412. doi: 10.3390/biom11030412. Biomolecules. 2021. PMID: 33802173 Free PMC article.
-
Extracellular thiamine concentration influences thermogenic competency of differentiating neck area-derived human adipocytes.Front Nutr. 2023 Sep 13;10:1207394. doi: 10.3389/fnut.2023.1207394. eCollection 2023. Front Nutr. 2023. PMID: 37781121 Free PMC article.
-
D-Chiro-Inositol Regulates Insulin Signaling in Human Adipocytes.Front Endocrinol (Lausanne). 2021 Mar 30;12:660815. doi: 10.3389/fendo.2021.660815. eCollection 2021. Front Endocrinol (Lausanne). 2021. PMID: 33859622 Free PMC article.
-
Mitophagy Mediates the Beige to White Transition of Human Primary Subcutaneous Adipocytes Ex Vivo.Pharmaceuticals (Basel). 2022 Mar 17;15(3):363. doi: 10.3390/ph15030363. Pharmaceuticals (Basel). 2022. PMID: 35337160 Free PMC article.
-
BMP7 Increases UCP1-Dependent and Independent Thermogenesis with a Unique Gene Expression Program in Human Neck Area Derived Adipocytes.Pharmaceuticals (Basel). 2021 Oct 25;14(11):1078. doi: 10.3390/ph14111078. Pharmaceuticals (Basel). 2021. PMID: 34832860 Free PMC article.
References
-
- Petrovic N, et al. Chronic peroxisome proliferator-activated receptor γ (PPARγ) activation of epididymally derived white adipocyte cultures reveals a population of thermogenically competent, UCP1-containing adipocytes molecularly distinct from classic brown adipocytes. Journal of Biological Chemistry. 2010;285:7153–7164. doi: 10.1074/jbc.M109.053942. - DOI - PMC - PubMed
-
- Cousin B, et al. Occurrence of brown adipocytes in rat white adipose tissue: molecular and morphological characterization. Journal of cell science. 1992;103:931–942. - PubMed
Publication types
MeSH terms
Substances
Supplementary concepts
LinkOut - more resources
Full Text Sources
Research Materials
