. 2019 Nov;33(11):2585-2598.
doi: 10.1038/s41375-019-0456-2. Epub 2019 Apr 9.

SETD2 mutations confer chemoresistance in acute myeloid leukemia partly through altered cell cycle checkpoints

Affiliations

SETD2 mutations confer chemoresistance in acute myeloid leukemia partly through altered cell cycle checkpoints

Yunzhu Dong et al. Leukemia. 2019 Nov.

Abstract

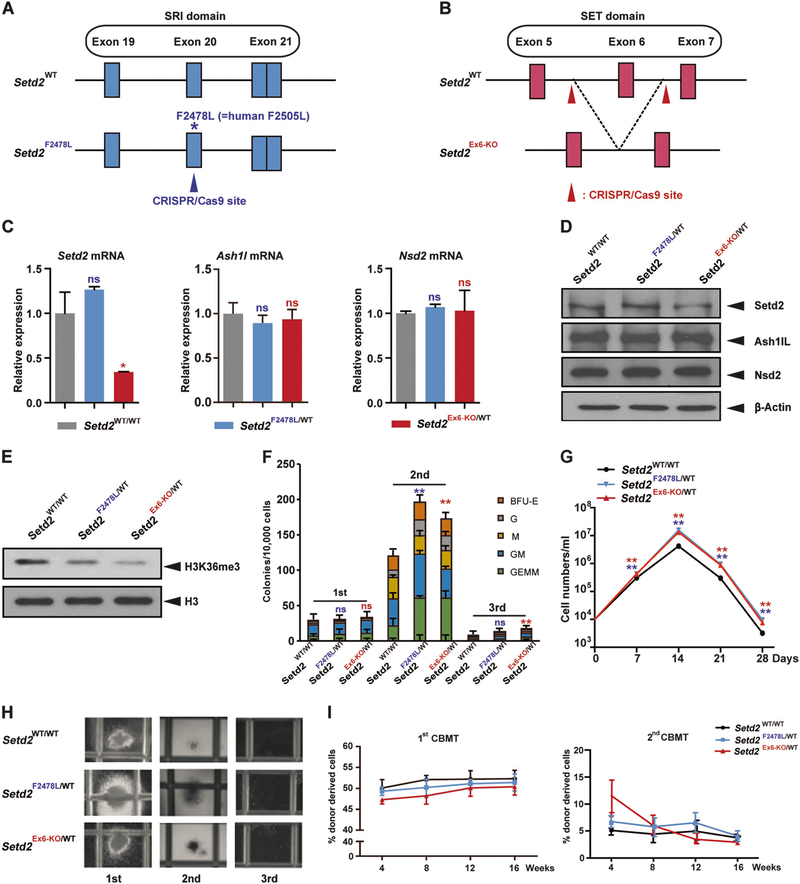
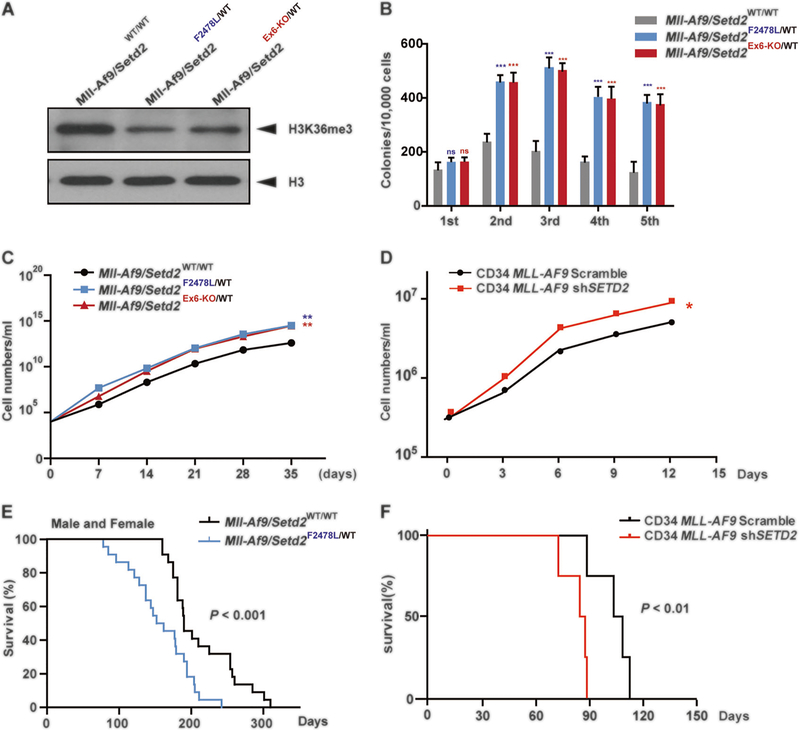
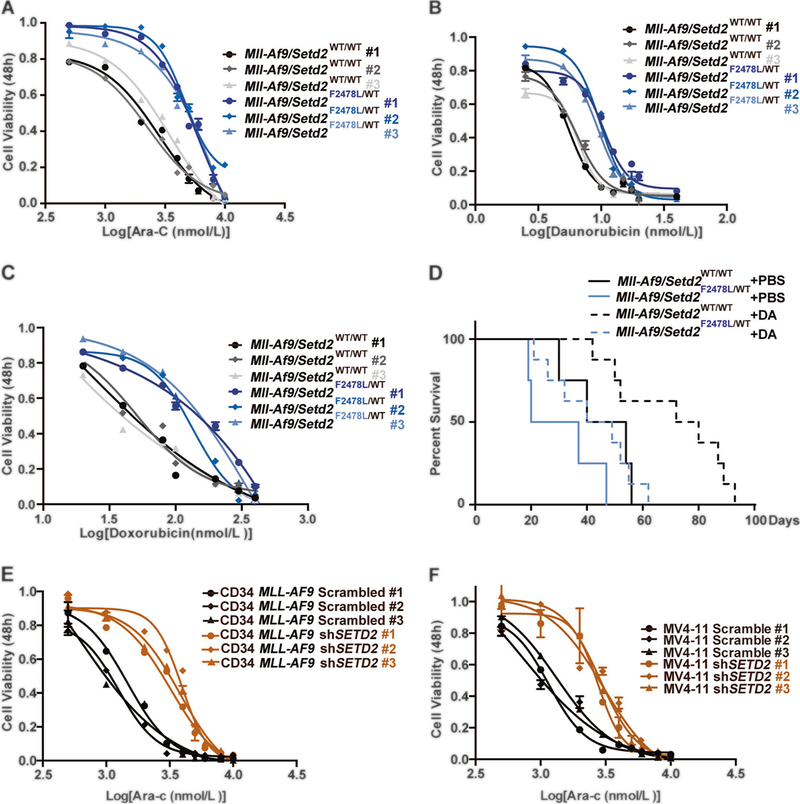
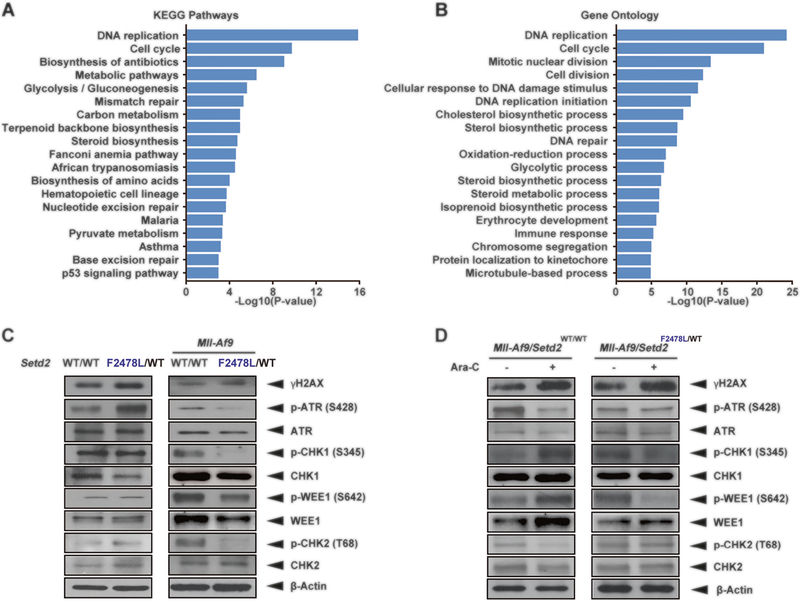
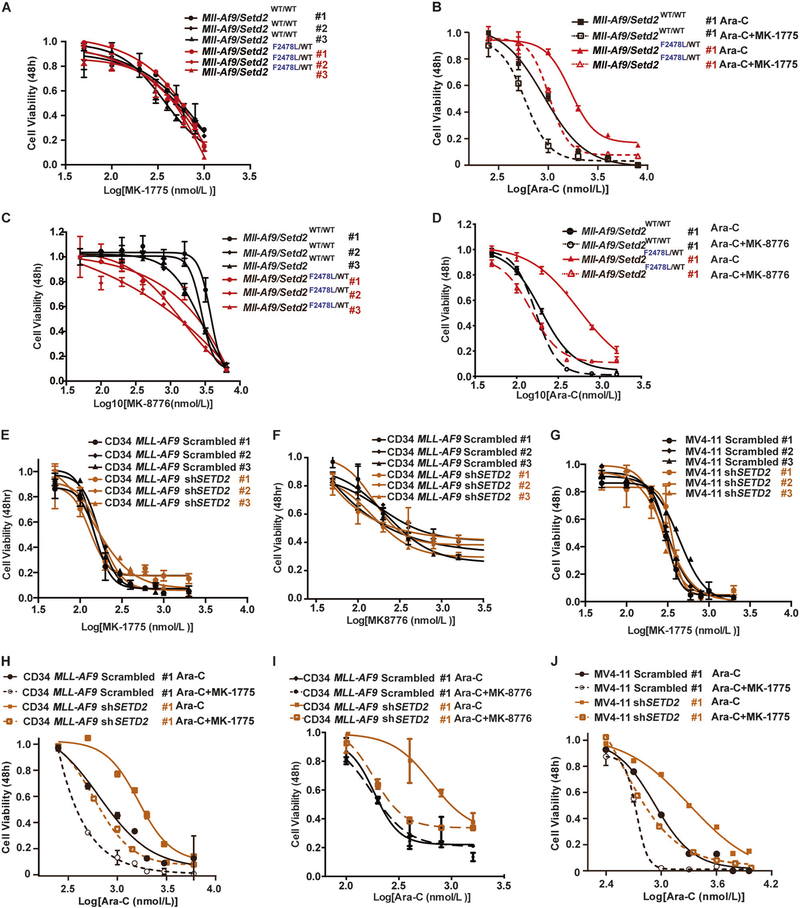
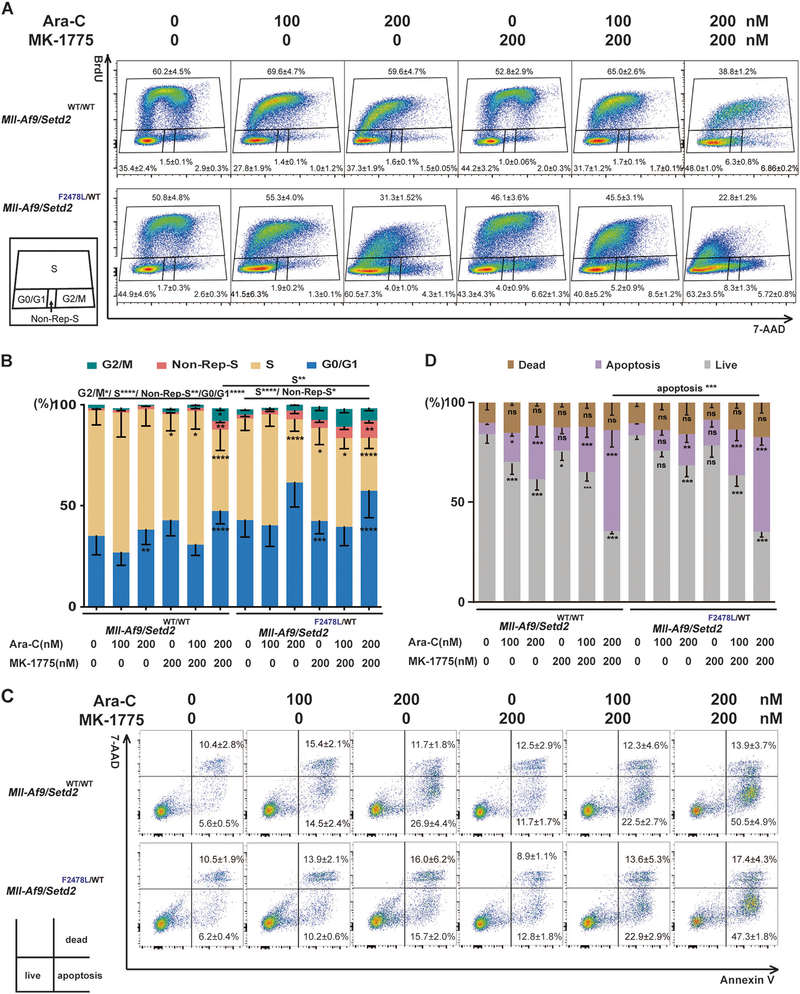
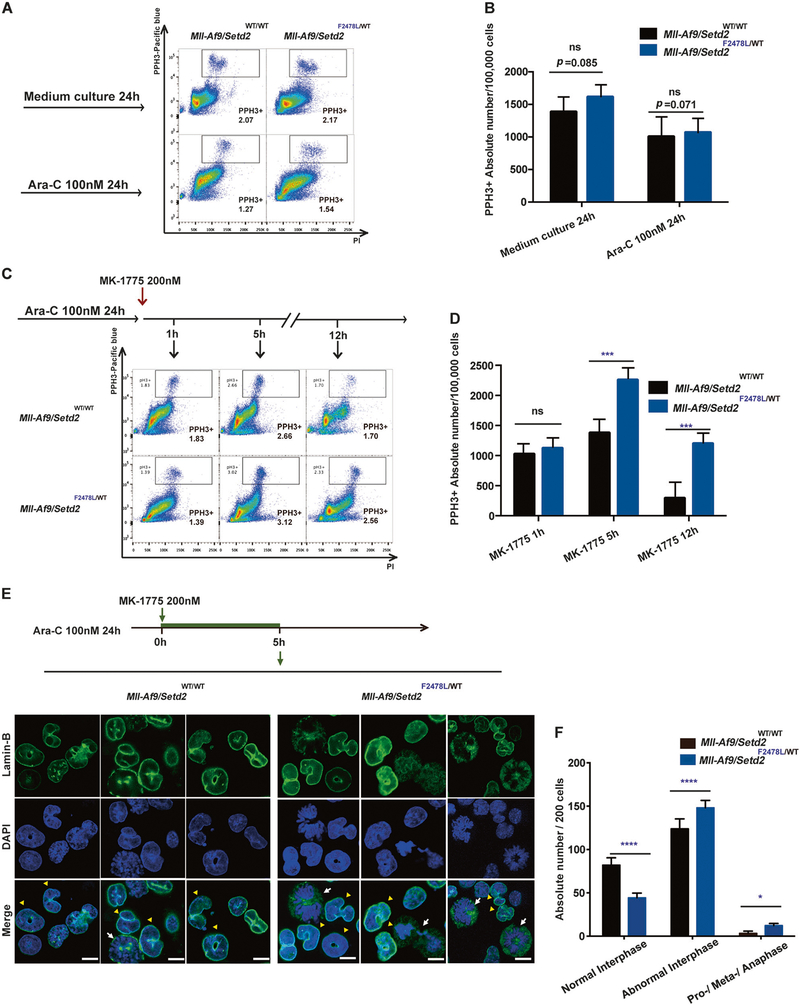
SETD2, an epigenetic tumor suppressor, is frequently mutated in MLL-rearranged (MLLr) leukemia and relapsed acute leukemia (AL). To clarify the impact of SETD2 mutations on chemotherapy sensitivity in MLLr leukemia, two loss-of-function (LOF) Setd2-mutant alleles (Setd2F2478L/WT or Setd2Ex6-KO/WT) were generated and introduced, respectively, to the Mll-Af9 knock-in leukemia mouse model. Both alleles cooperated with Mll-Af9 to accelerate leukemia development that resulted in resistance to standard Cytarabine-based chemotherapy. Mechanistically, Setd2-mutant leukemic cells showed downregulated signaling related to cell cycle progression, S, and G2/M checkpoint regulation. Thus, after Cytarabine treatment, Setd2-mutant leukemic cells exit from the S phase and progress to the G2/M phase. Importantly, S and G2/M cell cycle checkpoint inhibition could resensitize the Mll-Af9/Setd2 double-mutant cells to standard chemotherapy by causing DNA replication collapse, mitotic catastrophe, and increased cell death. These findings demonstrate that LOF SETD2 mutations confer chemoresistance on AL to DNA-damaging treatment by S and G2/M checkpoint defects. The combination of S and G2/M checkpoint inhibition with chemotherapy can be explored as a promising therapeutic strategy by exploiting their unique vulnerability and resensitizing chemoresistant AL with SETD2 or SETD2-like epigenetic mutations.


Conflict of interest statement

Conflict of interest The authors declare no potential conflicts of interest.

Figures

Fig. 1
Fig. 1
Mouse models with two distinct loss-of-function Setd2 mutations show similar phenotypes. a, b Schemes of the wild-type Setd2 locus (top) and Setd2 mutation locus (bottom) after Cas9–CRISPR- mediated modification. The Setd2F2478L point mutation locates within exon 20 in the SRI domain (a). Setd2 exon 6 locates in the SET domain (b). c Relative Setd2, Ashl1, and Nsd2 mRNA levels in c-Kit positive bone marrow cells measured by quantitative real-time PCR (Q-PCR) and normalized to β-actin levels using the Δ–CT method. d, e Endogenous Setd2, Ash1L, and Nsd2 protein expression (d), and H3K36me3 levels (e), in c-Kit positive bone marrow cells from wild type, Setd2F2478L/WT, and Setd2Ex6-KO/WT mice determined by western blot. f Bone marrow cells from wild type, Setd2F2478L/WT, and Setd2Ex6-KO/WT mice were analyzed with M3434 methylcellulose-based medium. A total of 10,000 bone marrow cells were plated in triplicate in M3434. Colony count scoring and replating was repeated every 7 days. g Cell number counts of CFUs in serial replating in (f). h Representative image of colonies in (f). i First and second competitive bone marrow transplantation. WT recipient mice were intravenously injected with 1.5 × 10⁶ BM-MNCs from WT, Setd2F2478L/WT, or Setd2Ex6-KO/WT mice (CD45.2+) together with an equal number of CD45.1+ competitor cells. Peripheral blood cells were collected from recipients monthly and analyzed by FACS for the presence of CD45.2+ donor-derived cells. Three biological replicates of each genotype are performed in triplicate and the data are presented as the mean ± SD values. **P < 0.01
Fig. 2
Fig. 2
Setd2 mutants cooperate with the Mll-Af9 knock-in allele to accelerate leukemia. a H3K36me3 levels in c-Kit positive bone marrow cells from Mll-Af9/Setd2WT/WT, Mll-Af9/Setd2F2478L/WT, and Mll-Af9/Setd2Ex6-KO/WT mice at 6 months, the end stage of leukemia. b CFU replating assays of bone marrow cells from Mll-Af9 and two Mll-Af9/ Setd2-mutant mice. c Cell number counts of CFUs in the serial replating in (b). d Cell number counts of serial replating of CD34 MLL-AF9/Scrambled and CD34 MLL-AF9/shSETD2 cells. Three biological replicates of each genotype are performed in triplicate and the data are presented as the mean ± SD values. *P < 0.05; **P < 0.01; ***P < 0.001. e Survival curves for Mll-Af9 (n = 16) and Mll-Af9/ Setd2Ex6-KO/WT (n = 20) transgenic mutant mice, regardless of gender. f Survival curves for NSGS mice receiving bone marrow transplantation with CD34 MLL-AF9/Scrambled (n = 4) or CD34 MLL-AF9/ shSETD2 (n = 4) cells
Fig. 3
Fig. 3
Setd2 mutation leads to chemoresistance of Mll-Af9 AML cells. a–c Drug resistance assays in multiple clones from different individuals of both Mll-Af9 and Mll-Af9/Setd2F2478L/WT primary bone marrow leukemic populations treated with Ara-C (a), Daunorubicin (b), or Doxorubicin (c). Drug concentrations are indicated on the horizontal axis. Three biological replicates of each genotype are performed in triplicate and the data are presented as the mean ± SD values. d After transplantation of bone marrow cells from Mll-Af9 or Mll-Af9/ Setd2F2478L/WT mice to B6-SJL (CD45.1+) mice (n = 4 in each group, two independent biological replicates) for 3 weeks, the chemotherapy regimen was performed by intravenous (i.v.) injection of Doxorubicin and Ara-C. Days of survival of treated and nontreated mice in the Mll-Af9 and Mll-Af9/Setd2-mutant cohorts were recorded. e, f Drug resistance assays in Mll-Af9 human CD34+ cells (e) or the MV4–11 cell line (f) with shRNA-mediated SETD2 knockdown. Three biological replicates of each genotype are performed in triplicate, and the data are presented as the mean ± SD values
Fig. 4
Fig. 4
Checkpoint signaling is dysregulated in Mll-Af9/Setd2-mutant AML. a, b KEGG pathway analysis (a) and GO analysis (b) of RNA-seq data from Mll-Af9 and Mll-Af9/shSetd2 knockdown cell lines. c Detection of endogenous DNA damage and checkpoint-related proteins in untreated Setd2F2478L/WT and Mll-Af9/Setd2F2478L/WT cells using immunoblotting. d Detection of endogenous DNA damage and checkpoint-related proteins in Mll-Af9 and Mll-Af9/Setd2F2478L/WT cells following treatment with 100 nM Ara-C for 48 h using immunoblotting. The data are presented from one representative experiment with one of four independent clones’ replicates. The results were consistent across all biological replicates tested
Fig. 5
Fig. 5
Checkpoint inhibition resensitizes resistant Mll-Af9/Setd2 double-mutant AML cells to chemotherapy. a Mll-Af9 and Mll-Af9/ Setd2F2478L/WT primary bone marrow leukemic cells were treated with variable concentrations of the WEE1 inhibitor MK-1775 for 48 h. b Mll-Af9 and Mll-Af9/Setd2F2478L/WT primary bone marrow leukemic cells were treated with variable concentrations of the combination of Ara-C and MK-1775 for 48 h. c Mll-Af9 and Mll-Af9/Setd2F2478L/WT primary cells were treated with variable concentrations of the CHK1 inhibitor MK-8776 for 48 h. d Mll-Af9 and Mll-Af9/Setd2F2478L/WT primary cells were treated with variable concentrations of the combination of Ara-C and MK-8776 for 48 h. e–g shRNA-mediated Setd2 knockdown was performed in MLL-AF9 human CD34+ cells (e, f) and the MV4–11 cell line (g). After puromycin selection, the stable cell lines were treated with variable concentrations of the WEE1 inhibitor MK-1775 (e, g) or CHK1 inhibitor MK-8776 (f). h MLL-AF9 human CD34+ Scrambled and shSETD2 cells tested in the combination of Ara-C and MK-1775 for 48 h. i MLL-AF9 human CD34+ Scrambled and shSETD2 cells tested with the combination of Ara-C and MK-8776 for 48 h. j MV4–11 Scrambled and shSETD2 cells tested with the combination of Ara-C and MK-1775 for 48 h. The data in (a, c, e, f, g) are shown as three biological replicates of each genotype performed in triplicate and presented as the mean ± SD values. The data in (b, d, h, i, j) are shown as the mean ± SD values (n = 3 technical replicates) of one independent clone
Fig. 6
Fig. 6
Checkpoint inhibition alters the cell cycle and promotes apoptosis in cells treated with chemotherapeutic agents. Mll-Af9 or Mll-Af9/Setd2F2478L/WT AML cells treated with Ara-C, MK-1775, or a combination, as indicated, for 24 h. a Cell cycle phase distributions were determined via BrdU incorporation for 40 min. b The percentage of cells at various stages of the cell cycle (G2/M, S, G0/G1, and non-Rep-S) in (a) was calculated and illustrated. Non-Rep-S represents the non-replicating S phase. c Apoptosis of the cells in quadrant 3 was evaluated by Annexin V/7-AAD staining. d Graphical representation of the percentage of apoptotic cells in (c). The stacked bar graphs indicate the mean percentage of viable (“live”), early apoptotic (“apoptosis”), and late apoptotic (“dead”) cells. Three biological replicates of each genotype are performed in triplicate and the data are presented as the mean ± SD values. *P < 0.05; **P < 0.01; ***P < 0.001; ****P < 0.0001
Fig. 7
Fig. 7
Checkpoint inhibition increases mitotic catastrophe in chemotreated cells. a Flow cytometry analysis of the phospho-Histone H3 (PHH3)-positive (PHH3+) mitotic population (indicated by boxes) in Mll-Af9 and Mll-Af9/Setd2F2478L/WT primary cells after exposure to culture medium alone or Ara-C treatment for 24 h. b The total number of PHH3+ cells in Mll-Af9 and Mll-Af9/Setd2 F2478L/WT primary cells in (a) were calculated and illustrated. c After Mll-Af9 and Mll-Af9/ Setd2F2478L/WT primary cells were treated with Ara-C for 24 h, the WEE1 inhibitor MK-1775 was added and cells were collected at 1, 5, and 12 h from the same culture for pHH3+ analysis. d Total number of PHH3+ cells in Mll-Af9 and Mll-Af9/Setd2F2478L/WT primary populations in (c) were illustrated and calculated. e After Mll-Af9 and Mll- Af9/Setd2F2478L/WT primary cells were treated with Ara-C for 24 h, MK-1775 was added and the cells were collected at 5 h for confocal analysis. Mitotic catastrophe is visualized by micronucleation detected with an antibody against Lamin B (green). Nuclei or condensed chromosomes are shown by counterstaining with DAPI (blue). Scale bar indicates 10 μm. Yellow triangles are used to show abnormal interphase cells; white arrows are used to show pro-/meta-/anaphase cells. f Representative data of three independent experiments in (e) are shown. In total, 200 cells per slide were counted. Three biological replicates of each genotype are performed in triplicate and the data are presented as the mean ± SD values. *P < 0.05; ***P < 0.001; ****P < 0.0001

References

    1. Estey E, Dohner H. Acute myeloid leukaemia. Lancet. 2006;368:1894–907. - PubMed
    1. Short NJ, Ravandi F. Acute myeloid leukemia: past, present, and prospects for the future. Clin Lymphoma Myeloma Leuk. 2016;16 (Suppl):S25–9. - PubMed
    1. Farkona S, Diamandis EP, Blasutig IM. Cancer immunotherapy: the beginning of the end of cancer? BMC Med. 2016;14:73. - PMC - PubMed
    1. Nagler E, Xavier MF, Frey N. Updates in immunotherapy for acute myeloid leukemia. Transl Cancer Res. 2017;6:86–92.
    1. Hourigan CS. Editorial: targets for immunotherapy in acute leukemia. Curr Drug Targets. 2017;18:256. - PMC - PubMed

Publication types

MeSH terms