. 2019 May;120(10):1003-1006.
doi: 10.1038/s41416-019-0449-y. Epub 2019 Apr 10.

Intratumor heterogeneity of PD-L1 expression in head and neck squamous cell carcinoma

Affiliations

Intratumor heterogeneity of PD-L1 expression in head and neck squamous cell carcinoma

Jacob H Rasmussen et al. Br J Cancer. 2019 May.

Abstract

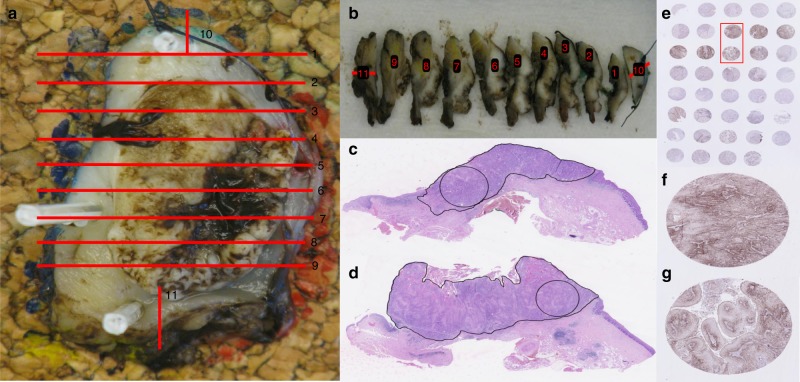
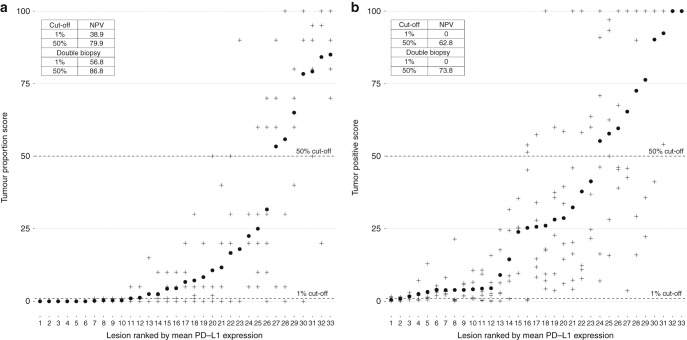
Intratumor heterogeneity may contribute to the ambiguous clinical results on PD-L1 status as a predictor for immunotherapy response in patients with HNSCC. This decreases the utility of PD-L1 expression from single tumour biopsies as a predictive biomarker. In this prospective study, intratumor heterogeneity of PD-L1 expression in HNSCC was investigated with both Tumour Proportion Score (TPS) and Combined Positive Score (CPS). Thirty-three whole surgical specimens from 28 patients with HNSCC were included. PD-L1 expression in six random core biopsies from each surgical specimen was used to assess the concordance between multiple biopsies and the negative predictive value of a single negative core biopsy. With 1% cut off, 36% of the specimens were concordant with TPS and 52% with CPS. With a 50% cut-off value the concordance was 70% with TPS and 55% with CPS. Defining a tumour as positive if just a single-one of the biopsies was positive, the negative predictive value (NPV) of a single negative core biopsy was 38.9 and 0% (1% cut off), and 79.9% and 62.8% (50% cut off) for TPS and CPS, respectively. In conclusion, PD-L1 positivity varies markedly within the tumour, both with TPS and CPS, challenging the utility of this biomarker.


Conflict of interest statement

The authors declare no competing interests.

Figures

Fig. 1
Fig. 1
ag illustrates the workflow and histologic processing in the study. a shows how the lesions were sectioned contiguously into tumour blocks, yielding 11 tumour blocks in this particularly case. Each red line on (a) corresponds to the specific tumour block number in Fig. 2b. Six blocks were selected randomly for further histologic processing. c and d depicts the 4-µm section stained with haematoxylin and eosin from block 2 and block 8. The black circle indicates from where the 3 mm core biopsy was performed. e illustrates a sectioned from a tissue micro array block stained for PD-L1 expression. f and g are the two cores marked with the red square in 1E and correspond the two cores in shown in c, d
Fig. 2
Fig. 2
a shows a scatter plot of the PD-L1 score in each biopsy with tumour proportion score (TPS) and b shows the PD-L1 expression with combined positive score (CPS). In a and b the y-axis depicts the PD-L1 score from 0–100%. The x-axis depicts the 33 lesions ranked by mean PD-L1 score marked with a black circle for TPS and CPS, respectively. The crosses depict the actual score from each of the six biopsies. As an example, in lesion 1 and 2 all biopsies scored 0% in a. The black dashed lines marks 1% cut off and 50% cut-off values. The insert in the upper left corner of both (a) and (b) depicts the negative predictive value of a single negative core biopsy using a 1% cut off and 50% cut off for positivity with TPS (2A) and CPS (2B) in case of one biopsy and with double biopsy. The ground truth is assumed to be that a tumour is positive if any of the six core biopsies are positive. For the five patients with two lesions, lesion 30, 15, 25, 7 and 2 is the primary lesions and lesion 32, 12, 26, 8 and 1 is the corresponding lymph node lesions in a. Lesion 29, 17, 23, 2 and 12 is the primary lesions in b and lesion 32, 15, 24, 5 and 13 the corresponding lymph node lesions

References

    1. Network TCGA. Comprehensive genomic characterization of head and neck squamous cell carcinomas. Nature. 2015;517:576–582. doi: 10.1038/nature14129. - DOI - PMC - PubMed
    1. Pignon JP, le Maître A, Maillard E, Bourhis J. Meta-analysis of chemotherapy in head and neck cancer (MACH-NC): an update on 93 randomised trials and 17,346 patients. Radiother Oncol. 2009;92:4–14. doi: 10.1016/j.radonc.2009.04.014. - DOI - PubMed
    1. Vermorken JB, Mesia R, Rivera F, Remenar E, Kawecki A, Rottey S, et al. Platinum-based chemotherapy plus cetuximab in head and neck cancer. N. Engl. J. Med. 2008;359:1116–1127. doi: 10.1056/NEJMoa0802656. - DOI - PubMed
    1. Szturz P, Vermorken JB. Immunotherapy in head and neck cancer: aiming at EXTREME precision. BMC Med. 2017;15:110. doi: 10.1186/s12916-017-0879-4. - DOI - PMC - PubMed
    1. Ferris RL, Blumenschein G, Fayette J, Guigay J, Colevas AD, Licitra L, et al. Nivolumab vs investigator’s choice in recurrent or metastatic squamous cell carcinoma of the head and neck: 2-year long-term survival update of CheckMate 141 with analyses by tumor PD-L1 expression. Oral Oncol. 2018;81:45–51. doi: 10.1016/j.oraloncology.2018.04.008. - DOI - PMC - PubMed

Publication types

MeSH terms