. 2019 Mar 22:10:527.
doi: 10.3389/fimmu.2019.00527. eCollection 2019.

Immunometabolic Signatures Predict Risk of Progression to Active Tuberculosis and Disease Outcome

Collaborators, Affiliations

Immunometabolic Signatures Predict Risk of Progression to Active Tuberculosis and Disease Outcome

Fergal J Duffy et al. Front Immunol. .

Abstract

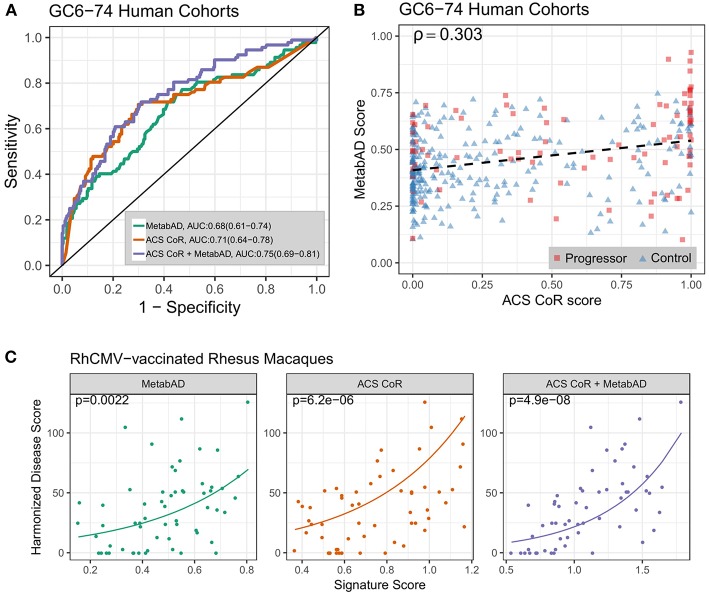
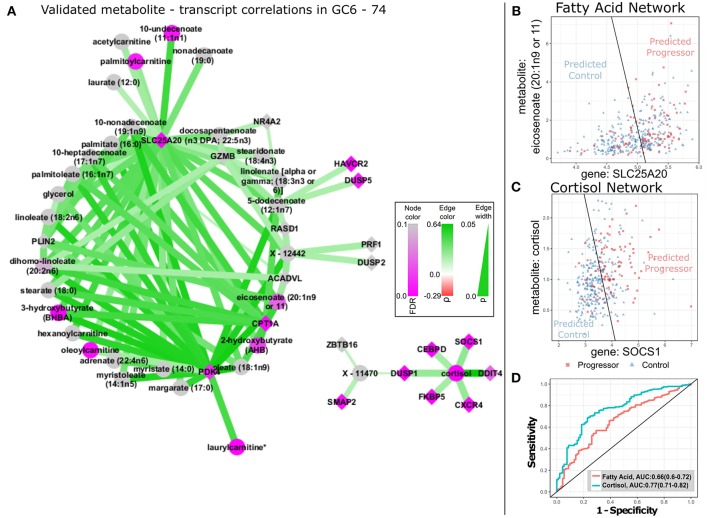
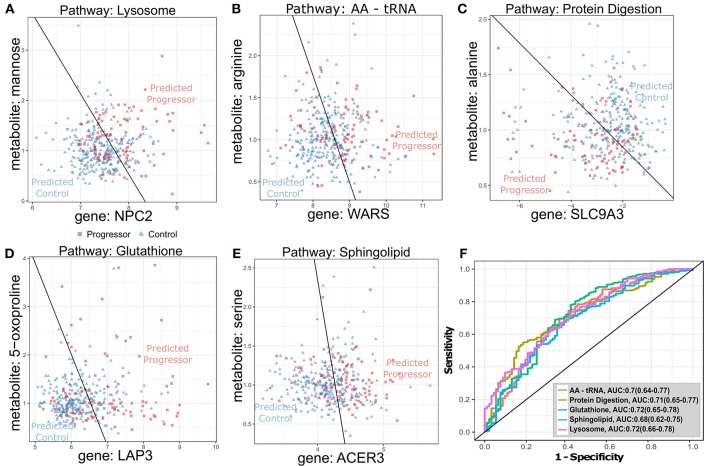
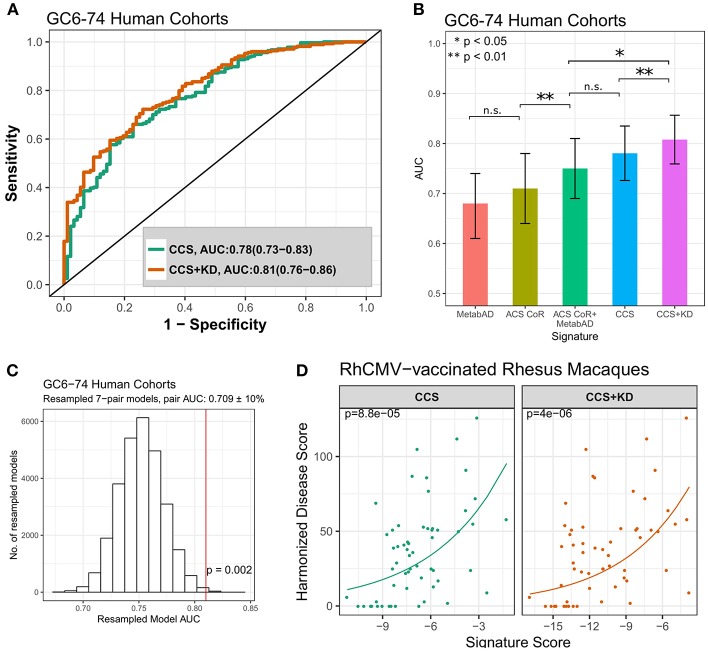
There remains a pressing need for biomarkers that can predict who will progress to active tuberculosis (TB) after exposure to Mycobacterium tuberculosis (MTB) bacterium. By analyzing cohorts of household contacts of TB index cases (HHCs) and a stringent non-human primate (NHP) challenge model, we evaluated whether integration of blood transcriptional profiling with serum metabolomic profiling can provide new understanding of disease processes and enable improved prediction of TB progression. Compared to either alone, the combined application of pre-existing transcriptome- and metabolome-based signatures more accurately predicted TB progression in the HHC cohorts and more accurately predicted disease severity in the NHPs. Pathway and data-driven correlation analyses of the integrated transcriptional and metabolomic datasets further identified novel immunometabolomic signatures significantly associated with TB progression in HHCs and NHPs, implicating cortisol, tryptophan, glutathione, and tRNA acylation networks. These results demonstrate the power of multi-omics analysis to provide new insights into complex disease processes.

Keywords: biomarker; host-pathogen interaction; household contact; inflammation; metabolomics; rhesus macaque; transcriptomics; tuberculosis.


Figures

Figure 1
Figure 1
Performance of a combined transcriptomic and metabolomic signature of TB progression. (A) ROC curves for the ACS CoR transcriptomic signature alone, the MetabAD metabolomic signature alone, and the sum of ACS CoR + MetabAD. Legend shows signature AUCs and bootstrapped 95% confidence intervals around the AUC in parentheses. (B) Scatter plot of ACS CoR scores (x-axis) vs. MetabAD scores (y-axis). Progressor samples are shown as red squares, and Control samples are shown as blue triangles, with signature correlation indicated in the upper left (Spearman's ρ). The dashed black line indicates the linear fit of MetabAD vs. ACS CoR. (C) Scatter plots of individual and combined ACS CoR and MetabAD signature scores vs. harmonized disease score in two RhCMV-vaccinated rhesus macaque studies after M.tb challenge. Poisson regression was used to determine the relationship between signature score, measured 28 days post-challenge and harmonized disease score at time of necropsy. Solid lines represent Poisson regression fits to the harmonized disease score for MetabAD, ACS CoR and ACS CoR + MetabAD, respectively and p-values shown in the top left of each plot indicate significance of association between signature score and harmonized disease score.
Figure 2
Figure 2
TB-related biological networks inferred from correlations in GC6-74. (A) Network plot of selected transcript/metabolite pairs previously identified as correlated in KORA F4 that are also significantly correlated in GC6-74 samples. Transcript nodes are shown as diamonds, metabolite nodes as circles, with significant correlations indicated by edges linking transcripts and metabolites. Positive correlations between metabolites and transcripts are shown as green edges and negative correlations as red. Darker shades indicate stronger correlations (legend at center right). Transcripts and metabolites that showed significant association with TB progression are shaded in purple, with unassociated nodes shaded gray. Darker shades indicate more significant association, according to legend in bottom left. (B,C) Scatter plots of the levels of the optimal fatty-acid (SLC25A20/eicosenoate) and cortisol (SOCS1/Cortisol) transcript (y-axis)/ metabolite (x-axis) pairs in all GC6-74 samples. Progressor samples are shown as red squares, and control samples are shown as blue triangles. The optimal logistic regression classification boundary for each pair is shown as a black line, and text labels “Predicted Progressor” and “Predicted Control” indicate logistic regression binary predictions either side of the classification boundary. (D) ROCs for the fatty-acid and cortisol logistic regression pair models shown in (B,C) predicting all GC6-74 samples. AUCs for each model are shown in the legend, with 95% CIs in parentheses.
Figure 3
Figure 3
Optimal transcript-metabolite pairs derived from canonical pathways predictive of TB progression in GC6-74 (A–E): Scatter plots of transcript (x-axis) and metabolite (y-axis) expression for transcript-metabolite pairs from canonical pathways significantly enriched for differential expression in all GC6-74 samples: Lysosome, AA-tRNA, protein digestion, glutathione and sphingolipid, respectively. Samples taken from TB progressors (Progressor) are shown as red squares, and samples from non-progressors (Control) are shown as blue triangles. The optimal logistic regression classification boundary is shown as a black line, and text labels “Predicted Progressor” and “Predicted Control” indicate logistic regression binary predictions either side of the classification boundary. (A–E) Scatter plots for the top pair from each pathway. (F) ROCs for each pair logistic regression model classifying all GC6-74 samples. AUCs for each model are shown in the legend, with 95% CIs in parentheses.
Figure 4
Figure 4
Comparison of the pathway-derived signatures to previously discovered signature of risk of TB progression. (A) ROC curves for the pathway-derived CCS and CCS+KD signatures on all GC6-74 samples. (B) Comparison of the ROC AUCs of the external signatures (MetabAD and ACS CoR), the combined ACS CoR + MetabAD, and the pathway-based signatures (CCS, CCS+KD). Error bars represent 95% confidence intervals around the AUC. (C) Distribution of model AUCs from randomly resampled transcript-metabolite pairs with similar AUCs to pairs in the CCS+KD model. AUC of the CCS+KD signature is indicated by vertical red line. P-value indicates the proportion of resampled models with AUC > CCS+KD. (D) Scatter plots of CCS and CCS+KD signature scores vs. harmonized disease score in two RhCMV-vaccinated rhesus macaque studies after M.tb challenge. Poisson regression was used to determine the relationship between signature score, measured 28 days post-challenge and harmonized disease score at time of necropsy. Solid lines represent Poisson regression fits to the harmonized disease score for CCS and CCS+KD, respectively. P-values shown in the top left of each plot indicate significance of association between signature score and harmonized disease score.

References

    1. World Health Organization Global Tuberculosis Report. Geneva (2018). Available online at: http://www.who.int/tb/publications/global_report/en/
    1. Mandalakas AM, Starke JR. Current concepts of childhood tuberculosis. Semin Pediatr Infect Dis. (2005) 16:93–104. 10.1053/j.spid.2005.01.001 - DOI - PubMed
    1. Marais BJ, Graham SM, Cotton MF, Beyers N. Diagnostic and management challenges for childhood tuberculosis in the era of HIV. J Infect Dis. (2007) 196(Suppl 1):S76–85. 10.1086/518659 - DOI - PubMed
    1. Pawlowski A, Jansson M, Skold M, Rottenberg ME, Kallenius G. Tuberculosis and HIV co-infection. PLoS Pathog. (2012) 8:e,1002464. 10.1371/journal.ppat.1002464 - DOI - PMC - PubMed
    1. Dooley KE, Chaisson RE. Tuberculosis and diabetes mellitus: convergence of two epidemics. Lancet Infect Dis. (2009) 9:737–46. 10.1016/S1473-3099(09)70282-8 - DOI - PMC - PubMed

Publication types