. 2019 Mar 22:10:230.
doi: 10.3389/fgene.2019.00230. eCollection 2019.

Systems Biology Reveals NR2F6 and TGFB1 as Key Regulators of Feed Efficiency in Beef Cattle

Affiliations

Systems Biology Reveals NR2F6 and TGFB1 as Key Regulators of Feed Efficiency in Beef Cattle

Pâmela A Alexandre et al. Front Genet. .

Abstract

Systems biology approaches are used as strategy to uncover tissue-specific perturbations and regulatory genes related to complex phenotypes. We applied this approach to study feed efficiency (FE) in beef cattle, an important trait both economically and environmentally. Poly-A selected RNA of five tissues (adrenal gland, hypothalamus, liver, skeletal muscle and pituitary) of eighteen young bulls, selected for high and low FE, were sequenced (Illumina HiSeq 2500, 100 bp, pared-end). From the 17,354 expressed genes considering all tissues, 1,335 were prioritized by five selection categories (differentially expressed, harboring SNPs associated with FE, tissue-specific, secreted in plasma and key regulators) and used for network construction. NR2F6 and TGFB1 were identified and validated by motif discovery as key regulators of hepatic inflammatory response and muscle tissue development, respectively, two biological processes demonstrated to be associated with FE. Moreover, we indicated potential biomarkers of FE, which are related to hormonal control of metabolism and sexual maturity. By using robust methodologies and validation strategies, we confirmed the main biological processes related to FE in Bos indicus and indicated candidate genes as regulators or biomarkers of superior animals.

Keywords: Bos indicus; Nellore (Zebu); feed efficiency; inflammation; motif discovery; muscle development; regulatory gene network; residual feed intake.


Figures

FIGURE 1
FIGURE 1
Genes selected for co-expression network construction. (A) Heatmap of normalized mean expression (NME) of 471 differentially expressed (DE) genes between high (HFE) and low (LFE) feed efficient animals in adrenal gland (ADR), hypothalamus (HYP), liver (LIV), muscle (MUS) and pituitary (PIT). Genes (rows) and samples (columns) are organized by hierarchical clustering based on Euclidean distances. (B) NME heatmap of all 1,335 genes selected for network construction. Genes (columns) and samples (rows) are organized by hierarchical clustering based on Euclidean distances. (C) Venn diagram of 1,335 genes selected for network construction. The inclusion criteria for selecting genes were divided into five categories: differentially expressed genes (DE), tissue specific genes (TS), genes harboring SNPs reported in literature as being associated with feed efficiency in beef cattle (SNP), genes encoding proteins secreted by at least one of the tissues in plasma (SEC) and key regulators (REG). Numbers between brackets indicate the total number of genes in each category.
FIGURE 2
FIGURE 2
Gene co-expression network constructed using PCIT algorithm on 1,335 selected genes (see Section “Materials and Methods”). Only significant correlations above | 0.9| and their respective genes were considered, totaling to 1,317 genes and 91,932 connections. Nodes with diamond shape correspond to genes coding for proteins secreted in plasma and triangles correspond to key regulators; all the other genes are represented by ellipses. Nodes with black borders are differentially expressed between high and low feed efficiency groups. Colors are relative to the tissue of maximum expression: blue represents liver, red represents muscle, yellow represents pituitary, green represents hypothalamus and orange represents adrenal gland. The size of the nodes is relative to the normalized mean expression values in all samples.
FIGURE 3
FIGURE 3
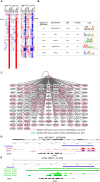
Mapping of NR2F6 direct targets. (A) Heatmap of the 313 genes co-expressed with NR2F6 across all samples (derived from the co-expression analysis), (B) i-Regulon motif discovery results on the genes shown in panel (A), (C) Predicted NR2F6 targetome. A red node indicates genes known to be targeted by NR2F6 in human Hepatocytes. (D) Example of predicted NR2F6 target regions for SERPINA1 gene. The predicted enhancer overlaps the exact position for NR2F6 and NR2F2 binding in HepG sites from the ENCODE dataset as well as histone chromatin marks related to active regulatory regions, namely H3K27ac, and promoters, H3K4me3 in human primary tissue from RoadMap Epigenetics (E) The enhancer prediction in cow coordinates (bosTau6) overlaps a region marked with H3K4me3 in cow liver (Villar et al., 2015).
FIGURE 4
FIGURE 4
Mapping the downstream network of TGFB1 signaling through SMAD3/MyoD1 DNA binding. (A) Heatmap of the 217 genes co-expressed with TGFB1 (derived from the co-expression analysis). (B) i-Regulon motif discovery results on the genes shown in panel (A), (C) Predicted MyoD targetome. A red node indicates genes know to be targeted my MyoD1 in murine myotubes (Mullen et al., 2011). Blue nodes indicate genes to be targeted by SMAD3, the effector DNA binding molecular of TGFB1 signaling, in murine myotubes (Mullen et al., 2011). (D) Example of predicted MyoD1 target regions for ACTA1 gene. The predicted enhancer overlaps the exact position for SMAD3 and MyoD1 ChIP-seq binding in murine myotubes (Mullen et al., 2011). (E) The enhancer prediction in cow coordinates (bosTau6) overlaps a promoter region marked with H3K4me3 in muscle tissue in cow (Zhao et al., 2015).

References

    1. Aerts S., Quan X. J., Claeys A., Sanchez M. N., Tate P., Yan J., et al. (2010). Robust target gene discovery through transcriptome perturbations and genome-wide enhancer predictions in drosophila uncovers a regulatory basis for sensory specification. PLoS Biol. 8:e1000435. 10.1371/journal.pbio.1000435.g001 - DOI - PMC - PubMed
    1. Alexandre P. A., Kogelman L. J. A., Santana M. H. A., Passarelli D., Pulz L. H., Fantinato-Neto P., et al. (2015). Liver transcriptomic networks reveal main biological processes associated with feed efficiency in beef cattle. BMC Genomics 16:1073. 10.1186/s12864-015-2292-8 - DOI - PMC - PubMed
    1. Anders S., Pyl P. T., Huber W. (2014). HTSeq - A Python framework to work with high-throughput sequencing data. Bioinformatics 31 166–169. 10.1093/bioinformatics/btu638 - DOI - PMC - PubMed
    1. Archer J. A., Arthur P. F., Herd R. M., Parnell P. F., Pitchford W. S. (1997). Optimum postweaning test for measurement of growth rate, feed intake, and feed efficiency in British breed cattle. J. Anim. Sci. 75 2024–2032. 10.2527/1997.7582024x - DOI - PubMed
    1. Archer J. A., Richardson E. C., Herd R. M., Arthur P. F. (1999). Potential for selection to improve efficiency of feed use in beef cattle: a review. Aust. J. Agric. Res. 50 147–161. 10.1071/A98075 - DOI